 Open Access Article
Creative Commons Attribution 3.0 Unported Licence
Surface passivation of carbon dots with ethylene glycol and their high-sensitivity to Fe3+†
Zhaogan Wang‡
a,
Peng Long‡a,
Yiyu Fengacd,
Chengqun Qina and
Wei Feng*abcd
aSchool of Materials Science and Engineering, Tianjin University, Tianjin 300072, P. R. China. E-mail: weifeng@tju.edu.cn
bCollaborative Innovation Center of Chemical Science and Engineering (Tianjin), Tianjin 300072, P. R. China
cKey Laboratory of Advanced Ceramics and Machining Technology, Ministry of Education, Tianjin 300072, P. R. China
dTianjin Key Laboratory of Composite and Functional Materials, Tianjin 300072, P. R. China
First published on 12th January 2017
Abstract
Hydroxyl functionalized carbon dots (H-CDs) were prepared by monoesterification of ethylene glycol. The H-CDs exhibit a narrow size distribution of 1–4 nm and enhanced photoluminescent (PL) intensity due to an increased amount of electron donor hydroxyl groups. According to fluorescence spectra, the H-CDs exhibit a high sensitivity to Fe3+ with a detection limit of 2.56 nM, which is superior to the detection limit of CDs (7.4 μM). The quenching fluorescence is primarily controlled by the formation of a chelate compound based on the complexation between Fe3+ and the hydroxyl on the surface of the H-CDs. Furthermore, we demonstrate that paper impregnated with H-CDs exhibits a high sensitivity to Fe3+ by fluorescence quenching. In the future, the modified CDs can be developed for high sensitivity fluorescent probes by optimizing the chemical structures and microstructures.
1. Introduction
Iron(III) ion is an essential element of hemoglobin. It is vitally important for the environment to develop efficient detection technologies with high selectivity and sensitivity toward Fe3+.1 Over the past several years, a large number of Fe3+ detection technologies have been rapidly developed,2 including flame atomic absorption spectroscopy (FAAS), atomic emission spectroscopy (AES), inductively coupled plasma mass spectrometry (ICPMS), and electrochemical sensors.Recently, carbon dots (CDs) have become an attractive candidate as fluorescent probes for Fe3+ detection because of their outstanding physical, chemical, and optical properties (e.g., high photostability, water solubility, good biocompatibility, eco-friendly preparation, and widely available precursors).3–9 In the past few years, significant efforts have been devoted to the synthesis of fluorescent carbon dots for Fe3+ detection by many different research groups. Qu et al. first prepared fluorescent CDs by using a simple hydrothermal treatment on dopamine; the resulting CDs could serve as Fe3+ sensors with a detection limit as low as 0.32 μM.8 Chen et al. presented a facile electrochemical strategy for graphene quantum dots (GQDs) from monolithic 3D graphene. The GQDs show an optical selectively and sensitivity towards Fe3+ with a detection limit of 7.22 μM.9 However, the CDs or GQDs, without surface-passivation, possess multiple disadvantages, including an unsatisfactory Fe3+ detection limit and a relatively low quantum yield.10
Previous studies showed that the oxygen-containing functional groups of CDs play an important role in the recombination or separation of electron–hole pairs, which affects the fluorescence properties.11–13 Specifically, the carboxyl groups can form nonradiative recombination centres that act as electron acceptors, thus lowering fluorescence.14–16 In contrast, the hydroxyl groups, which act as electron donors, facilitate fast carrier mobility, which would be of benefit to the fluorescence emission.12 Thus, the surface chemistry of the CDs is a key parameter for the luminescence performance.15,17,18 According to previous studies, the hydroxyls on the surface of CDs form complexes with Fe3+, owing to coordination interaction.19 The formed Fe–CDs complexes could facilitate charge transfer and restrain exciton recombination, leading to significant fluorescence quenching.20,21
Thus, in order to improve the fluorescence intensity and the detection sensitivity, we report a simple synthetic route to prepare hydroxyl functionalized fluorescent carbon dots. In this experiment, we utilize the hydroxyl group of ethylene glycol and the carboxyl on the surface of the CDs to synthesize hydroxyl functionalized fluorescent carbon dots through monoesterification. The schematic illustration of the synthesis of the CDs and the detection mechanism are shown in Scheme 1. First, the CDs for hydroxyl functionalized were synthesized via a hydrothermal reaction. Then, we chose MeSO3H and Al2O3 as catalytic agents to synthesize hydroxyl functionalized carbon dots (H-CDs) through monoesterification with ethylene glycol. The microstructures of the CDs and H-CDs were characterized by high-resolution transmission electron microscopy (HRTEM). Fourier transform infrared (FTIR) spectroscopy and X-ray photoelectron spectroscopy (XPS) were used to measure the chemical structures of the CDs and H-CDs. The optical properties were investigated by UV-vis absorption and photoluminescence (PL) spectra. Furthermore, we demonstrate the proof of concept that CDs with hydroxyls covered surfaces can be used as a very effective fluorescent sensing platform for selective detection of Fe3+.
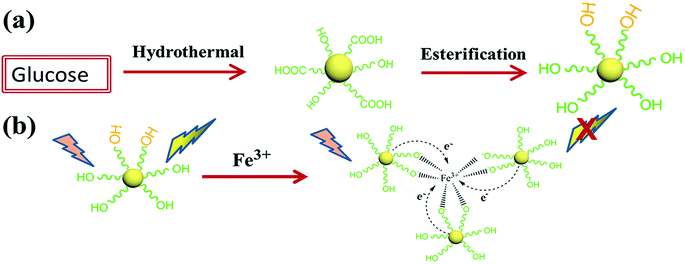 | ||
| Scheme 1 A schematic illustration of (a) the synthesis procedure of the H-CDs and (b) the formation process between H-CDs and Fe3+ for the chelate compound. | ||
2. Experimental
2.1 Materials
Glucose and MeSO3H were obtained from Aladdin chemistry Co. Ltd. (Shanghai, China), Al2Cl3, ZnCl2, BaCl2, FeCl2, CuCl2, NiCl3, CrCl3, PbCl2, CoCl2, FeCl3 and AgNO3 were purchased from J&K Chemical Company (Beijing, China). Anhydrous ethanol and deionized water were obtained from Tianjin Guangfu technology development Co., Ltd. All the chemicals were analytical grade reagents and used without further purification.2.2 Preparation of CDs
The initial CDs for hydroxyl functionalization were synthesized via a hydrothermal reaction, together with a mount of reagent for the formation of the CDs. In a typical experiment, 1000 mg of glucose was dispersed in 80 ml of ethanol by sonication for 10 min using an ultrasonic generator. Next, the mixture was transferred into a 150 ml Teflon lined autoclave and heated at 180 °C for 18 h. After that, the products were then allowed to cool to ambient temperature naturally. The obtained solution was collected by removing the impurities through centrifugation at 16![[thin space (1/6-em)]](https://www.rsc.org/images/entities/char_2009.gif) 000 rpm for 15 min.
000 rpm for 15 min.
2.3 General procedure for H-CDs
In a typical experiment, MeSO3H (1 ml, 15 mmol) and Al2O3 (270 mg, 3 mmol), which were the catalytic agents, were added to the above CDs (20 ml). The mixture was stirred and heated at 80 °C for 8 h.22 Next, the solution was centrifuged at 16![[thin space (1/6-em)]](https://www.rsc.org/images/entities/char_2009.gif) 000 rpm for 15 min to separate out the catalytic agents. Finally, the obtained H-CDs were dialyzed in water through a dialysis membrane (500 MWCO) for 72 h.
000 rpm for 15 min to separate out the catalytic agents. Finally, the obtained H-CDs were dialyzed in water through a dialysis membrane (500 MWCO) for 72 h.
2.4 Fluorescent sensing of Fe3+
In a typical assay, 1.00 ml of the CDs solution (1 mg ml−1), which were dispersed in deionized water, was placed in a 10 ml colorimetric tube, and 1.00 ml of a phosphate buffer saline (PBS, 10 mM, pH = 7) solution was added to keep the system under a neutral pH condition. Following this, different concentrations of Fe3+ solution (10 μl), which were obtained by dispersing FeCl3 in deionized water, were added. The FL spectra were recorded after reaction for 5 min. The selectivity of Fe3+ was confirmed by adding other metal ions solutions (Al2Cl3, ZnCl2, BaCl2, FeCl2, CuCl2, NiCl3, CrCl3, PbCl2, CoCl2 and AgNO3) in place of FeCl3 in a similar way. All experiments were performed at room temperature.2.5 Determination of fluorescence quantum yield
The quantum yield (QY) of H-CDs was calculated according to a previously reported procedure.23,24 The optical densities were obtained on a UV-vis spectrophotometer. Quinine sulfate was dissolved in 0.1 M H2SO4 as a reference standard. Absolute values were measured using the standard reference sample, which has a fixed fluorescence quantum yield value (0.54 at 360 nm). The QY of the CDs was calculated by the following equation with five different concentrations.| Qs = QR(K/KR)(η/ηR)2 | (1) |
2.6 Characterization
The microstructures of the CDs and H-CDs were recorded by TEM (Philips Tecnai G2F20). FTIR spectra were obtained on Bruker Tensor 27 spectrometer, XPS analysis was completed with a PERKIN ELMZR PHI 3056 spectrometer with an Al anode source operated at 15 kV and an applied power of 350 W. UV-vis absorption and PL were studied using a spectrophotometer (UV-3600, Shimadzu) and a spectrofluorometer (Fluorolog3, HORIBA, Jobin Yvon), respectively.3. Results and discussion
The oxygenic functional groups in the glucose molecule and the high temperature and pressure conditions make it easy for a dehydration reaction to occur during the hydrothermal reaction. Via the dehydration reaction, the glucose molecules were pyrolyzed, cross-linked, and finally converted into carbon dots.26,27 Various oxygenic groups were introduced along the surface of the carbon dots in the hydrothermal reaction process. Normally, glucose cannot dissolve in ethanol; however, through the hydrothermal reaction process, the glucose is dissolved in the solution and a change in colour occurs (e.g., from transparent to dark brown) as a result of the formation of CDs. Moreover, after modification, the colour of CDs turns from dark brown to yellow. This is because the carboxyl moieties on the CDs changed to hydroxyl groups and thus significantly increased the amount of hydroxyl groups on the surface of CDs.Fig. 1 shows the TEM images of the CDs and H-CDs. The prepared CDs and H-CDs were mostly spherical in shape and monodispersed without agglomeration. The distributions of particle sizes are shown in the insets, indicating that the carbon dots was uniformly distributed. It is worth noting that the H-CDs exhibit a narrower size distribution. As shown in these figures, the diameters of the H-CDs are in the range of 1–3 nm (average of 2.0 nm), which is smaller than CDs (average of 3.5 nm). This feature is attributed to the etching of CDs surface by the ligand.28–30 HRTEM images (insets) of CDs and H-CDs show well-resolved lattice fringes with an in-plane lattice spacing of 0.28 nm and 0.21 nm, respectively, which are consistent with the (020), (100) diffraction facets of graphite carbon, respectively.31,32
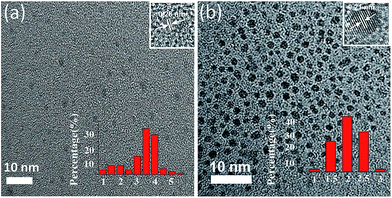 | ||
| Fig. 1 TEM images of (a) the CDs and (b) H-CDs, the top insets are HRTEM images of these CDs and the lower insets show the size distribution calculated based on 50 nanoparticles. | ||
Fig. 2 shows the FTIR and the XPS data of the CDs and H-CDs. From the FT-IR spectra of the CDs, the obvious absorption peak centred at 1652 cm−1, which is caused by C![[double bond, length as m-dash]](https://www.rsc.org/images/entities/char_e001.gif) C stretching vibration, can be observed. Moreover, the bending vibration of C–H at 937 cm−1 and 2965 cm−1 further confirmed the existence of C
C stretching vibration, can be observed. Moreover, the bending vibration of C–H at 937 cm−1 and 2965 cm−1 further confirmed the existence of C![[double bond, length as m-dash]](https://www.rsc.org/images/entities/char_e001.gif) C. During the hydrothermal reaction process, the precursor molecules were dehydrated to form C
C. During the hydrothermal reaction process, the precursor molecules were dehydrated to form C![[double bond, length as m-dash]](https://www.rsc.org/images/entities/char_e001.gif) C which is the elementary unit of the as-prepared CDs.26 From the FT-IR spectra of H-CDs, an obvious absorption peak at 1719 cm−1, which is caused by C
C which is the elementary unit of the as-prepared CDs.26 From the FT-IR spectra of H-CDs, an obvious absorption peak at 1719 cm−1, which is caused by C![[double bond, length as m-dash]](https://www.rsc.org/images/entities/char_e001.gif) O stretching vibration, can be observed. In Fig. 2a, the peaks at 1197 cm−1 and 1057 cm−1 are ascribed to the stretching vibrations of the ester group on the surface of H-CDs. This feature is indicative of the change from –COOH to –OH by an esterification reaction on the surface of H-CDs.
O stretching vibration, can be observed. In Fig. 2a, the peaks at 1197 cm−1 and 1057 cm−1 are ascribed to the stretching vibrations of the ester group on the surface of H-CDs. This feature is indicative of the change from –COOH to –OH by an esterification reaction on the surface of H-CDs.
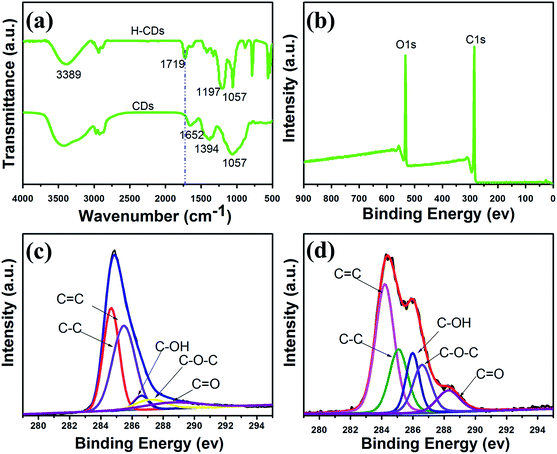 | ||
| Fig. 2 FTIR spectra (a) of CDs and H-CDs; the full XPS spectrum (b) of CDs; the C1s XPS spectrum of CDs (c) and H-CDs (d). | ||
To further confirm the type of functional groups on the surfaces of the as-prepared CDs and H-CDs, XPS characterization was carried out. As shown in Fig. 2b, the CDs only show C and O signals. This implies that the carbon dots contained only oxygenic groups. The C1s spectra of the as-prepared CDs and H-CDs are shown in Fig. 2c and d, respectively. The measured spectra of the “pure” CDs (Fig. 2c) can be deconvoluted into five surface components, corresponding to sp2 (C![[double bond, length as m-dash]](https://www.rsc.org/images/entities/char_e001.gif) C) at the binding energy of 284.5 eV, sp3 (C–C and C–H) at 285.5 eV, C–OH at 286.6 eV, C–O–C at 287.2 eV, and C
C) at the binding energy of 284.5 eV, sp3 (C–C and C–H) at 285.5 eV, C–OH at 286.6 eV, C–O–C at 287.2 eV, and C![[double bond, length as m-dash]](https://www.rsc.org/images/entities/char_e001.gif) O at 288.6 eV.33 The intensity of C–OH for the H-CDs shows a significant increase compared with the CDs. This feature arises from the increasing number of hydroxyl groups on the surface of the CDs. The XPS results imply that the amounts of oxygen-groups present on the surface of the CDs and H-CDs were different. These results determined by the XPS are in good agreement with FTIR results. These demonstrate that the hydroxyl of ethylene glycol has already grafted onto the surface carboxyl of the CDs.
O at 288.6 eV.33 The intensity of C–OH for the H-CDs shows a significant increase compared with the CDs. This feature arises from the increasing number of hydroxyl groups on the surface of the CDs. The XPS results imply that the amounts of oxygen-groups present on the surface of the CDs and H-CDs were different. These results determined by the XPS are in good agreement with FTIR results. These demonstrate that the hydroxyl of ethylene glycol has already grafted onto the surface carboxyl of the CDs.
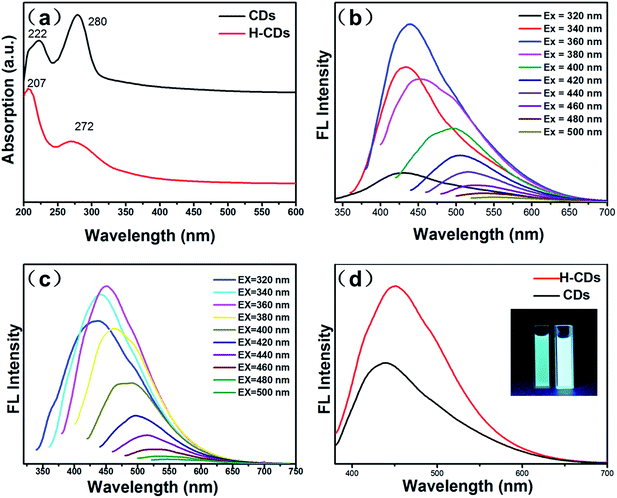
Optical properties were investigated by UV-vis absorption and photoluminescence (PL) spectra. Ultraviolet-visible (UV) absorption spectrum results (Fig. 3a) show that the CDs and H-CDs exhibit two deep UV absorption peaks. The absorption peaks at 222 and 207 nm for the CDs and H-CDs, respectively, resulted from the π–π* transition of C![[double bond, length as m-dash]](https://www.rsc.org/images/entities/char_e001.gif) C, and the absorptions at 280 and 272 nm for the CDs and H-CDs, respectively, correspond to the n–π* transition of the C
C, and the absorptions at 280 and 272 nm for the CDs and H-CDs, respectively, correspond to the n–π* transition of the C![[double bond, length as m-dash]](https://www.rsc.org/images/entities/char_e001.gif) O bond.34,35 The observed deviations in the UV absorption indicate that the different kinds and amounts of the oxygen-containing groups can affect the optical properties of CDs.3
O bond.34,35 The observed deviations in the UV absorption indicate that the different kinds and amounts of the oxygen-containing groups can affect the optical properties of CDs.3
The PL emission spectra were primarily investigated under excitation wavelengths. The PL emission spectra show that both the CDs and H-CDs exhibit the strongest PL emission peak when excited at 360 nm. Fig. 3b and c indicate that the emission of the CDs and H-CDs are highly dependent on the excitation energy and the emission red-shifts with increasing excitation wavelength. Moreover, the PL intensities (Fig. 3d and S1†) of the H-CDs are greatly enhanced in comparison with the CDs by reducing the amount of nonradiative recombination centres caused by the carboxyl groups and increasing the amount of the hydroxyl groups, which contribute to enhancing the fluorescence intensity.3
It is worth pointing out that these as-prepared CDs also exhibit considerable photostability. No obvious aggregation could be observed even after storage at room temperature for several months, which is attributed to the electrostatic repulsions between the CDs resulting in electrostatic stabilization of the “pure” CDs and H-CDs in aqueous solution. The QYs of the H-CDs is 13% which were calculated according to the above-mentioned rules, which is higher than that of the CDs (7%). This indicates that the increase in surface hydroxyls on the CDs can improve the QYs.
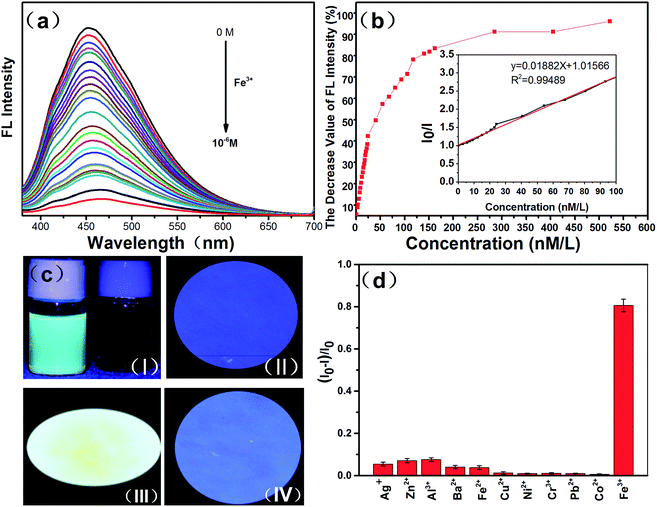
The FTIR spectroscopy and XPS results show that we successfully synthesized H-CDs terminated with hydroxyl groups on the surface using the reaction described above. According to previous studies, hydroxyls on the surface of CDs could form complexes with Fe3+ ions owing to coordination interaction.19 During the complexation process, electrons in the excited state of the H-CDs can transfer to the unfilled Fe3+ orbital, leading to nonradiative electron/hole recombination which results in fluorescence quenching.36 Therefore, we further investigated the PL spectra of the H-CDs and CDs solutions in the presence of Fe3+ at different concentrations. Fig. 4a and S2† reveal that the PL intensities of the CDs solution are sensitive to Fe3+ concentration and decrease with an increase in Fe3+ concentration. Fig. 4b and S3† show the dependence of FL intensity on Fe3+ ions concentrations. Here, (I0 − I)/I0 indicates a decrease in the FL intensity, where I and I0 represent the FL intensities of CDs at 360 nm in the presence and absence of Fe3+, respectively. The relationship between the concentration of Fe3+ and the PL intensities of CDs and H-CDs can be well fitted to the Stern–Volmer equation: I0/I = 1 + Ksv[Q], where [Q] is the concentration of Fe3+ and Ksv is the Stern–Volmer constant.37
The Stern–Volmer quenching curves (the inset of Fig. 4b and S3†) show a good linearity with Ksv = 1.9147787 × 10⁷ M−1 and 6.107 × 10³ M−1, indicating that the dynamic quenching processes occur in this sensor system. Moreover, the detection limit for H-CDs is estimated to be 2.56 nM based on 3Sb/k (here Sb was the standard deviation of the blank for 11 replicate measurements and k was the slope of the calibration curve in the linear range), which is superior to the detection limit of the pure CDs (7.4 μM). In order to guarantee the accuracy of our experimental results for the detection limit, we have repeated 11 times of experiments with the concentration of Fe3+ range from 0–100 nM. We calculated the detection limit of H-CDs for Fe3+ in these repeated experiments, respectively. And then the standard deviation of these detection limits was figured out. The detection limits for these experiments were shown in Table S1.† After calculation, the standard deviation of the detection limit for H-CDs is 0.0773 nM. These indicate that the H-CDs show a great promise in the field of detecting Fe3+.
Li et al. have reported that the fluorescence of sulfur-doped graphene quantum dots (S-GQDs) could be effectively quenched by Fe3+ with a detection limit of 4.2 nM.38 Doping with S can effectively modulates the electronic local density of GQDs, which contribute to the coordination interaction between Fe3+ and hydroxyl groups on the edge of S-GQDs thus leading to significant fluorescence quenching. In this paper, we hold that the carboxyl groups can form nonradiative recombination centres that act as electron acceptors, thus lowering fluorescence, whereas the hydroxyl groups act as electron donors, facilitating fast carrier mobility and increasing fluorescence. Furthermore, the hydroxyls on the surface of CDs form the complexes with Fe3+ owing to the coordination interactions. The hydroxyls on the surface of CDs have a significant influence on the interaction with Fe3+. Thus, we utilize ethylene glycol to react chemically with the carboxyl groups of the CDs through glycol monoesters. In this way, we can reduce the content of carboxyl groups and increase the amount of hydroxyls on the surface of H-CDs. This not only enhanced the fluorescence intensity of the H-CDs but can also increase the number of reaction sites with Fe3+. The formed Fe–CDs complexes could facilitate charge transfer and restrain exciton recombination, leading to significant fluorescence quenching. The increased reaction sites with Fe3+ resulting in an increase of the limit of detection. The remarkable fluorescence quenching of the H-CDs shows great promise in detecting Fe3+. The complex formation is illustrated in Scheme 1. Furthermore, the H-CDs can also be used in paper-based detection of Fe3+ as shown in Fig. 4c. First, the filter paper was immersed in the solution of H-CDs with a concentration of 1 mg ml−1. After 6 h, the paper was taken out of the H-CDs solution and then dried in air at room temperature. We found that the H-CDs in filter paper can still maintain a good fluorescence (Fig. 4cIII). Moreover, when we added a few drops of Fe3+ to the filter paper, the fluorescence of the filter paper disappeared (Fig. 4cIV). This shows that the H-CDs can also shows a high sensitivity toward Fe3+ even in solid form.
To evaluate the sensitivity of H-CDs toward other metal ions, we further examined the PL intensity changes upon addition of other metal ions, including Ag+, Zn2+, Al3+, Ba2+, Fe2+, Cu2+, Ni2+, Cr3+, Pb2+, Co2+, under the same conditions. As is shown in Fig. 4d, no tremendous decrease in PL intensity was observed for H-CDs in the presence of the above metal ions (1 mM) except for Fe3+. The concrete data of error bars for the selectivity of H-CDs was shown in Table S2.† The data of error bars are the standard deviation of the decrease value FL intensity during the repeated 11 times experiments. This indicates that the H-CDs have higher selectivity and sensitivity for Fe3+, whereas the other metal ions have little influence on the sensing system. Thus, the H-CDs could be applied in the field to the determine the presence of Fe3+. The reason why the H-CDs are so sensitive to Fe3+ versus the other cations is that the valence electrons of Fe3+ are 4s23d5. The five d orbits are half-filled. The electrons of the complexes formed between Fe3+ and H-CDs are easily transferred to the half-filled 3d orbits of Fe3+, leading to a quenching of the fluorescence.39
4. Conclusions
In summary, we have prepared hydroxyl functionalized carbon dots by monoesterification. The FTIR and XPS results show that the surface chemical composition of the CDs and H-CDs. The as-prepared H-CDs exhibit a narrower size distribution in the range of 1–4 nm (average of 2.0 nm). The PL intensities of the H-CDs are greatly enhanced owing to the decrease in particle size and the change in the surface states. The fluorescence emission of the H-CDs can be quenched by Fe3+ both in aqueous solution and solid form with a detection limit as low as 2.56 nM.Acknowledgements
This work was financially supported by National Natural Science Funds for Distinguished Young Scholars (No. 51425306), the National Key Research and Development Program of China (No. 2016YFA0202302), the State Key Program of National Natural Science Foundation of China (No. 51633007), and National Natural Science Foundation of China (No. 51373116, 51573125 and 513111129).Notes and references
- G. Cairo and A. Pietrangelo, Biochem. J., 2000, 353, 241–250 CrossRef.
- R. R. Gaddam, D. Vasudevan, R. Narayan and K. V. S. N. Raju, RSC Adv., 2014, 4, 57137–57143 RSC.
- S. Zhu, S. Tang, J. Zhang and B. Yang, Chem. Commun., 2012, 48, 4527–4539 RSC.
- B. Liao, W. Wang, P. Long, B. Q. He, F. W. Li and Q. Q. Liu, RSC Adv., 2014, 4, 57683–57690 RSC.
- J. Zhang, Y. Yuan, G. L. Liang and S. H. Yu, Adv. Sci., 2015, 2, 1500002 CrossRef PubMed.
- A. Kumar, A. R. Chowdhuri, D. Laha, S. Chandra, P. Karmakar and S. K. Sahu, RSC Adv., 2016, 6, 58979–58987 RSC.
- A. Tyagi, K. M. Tripathi, N. Singh, S. Choudhary and R. K. Gupta, RSC Adv., 2016, 6, 72423–72432 RSC.
- K. G. Qu, J. S. Wang, J. S. Ren and X. G. Qu, Chem.–Eur. J., 2013, 19, 7243–7249 CrossRef CAS PubMed.
- A. Ananthanarayanan, X. W. Wang, P. Routh, B. Sana, S. R. Lim, D. H. Kim, K. H. Lim, J. Li and P. Chen, Adv. Funct. Mater., 2014, 24, 3021–3026 CrossRef CAS.
- Q. Xu, J. F. Wei, J. L. Wang, Y. Liu, N. Li, Y. S. Chen, C. Gao, W. W. Zhang and T. S. Sreeprased, RSC Adv., 2016, 6, 28745–28750 RSC.
- Q. S. Mei, K. Zhang, G. J. Guan, B. H. Liu, S. H. Wang and Z. P. Zhang, Chem. Commun., 2010, 46, 7319–7321 RSC.
- S. J. Zhu, J. H. Zhang, S. J. Tang, C. Y. Qiao, L. Wang, H. Y. Wang, X. Liu, B. Li, Y. F. Li, W. L. Yu, X. F. Wang, H. C. Sun and B. Yang, Adv. Funct. Mater., 2012, 22, 4732–4740 CrossRef CAS.
- S. L. Hu, R. X. Tian, Y. G. Dong, J. L. Yang, J. Liu and Q. Chang, Nanoscale, 2013, 5, 11665–11671 RSC.
- L. Q. Liu, Y. F. Li, L. Zhan, Y. Liu and C. Z. Huang, Sci. China: Chem., 2011, 54, 1342–1347 CrossRef CAS.
- S. L. Hu, R. X. Tian, L. L. Wu, Q. Zhao, J. L. Yang, J. Liu and S. R. Cao, Chem.–Asian J., 2013, 8, 1035–1041 CrossRef CAS PubMed.
- Q. Y. Xing, W. W. Pei and R. Q. Xu, J. Fundamental Organic Chemistry, Higher Education Press, Beijing, 3rd edn, 2005, pp. 243–245 Search PubMed.
- L. Bao, Z. L. Zhang, Z. Q. Tian, L. Zhang, C. Liu, Y. Lin, B. P. Qi and D. W. Pang, Adv. Mater., 2011, 23, 5801–5806 CrossRef CAS PubMed.
- S. Y. Lim, W. Shen and Z. Q. Gao, Chem. Soc. Rev., 2015, 44, 362–381 RSC.
- Y. L. Wang, L. Wang, H. C. Zhang, Y. Liu, H. Y. Wang, Z. H. Kang and S. T. Lee, RSC Adv., 2013, 3, 3733–3738 RSC.
- L. Song, Y. Y. Cui, C. F. Zhang, Z. B. Hu and X. F. Liu, RSC Adv., 2016, 6, 17704–17712 RSC.
- H. B. Xu, S. H. Zhou, L. L. Xiao, S. Z. Li, T. Song, Y. Wang and Q. H. Yuan, Carbon, 2015, 87, 215–225 CrossRef CAS.
- H. Sharghi and M. H. Sarvari, Tetrahedron, 2003, 59, 3627–3633 CrossRef CAS.
- Z. A. Qiao, Y. F. Wang, Y. Gao, H. W. Li, T. Y. Dai, Y. L. Liu and Q. S. Huo, Chem. Commun., 2010, 46, 8812–8814 RSC.
- S. Chandra, A. R. Chowdhuri, T. K. Mahto, A. Samui and S. K. Sahu, RSC Adv., 2016, 6, 72471–72478 RSC.
- D. P. Kong, F. Y. Yan, Z. Y. Han, J. X. Xu, X. F. Guo and L. Chen, RSC Adv., 2016, 6, 67481–67487 RSC.
- L. B. Tang, R. B. Ji, X. K. Cao, J. Y. Lin, H. X. Jiang, X. M. Li, K. S. Teng, C. M. Luk, S. J. Zeng, J. H. Hao and S. P. Lau, ACS Nano, 2012, 6, 5102–5110 CrossRef CAS PubMed.
- M. Sevilla and A. B. Fuertes, Chem.–Eur. J., 2009, 15, 4195–4203 CrossRef CAS PubMed.
- W. Feng, C. Q. Qin, Y. T. Shen, Y. Li, W. Luo, H. R. An and Y. Y. Feng, Sci. Rep., 2014, 4, 3777 Search PubMed.
- H. G. Zhao, D. F. Wang, M. Chaker and D. L. Ma, J. Phys. Chem. C, 2011, 115, 1620–1626 CAS.
- W. J. Lin, K. L. Fritz, G. Guerin, G. R. Bardajee, S. Hinds, V. Sukhovatkin, E. H. Sargent, G. D. Scholes and M. A. Winnik, Langmuir, 2008, 24, 8215–8219 CrossRef CAS PubMed.
- X. Guo, C. F. Wang, Z. Y. Yu, C. Li and S. Chen, Chem. Commun., 2012, 48, 2692–2694 RSC.
- S. N. Baker and G. A. Baker, Angew. Chem., Int. Ed., 2010, 49, 6726–6744 CrossRef CAS PubMed.
- Z. C. Yang, M. Wang, A. M. Yong, S. Y. Wong, X. H. Zhang, H. Tan, A. Y. Chang, X. Li and J. Wang, Chem. Commun., 2011, 47, 11615–11617 RSC.
- B. B. Campos, R. Contreras-Cáceres, T. J. Bandosz, J. Jiménez-Jiménez, E. Rodríguez-Castellón, J. C. G. Esteves da Silva and M. Algarra, Carbon, 2016, 106, 171–178 CrossRef CAS.
- Z. C. Huang, Y. T. Shen, Y. Li, W. J. Zheng, Y. J. Xue, C. Q. Qin, B. Zhang, J. X. Hao and W. Feng, Nanoscale, 2014, 6, 13043–13052 RSC.
- Q. Xu, P. Pu, J. G. Zhao, C. B. Dong, C. Gao, Y. S. Chen, J. R. Chen, Y. Liu and H. J. Zhou, J. Mater. Chem. A, 2015, 3, 542–546 CAS.
- Y. L. Jiang, Q. R. Han, C. Jin, J. Zhang and B. X. Wang, Mater. Lett., 2015, 141, 366–368 CrossRef CAS.
- S. H. Li, Y. C. Li, J. Cao, J. Zhu, L. Z. Fan and X. H. Li, Anal. Chem., 2014, 86, 10201–10207 CrossRef CAS PubMed.
- Q. S. Mei, C. L. Jiang, G. J. Guan, K. Zhang, B. H. Liu, R. Y. Liu and Z. P. Zhang, Chem. Commun., 2012, 48, 7468–7470 RSC.
Footnotes |
| † Electronic supplementary information (ESI) available: The fluorescence spectrum of CDs and H-CDs at different concentrations, the PL spectra of the CDs solutions in the presence of Fe3+ when excited at different wavelength, the Stern–Volmer relationship of CDs between the PL intensity and the concentration, the standard deviations of the detection limit and selectivity for H-CDs. See DOI: 10.1039/c6ra25465a |
| ‡ Contributed equally. |
| This journal is © The Royal Society of Chemistry 2017 |

