 Open Access Article
Novel polystyrene sulfonate–silica microspheres as a carrier of a water soluble inorganic salt (KCl) for its sustained release, via a dual-release mechanism†
Cong Suia,
Jon A. Preece*b and
Zhibing Zhang*a
aSchool of Chemical Engineering, University of Birmingham, Edgbaston, Birmingham B15 2TT, UK. E-mail: Z.Zhang@bham.ac.uk
bSchool of Chemistry, University of Birmingham, Edgbaston, Birmingham B15 2TT, UK
First published on 3rd January 2017
Abstract
Herein we describe a novel type of organic–inorganic composite solid microsphere, comprised of polystyrene sulfonate and silica (PSS–SiO2), which has been synthesised from polystyrene sulfonic acid and tetraethyl orthosilicate. The microsphere can (i) encapsulate a low molar mass (<100 Da) inorganic salt (KCl), and (ii) provide sustained release (>48 hours) of the salt from the microspheres to an aqueous environment, which has hitherto not been possible. We propose a novel dual-release mechanism of the salt from the microspheres, which leads to the sustained release, and therefore has potential applicability for the controlled and prolonged release of other actives.
Microencapsulation is an important technology providing a means to stabilise active ingredients, and/or control their release for a range of industrial sectors including printing, household care, beauty care, agrochemicals, and pharmaceuticals.1–3 Various techniques have been developed, including interfacial polymerization, in situ polymerization, solvent evaporation and coacervation, to encapsulate different types of active ingredients, which can be oil-soluble, water-soluble, liquids or powders.4–8 Microencapsulation of water-soluble active ingredients is usually achieved by creating a water/oil emulsion followed by chemical reaction and physical self-assembly at the interface of the two liquids.2,9 Water soluble molecules ranging from large biomolecules (such as proteins, polysaccharides, enzymes) to small molecules (such as doxorubicin, carbamide peroxide, polyphenols), and inorganic salts have been encapsulated in microcapsules.9–15 The significances of microencapsulation of water soluble inorganic salt include not only applications in making functional food products and controlling phase change for energy storage, but also in oral care and increasing the osmotic pressure inside microcapsules to control the release of organic molecule.16–19 However, soluble inorganic salt in microcapsules tends to release to aqueous environment quickly, e.g. all potassium chloride (KCl) encapsulated in ethylcellulose and Eudragit microspheres of 250 to 595 μm in diameter was released within 6 hours.19–21 To our best knowledge, it has not been possible to achieve sustained release of inorganic salt longer than 6 hours in terms of microencapsulation.
Herein, we report (i) a facile method to synthesize a novel type of microsphere from polystyrene sulphonic acid and tetraethyl orthosilicate (TEOS), which affords a polystyrene sulphonate–silica organic–inorganic composite (PSS–SiO2) with encapsulated KCl, as a model of low molar mass water soluble inorganic salt, (ii) together with the KCl release studies revealing sustained release over 48 hours, upon dispersion of the microspheres in water. The key to the sustained release of the salt was attributed to a dual mechanism in which the K+ was released initially through PSS/K+ complex being released from the microspheres over 1 h, and the subsequent slower release of K+ directly from the microsphere from ∼12 hours to >48 hours.
The PSS–SiO2 microparticles were synthesized in the emulsion droplets, formed from an aqueous phase (3 mL) containing polystyrene sulfonic acid (0.6 g) and KCl (100 mg) and an oil phase (100 mL) (3![[thin space (1/6-em)]](https://www.rsc.org/images/entities/char_2009.gif) :
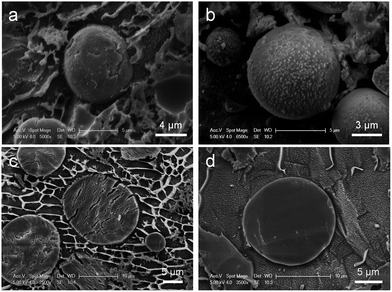
:![[thin space (1/6-em)]](https://www.rsc.org/images/entities/char_2009.gif) 100 v/v) containing polyglycerol polyriconoleate (0.8 g), to which TEOS (0.7 mL or 1 mL) was added dropwise (4 hours). Thus, two samples of PSS–SiO2 microparticles were synthesized, PSS–0.7SiO2 and PSS–SiO2, respectively. The optical micrographs and size distributions of both particle samples are shown in Fig. 1a, b and c, respectively. The PSS–0.7SiO2 microparticles revealed a non-spherical shape (Fig. 1a), whilst PSS–SiO2 were essentially spherical (Fig. 1b). The size distributions illustrate that the volume weighted mean diameter (D32) were 11.41 ± 0.03 μm (SPAN 1.35 ± 0.02) and 17.15 ± 0.04 μm (SPAN 1.284 ± 0.001) for PSS–0.7SiO2 and PSS–SiO2, respectively. The microparticle size distributions look wide, which was attributed to the fed-batch (aqueous phase in oil emulsification followed by dropwise addition of TEOS) process to prepare them, and was typical for similar processes.20 Clearly, the amount of the tetraethyl orthosilicate in the synthesis influenced the morphology and size of the resulting particles. The PSS–SiO2 microparticles displayed smoother surface, more compact structure and larger particle sizes. Presumably, the lower content of TEOS led to the obtained PSS–0.7SiO2 microparticles not ripened fully, and hence afforded the cracked surface and fractured SiO2 structure (Fig. 2). Meanwhile, the evaporation of the water phase during the formation and drying processes led to the PSS–0.7SiO2 microparticles smaller than PSS–SiO2. In Fig. 2b, there were small particles on the surface of the microsphere, which might be ice particles since the image was taken by cryo-SEM, as also seen in the background.
100 v/v) containing polyglycerol polyriconoleate (0.8 g), to which TEOS (0.7 mL or 1 mL) was added dropwise (4 hours). Thus, two samples of PSS–SiO2 microparticles were synthesized, PSS–0.7SiO2 and PSS–SiO2, respectively. The optical micrographs and size distributions of both particle samples are shown in Fig. 1a, b and c, respectively. The PSS–0.7SiO2 microparticles revealed a non-spherical shape (Fig. 1a), whilst PSS–SiO2 were essentially spherical (Fig. 1b). The size distributions illustrate that the volume weighted mean diameter (D32) were 11.41 ± 0.03 μm (SPAN 1.35 ± 0.02) and 17.15 ± 0.04 μm (SPAN 1.284 ± 0.001) for PSS–0.7SiO2 and PSS–SiO2, respectively. The microparticle size distributions look wide, which was attributed to the fed-batch (aqueous phase in oil emulsification followed by dropwise addition of TEOS) process to prepare them, and was typical for similar processes.20 Clearly, the amount of the tetraethyl orthosilicate in the synthesis influenced the morphology and size of the resulting particles. The PSS–SiO2 microparticles displayed smoother surface, more compact structure and larger particle sizes. Presumably, the lower content of TEOS led to the obtained PSS–0.7SiO2 microparticles not ripened fully, and hence afforded the cracked surface and fractured SiO2 structure (Fig. 2). Meanwhile, the evaporation of the water phase during the formation and drying processes led to the PSS–0.7SiO2 microparticles smaller than PSS–SiO2. In Fig. 2b, there were small particles on the surface of the microsphere, which might be ice particles since the image was taken by cryo-SEM, as also seen in the background.
 | ||
| Fig. 1 Optical micrographs of the (a) PSS–0.7SiO2 and (b) PSS–SiO2 microparticles. (c) The size distributions (DLS) of PSS–0.7SiO2 and PSS–SiO2 microparticles. | ||
 | ||
| Fig. 2 Cryo-SEM images of the intact (a) PSS–0.7SiO2, and (b) PSS–SiO2 microspheres, and the cross-section (freeze-fracture) (c) PSS–0.7SiO2, and (d) PSS–SiO2 microspheres. | ||
The PSS–0.7SiO2 microspheres revealed a fractured surface (Fig. 2a), whilst PSS–SiO2 microspheres were relatively smooth and more spherical (Fig. 2b). The cross-section of the PSS–0.7SiO2 microspheres revealed the fracturing was not limited to the surface (Fig. 2c); in contrast, the PSS–SiO2 microspheres were solid throughout (Fig. 2d). Clearly, the concentration of initial silicon monomer (TEOS) affected the size, shape and morphology of the particles.
The phase of the PSS–SiO2 microspheres was confirmed by XRD, which indicates an amorphous SiO2 phase through the absence of diffraction peaks (Fig. 3a).21 The Fourier-transform infrared (FT-IR) spectra of PSS–SiO2 micropheres are shown in Fig. 3b. The absorption peaks at around 1077, 799 and 452 cm−1 were attributed to the antisymmetric stretching, symmetric stretching and bending vibrations of Si–O–Si bonds, and the peak at around 940–960 cm−1 corresponded to Si–OH stretching vibrations, respectively.22–25 The absorbances at 1178 (1184), 1127 (1130), 1034 (1042) and 1006 (1011) cm−1 were assigned to the spectrum of PSS component in the PSS–SiO2 composite (the values in brackets are neat PSS26). The shift to lower wavenumber compared to the spectrum of the neat PSS is presumably due to the conformationally more restrictive composite matrix and/or the sulphonic acid groups having undergone ion exchange with K+.27,28
 | ||
| Fig. 3 (a) X-ray diffraction (XRD) pattern and (b) FT-IR spectra of PSS–SiO2 micropheres. (c) Thermogravimetric analysis (TGA) curves of the PSS–0.7SiO2 and PSS–SiO2 microparticles. | ||
Fig. 3c presents the TGA thermograms of PSS–0.7SiO2 and PSS–SiO2, both revealing multistep weight loss. The first weight loss at ∼100 °C was attributed to the loss of ‘weakly’ bound water, and the second loss (100–200 °C) was due to water which hydrates the –SO3−K+ groups.29 The third loss starting at ∼320 °C was assigned to the degradation of sulfonate moiety in the PSS,29 followed by the final decomposition of the ‘polystyrene’ from 420 to 490 °C.29 It can be concluded from the thermograms that PSS–0.7SiO2 microspheres contained a higher amount of water and PSS. The residual mass of the two samples were 61% and 70% for PSS–0.7SiO2 and PSS–SiO2, respectively, which confirms that the silica content was higher for the PSS–SiO2 microspheres, suggesting that this is the reason for the greater structural integrity of the PSS–SiO2 microspheres, relative to PSS–0.7SiO2 microspheres (Fig. 2).
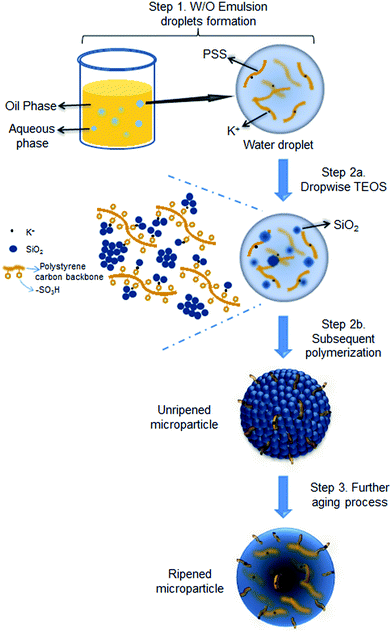
The proposed formation mechanism of the PSS–SiO2 microspheres is shown in Scheme 1. Initial ion exchange of the sulfonic acid protons for K+ occurred during the water in oil emulsification step (Step 1, Scheme 1).30,31 To this emulsion TEOS was added dropwise, leading to its hydrolysis (Step 2a, Scheme 1) and subsequent polymerization (Step 2b, Scheme 1) forming initially discrete SiO2 particles intercalated into the PSS–K complex by ionic bonds in the aqueous microsphere,32 which might be similar to the process of forming PSS–silica hybrids utilizing the ionic interactions between the amino groups and silica.33 The SiO2 particles ripened and grew (Step 3, Scheme 1) within the aqueous microsphere trapping the PSS/K+ and free KCl. The reduced TEOS monomer synthesis affording PSS–0.7SiO2 microspheres, which revealed defects within the structure (Fig. 2a and c), presumably could not ripen fully, and hence afforded the fractured SiO2 texture.
 | ||
| Scheme 1 Illustration of PSS–SiO2 microspheres synthesis with KCl encapsulated via acid catalysed reaction. | ||
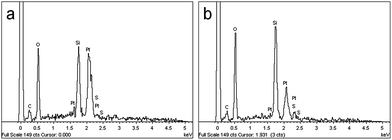
The energy dispersive X-ray (EDX) analysis of a PSS–0.7SiO2 microsphere revealed the elemental composition of both the surface (Fig. 4a) and inner core (Fig. 4b) contained Si, C, and S in similar ratios, which supports the proposed inclusion of PSS in the formation process. There was no evidence of K+ in the EDX analysis, presumably because the concentration of K+ (less than 0.3 mmol L−1) was lower than the limit of detection (1.2 mmol L−1) in the EDX experiment.34 However, K+ was observed in the release studies described below.
 | ||
| Fig. 4 EDX analysis of (a) the microsphere surface and (b) the inner core of PSS–0.7SiO2 microspheres. | ||
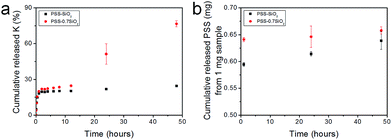
The microspheres were dispersed in water and the release of both K+ and PSS from the microspheres was monitored, via removal of aliquots at extended time intervals over 48 hours, and analysis with flame photometry (K+) and UV/Vis spectroscopy (PSS). Interestingly, not only did PSS–0.7SiO2 (Fig. 5a) release more K+ (Fig. 5a) and PSS (Fig. 5b) than PSS–SiO2, but also had a prolonged release of K+ (Fig. 5a): >48 hours relative to 1 hour for PSS–SiO2. For PSS–0.7SiO2 microspheres the K+ was initially released rapidly over 1 hour in a similar fashion to PSS–SiO2 (Step 1, Scheme 2). This initial stage of K+ release was coincident with the PSS release, suggesting the anion exchanged (H+ for K+) PSS was the initial source of K+ (Step 1, Scheme 2). However, unlike PSS–SiO2 that showed a continuous plateau up to 48 hours with cumulative K+ release <20%, the PSS–0.7SiO2 initial plateau was somewhere between 12 and 24 hours, during which a second release of K+ began over the timeframe up to and exceeding 48 hours (plateau not reached at 48 hours) with ∼75% of the K+ released, and with very little additional release of PSS. Given for both PSS–0.7SiO2 and PSS–SiO2 nearly all the PSS release was finished with 1 hour (Fig. 5b), the second stage of K+ release must be from the microspheres. Presumably the higher content of SiO2 in PSS–SiO2 and the consequent defect free structure (Fig. 2b and d) prevented K+ (and PSS) release from these microspheres, whilst the more open ‘fractured’ PSS–0.7SiO2 microsphere structure (Fig. 2a and c) allowed the K+ to be released directly from these microspheres on a longer timescale than the first release (Step 2, Scheme 2).
The payload of KCl in the microspheres was calculated using the equation in Experimental section of the ESI† and it reached 10.8 ± 1% and 9.5 ± 1%, and the encapsulation efficiency reached 93 ± 1% and 95 ± 1% for PSS–0.7SiO2 and PSS–SiO2, respectively. The high encapsulation efficiency was attributed to the advantages of the method developed, namely, low solubility of polymer (PSS) in oil, high concentration of polymer in water, low solubility of the active ingredient (KCl) in oil phase and the ion exchange between the polymer (PSS) and ingredient (KCl).5 Low solubility of PSS in the oil and highly concentrated PSS solution prevented the active ingredient from diffusion into the continuous phase, which probably resulted in fast solidification of microparticles. Moreover, low solubility of KCl in the oil phase and the ion exchange, limited the K+ ions release from the microspheres during encapsulation, which was another reason to achieve high encapsulation efficiency.5
In summary, a novel and simple method was developed here to form novel inorganic–organic composite microspheres which encapsulated a water soluble inorganic salt (KCl), with an encapsulation efficiency of 93 ± 1%. Notably, chemical modification of the microparticles enabled a sustained release of K+ exceeding 48 hours, when dispersed in an aqueous phase, which is >8 times greater than what has been achieved previously.25–27 The proposed novel dual-release mechanism offers the opportunity for the prolonged release of other inorganic salts, offering new potential applications in the agrochemical, pharmaceutical, food and household/personal care industrial sectors.
Acknowledgements
C. S. was fully sponsored by College of Engineering & Physical Sciences, the University of Birmingham, UK.Notes and references
- E. M. Shchukina and D. G. Shchukin, Curr. Opin. Colloid Interface Sci., 2012, 17, 281–289 CrossRef CAS.
- X. L. Wang, W. Z. Zhou, J. Cao, W. C. Liu and S. P. Zhu, J Colloid Interf Sci, 2012, 372, 24–31 CrossRef CAS PubMed.
- K. Liu, R. R. Xing, Q. L. Zou, G. H. Ma, H. Mohwald and X. H. Yan, Angew Chem Int Edit, 2016, 55, 3036–3039 CrossRef CAS PubMed.
- J. W. Cui, Y. J. Wang, A. Postma, J. C. Hao, L. Hosta-Rigau and F. Caruso, Adv. Funct. Mater., 2010, 20, 1625–1631 CrossRef CAS.
- N. V. N. Jyothi, P. M. Prasanna, S. N. Sakarkar, K. S. Prabha, P. S. Ramaiah and G. Y. Srawan, J. Microencapsulation, 2010, 27, 187–197 CrossRef CAS PubMed.
- Y. Long, B. Vincent, D. York, Z. B. Zhang and J. A. Preece, Chem. Commun., 2010, 46, 1718–1720 RSC.
- Y. Long, D. York, Z. B. Zhang and J. A. Preece, J. Mater. Chem., 2009, 19, 6882–6887 RSC.
- Y. Y. Yang, T. S. Chung and N. P. Ng, Biomaterials, 2001, 22, 231–241 CrossRef CAS PubMed.
- P. H. R. Keen, N. K. H. Slater and A. F. Routh, Langmuir, 2014, 30, 1939–1948 CrossRef CAS PubMed.
- A. Elabbadi, N. Jeckelmann, O. P. Haefliger and L. Ouali, J. Microencapsulation, 2011, 28, 1–9 CrossRef CAS PubMed.
- C. Sui, Y. Lu, H. L. Gao, L. Dong, Y. Zhao, L. Ouali, D. Benczedi, H. Jerri and S. H. Yu, Cryst. Growth Des., 2013, 13, 3201–3207 CAS.
- D. V. Volodkin, N. I. Larionova and G. B. Sukhorukov, Biomacromolecules, 2004, 5, 1962–1972 CrossRef CAS PubMed.
- J. Xue and Z. B. Zhang, J. Appl. Polym. Sci., 2009, 113, 1619–1625 CrossRef CAS.
- Y. Zhao, Z. Luo, M. H. Li, Q. Y. Qu, X. Ma, S. H. Yu and Y. L. Zhao, Angew Chem Int Edit, 2015, 54, 919–922 CrossRef CAS PubMed.
- H. Zhang, J. B. Fei, X. H. Yan, A. H. Wang and J. B. Li, Adv. Funct. Mater., 2015, 25, 1193–1204 CrossRef CAS.
- A. R. Bassindale, M. Pourny, P. G. Taylor, M. B. Hursthouse and M. E. Light, Angew Chem Int Edit, 2003, 42, 3488–3490 CrossRef CAS PubMed.
- S. Behzadi, C. Rosenauer, M. Kappl, K. Mohr, K. Landfester and D. Crespy, Nanoscale, 2016, 8, 12998–13005 RSC.
- A. Fiore, A. D. Troise, B. A. Mogol, V. Roullier, A. Gourdon, S. E. Jian, B. A. Hamzalioglu, V. Gokmen and V. Fogliano, J. Agric. Food Chem., 2012, 60, 10808–10814 CrossRef CAS PubMed.
- E. Oro, A. de Gracia, A. Castell, M. M. Farid and L. F. Cabeza, Appl. Energy, 2012, 99, 513–533 CrossRef CAS.
- W. M. Jung, S. H. Kang, K. S. Kim, W. S. Kim and C. K. Choi, J. Cryst. Growth, 2010, 312, 3331–3339 CrossRef CAS.
- Y. Zhao, L. N. Lin, Y. Lu, S. F. Chen, L. A. Dong and S. H. Yu, Adv. Mater., 2010, 22, 5255–5259 CrossRef CAS PubMed.
- R. M. Almeida and C. G. Pantano, J. Appl. Phys., 1990, 68, 4225–4232 CrossRef CAS.
- A. Bertoluzza, C. Fagnano, M. A. Morelli, V. Gottardi and M. Guglielmi, J. Non-Cryst. Solids, 1982, 48, 117–128 CrossRef CAS.
- F. L. Galeener, Phys. Rev. B: Condens. Matter Mater. Phys., 1979, 19, 4292–4297 CrossRef CAS.
- W. G. Fan and L. Gao, J Colloid Interf Sci, 2006, 297, 157–160 CrossRef CAS PubMed.
- J. Jang, J. Ha and J. Cho, Adv. Mater., 2007, 19, 1772–1775 CrossRef CAS.
- X. Y. Lu and R. A. Weiss, Macromolecules, 1991, 24, 4381–4385 CrossRef CAS.
- G. Zundel, Hydration and intermolecular interaction; infrared investigations with polyelectrolyte membranes, Academic Press, New York, 1969 Search PubMed.
- M. M. Nasef, H. Saidi and H. M. Nor, J. Appl. Polym. Sci., 2000, 77, 1877–1885 CrossRef CAS.
- T. E. Bunchman, E. G. Wood, M. H. Schenck, K. A. Weaver, B. L. Klein and R. E. Lynch, Pediatr. Nephrol., 1991, 5, 29–32 CrossRef CAS PubMed.
- K. G. Varshney, A. H. Pandith and U. Gupta, Langmuir, 1998, 14, 7353–7358 CrossRef CAS.
- B. Mahltig and H. Bottcher, J. Sol-Gel Sci. Technol., 2003, 27, 43–52 CrossRef CAS.
- R. Tamaki and Y. Chujo, Chem. Mater., 1999, 11, 1719–1726 CrossRef CAS.
- E. Fritz, Microsc. Microanal., 2007, 13, 233–244 CrossRef CAS PubMed.
Footnote |
| † Electronic supplementary information (ESI) available: Experimental section. See DOI: 10.1039/c6ra25488h |
| This journal is © The Royal Society of Chemistry 2017 |


