 Open Access Article
Creative Commons Attribution 3.0 Unported Licence
Silicone elastomers with covalently incorporated aromatic voltage stabilisers†
A. H. A. Razakab and
A. L. Skov*a
aDanish Polymer Centre, Department of Chemical and Biochemical Engineering, Technical University of Denmark, Building 227, 2800 Kgs. Lyngby, Denmark. E-mail: al@kt.dtu.dk
bFaculty of Engineering Technology, University of Tun Hussein Onn Malaysia, 86400 Parit Raja, Batu Pahat, Johor, Malaysia
First published on 3rd January 2017
Abstract
When optimising dielectric elastomers (DEs) a conflict exists, namely that for large achievable actuation strains softness is required, but with increased softness electrical breakdown strength decreases. Herein, soft dielectric silicone elastomers with increased electrical breakdown strength, due to the incorporation of an aromatic voltage stabiliser, were prepared by cross-linking synthesised polydimethylsiloxane–polyphenylmethylsiloxane (PDMS–PPMS) copolymers. PPMS possesses voltage stabilisation capabilities but is immiscible in PDMS, and thus the copolymerisation of the two components was necessary for homogeneity. Concentrations of the voltage stabiliser were varied by changing the molecular weights of the PPMS in the copolymer. The developed elastomers were inherently soft with enhanced electrical breakdown strengths, due to delocalised π-electrons of the aromatic constituent. An optimum concentration was found for the voltage stabilisation effect. The relative permittivities of the PDMS–PPMS elastomers varied from 3.4 to 3.9 and therefore were also improved from pure PDMS elastomers. The elastomers were furthermore non-conductive and possessed low dielectric losses. These properties are evaluated as favourable for soft actuation.
Introduction
Numerous studies on formulating elastomers, with the ultimate goal of achieving better dielectric elastomer (DE) actuation performance, have been performed, mainly by utilising silicone elastomers1 or other elastomers such as acrylics, polyurethanes and natural rubber.2 The actuation performance of a DE at a given voltage (V) can be improved by enhancing the relative permittivity (εr) or by reducing the Young's modulus (Y). These handles are obvious from the actuation equation derived by Pelrine et al.,3 which relates the actuation strain (s) to the mentioned parameters via:
 | (1) |
 | (2) |
However, this strain is not always possible to achieve, since the elastomer may undergo electro-mechanical instability (EMI) which results in premature breakdown.4–7 The EMI effect is most common for elastomers with strain-softening behaviour. In the following this effect is ignored, since all investigated elastomers have strain-hardening behaviour. Thus, the maximum achievable strain will be described by eqn (2). Furthermore, it also requires that the electrodes do not contribute to the elastic modulus, whilst they should also be stretchable to the same extent as the elastomer.8
As solutions to enhanced relative permittivity, several works have been performed on elastomers by adding titanium(IV) oxide (TiO2),9,10 barium titanate (BaTiO3)11 and calcium copper titanate (CaCu3Ti4O12).12 Silicone elastomer composites are usually relatively stiff and lead to significant losses,1 and as alternatives to elastomers with improved permittivity, chemical functionalisation, via the covalent grafting of dipoles such as trifluoropropyl,13 p-nitroaniline14 or azide groups15,16 to the silicone backbone, has been investigated. Recently, a novel method for introducing high-permittivity liquids into silicone elastomers was developed, and these elastomers were shown to possess high dielectric permittivity.17,18
As mentioned previously, another approach to improving actuation performance is reducing the Young's modulus. This can be achieved by either pre-straining externally, using a stiff supporting structure, or pre-straining internally, via an interpenetrating polymer network (IPN)19,20 or by creating bimodal networks with reduced cross-linking density in the elastomer matrix.21,22 The mentioned elastomers with high relative permittivity and a low Young's modulus improve actuation performance at a given voltage, but these optimised elastomers often possess relatively low electrical breakdown strength. For a given elastomer system (i.e. elastomer matrix and filler) the electrical breakdown strength decreases when the Young's modulus is decreased.9
Increasing the electrical breakdown strength of DEs allows for greater actuation, due to the possibility of utilising larger electrical fields without failure.3,23 For DEs, several mechanisms lead to electrical breakdown, namely partial discharge24 and electromechanical25 and electrothermal breakdown.26,27 Multiple studies on pre-strained DE electrical breakdown have been conducted, with the main emphasis on reliability and the effect of electrical breakdown strength on external properties such as effective electrode configurations,28,29 elastomer processing techniques30 and pre-stretching methods.3,23,29 As an alternative approach to enhancing electrical breakdown strength, blending in additives with a voltage-stabilising effect or via polymer structure modifications remains unexplored for dielectric elastomers.
Electron-trapping effects have been investigated previously by including aromatic voltage stabilisers in minute concentrations in polymers, mainly polyethylene (PE), with the purpose of reducing power loss for high-voltage insulation cables.31–33 Aromatic voltage stabilisers, which have delocalised π-electrons, trap energetic electrons and create radicals, as they interrupt the distribution of the π-electron cloud.34 For high-voltage insulation cables, Yamano et al.31 increased the electrical breakdown strength in PE by using aromatic azo-compounds which had six different side groups with electron-acceptors (NO2˙, CN˙) or electron-donors (NH2˙, CH3˙, OH˙). The PE composite containing the azo-compound with (OH)2 and NO2 side groups with a remarkably low concentration of 1 × 10⁻⁵ mol g−1 had the highest electrical breakdown strength, improving by 48% compared to the PE without an additive. This indicates that both electron donating (OH˙) and accepting (NO2˙) groups efficiently increase electrical breakdown strength, due to the increased polarity in the aromatic group and thus lower excitation energies. Yamano32 enhanced further electrical breakdown strength in PE with acene compounds (naphthalene, anthracene, tetracene and pentacene) as aromatic voltage stabilisers.
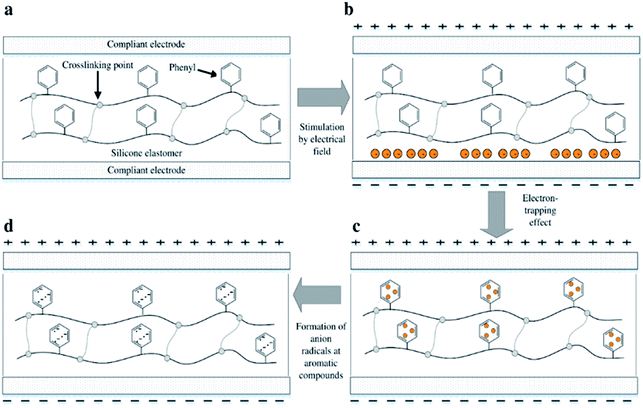
However, utilising aromatic voltage stabilisers of any kind as a silicone additive will unavoidably cause phase separation of the resulting mixture. Preventing this on both the macro and the micro scale during preparation, as well as during actuation, is a key requirement for long DE lifetimes.33 The effect of electron-trapping by phenyl groups, so-called ‘homo-aromatics’, in a silicone elastomer is illustrated in Fig. 1. Electrons in the presence of an electrical field accumulate initially at the interfacial boundary between the film and the electrode, as shown in Fig. 1(b). The electrons then migrate and are trapped in the phenyl group, as seen in Fig. 1(c). When electrons migrate and collide with the homo-aromatic group, they disturb the cloud of pi-electrons in the aromatic group, and this results in the formation of electron-accepting radicals, as shown in Fig. 1(d). The depth of the electron trap is highly influenced by the type of radical,34 where the depth for the aromatic group with the radical of an electron-accepting type is larger than that of the aromatic group without a radical.32,34 The trapped electrons act as negative space charges in the elastomer, causing a decrease in electrical field strength on the cathode.32 This decreased electrical field strength then reduces electron migration from the cathode. The trapped electrons remain in the film bulk and therefore delay electrical breakdown; thus, increased electrical breakdown strength is achieved.
In this work, the voltage stabilisation effect of PPMS in cross-linked PDMS–PPMS copolymers is investigated, while cross-linked materials are characterised mechanically and dielectrically.
Experimental
Materials
Telechelic vinyl-terminated polydimethylsiloxanes (V-PDMS) were DMS-V31, DMS-V25, DMS-V22 and DMS-V21, with a number average molecular weight (Mn) of 28, 17.2, 9.4 and 6 kg mol−1, respectively. Telechelic hydride-terminated polyphenylmethylsiloxanes (H-PPMS) were PMS-H03 (Mn = 0.4 kg mol−1) and PMS-H11 (Mn = 1 kg mol−1). The catalyst was a platinum-divinyl-tetramethyl disiloxane complex [SIP6830.3] containing 3.25% of platinum in xylene. The vinyl-functional cross-linker was methyl-hydrosiloxane-dimethylsiloxane copolymer [VDT-431] (Mn = 28 kg mol−1, 15-functional). All polymers, cross-linkers and catalysts were purchased from Gelest Inc. Fumed silica (SIS6962.0) was purchased from Fluorochem.Synthesis of PDMS–PPMS block copolymers
PDMS–PPMS block copolymers were prepared from the hydrosilylation of hydride-terminated PPMS and vinyl-terminated PDMS at room temperature in the presence of a platinum (Pt) catalyst, as shown in Scheme 1. The synthesised block copolymer has X + 1 blocks of phenylmethylsiloxane and X blocks of dimethylsiloxane.The procedure to synthesise PDMS–PPMS block copolymers was taken from A. Razak et al.35 The required amount of hydride-terminated PPMS was added based on a targeted molecular weight (Mn,T) of 30 kg mol−1 of the copolymer (refer to ESI 1, eqn (1)†). The mixture containing V-PDMS, H-PPMS and 30 ppm of the Pt catalyst was speed-mixed at 3000 rpm for 5 min. The stoichiometric ratio was calculated based on the number of PDMS–PPMS repeating units, X (see ESI 1, eqn (2)†).
Cross-linking and sample preparation
All PDMS–PPMS block copolymer samples were cross-linked with the vinyl-functional 15-functional cross-linker. The stoichiometric ratio for cross-linking (r2) was 1.5, with an excess of cross-linker (see ESI 2, eqn (3)†). Blends containing copolymer, cross-linker, 30 ppm of Pt catalyst and 25 parts per hundred rubber (phr) of silica were speed-mixed at 2500 rpm for 4 minutes.The final mixtures were casted on Teflon plates for easy release. The cross-linked copolymer films were prepared in thicknesses of approximately 1 mm (thick film) and 100 ± 20 μm (thin film). Thick films were used to measure linear viscoelasticity (LVE), the stress–strain relationship and dielectric properties. All films were placed in a vacuum oven at 23 °C for 4 to 8 hours, due to trapped air during fabrication, and were thereafter cured at 40 °C for 12 hours to ensure proper film formation. The curing process was continued at 150 °C for 8 to 12 hours. Subsequently, all films were post-cured at 200 °C for 2 hours to remove all volatiles.36,37
The cross-linked PDMS–PPMS copolymer is referred as a PDMS–PPMS elastomer. Samples were named based on repeating numbers of PDMS and PPMS as nDMS_mPMS. The realised molar concentrations of the phenyl group (CC6H5) were calculated from the ratio of the mole number of the phenyl group to the total mass of PDMS and PPMS. The mole number of the phenyl group was determined based on integration areas and H's numbers of CH3–Si–C5H5 and Si–(CH3)2 in 1H-NMR (refer to ESI 3, eqn (4–7)†). Details of the PDMS–PPMS copolymers are presented in Table 1.
| Vinyl-functional PDMS | Hydride-functional PPMS | PDMS–PPMS copolymer (nDMS_mPMS) | Realised concentration of phenyl groups [10−4 mol g−1] |
|---|---|---|---|
| DMS-V31 | PMS-H03 | 377DMS_2PMS | 5.0 |
| DMS-V25 | 231DMS_2PMS | 6.9 | |
| DMS-V22 | 126DMS_2PMS | 7.8 | |
| DMS-V21 | 80DMS_2PMS | 8.4 | |
| DMS-V31 | PMS-H11 | 377DMS_6PMS | 8.7 |
| DMS-V25 | 231DMS_6PMS | 9.8 | |
| DMS-V22 | 126DMS_6PMS | 15 | |
| DMS-V21 | 80DMS_6PMS | 20 |
Instrumentation
![[thin space (1/6-em)]](https://www.rsc.org/images/entities/char_2009.gif) exp[(dεH/dt)t], and so the final Hencky strain (εH) can thus be expressed as follows: εH = ln[Lf/Lo]. Here, engineering stress and strain were used for the stress–strain relationship. Engineering strain was calculated from the measured Hencky strains, and engineering stress was calculated from the measured torque over a cross-sectional area of the sample (refer to eqn (8–12)† in ESI 4 for engineering stress and strain, respectively).
exp[(dεH/dt)t], and so the final Hencky strain (εH) can thus be expressed as follows: εH = ln[Lf/Lo]. Here, engineering stress and strain were used for the stress–strain relationship. Engineering strain was calculated from the measured Hencky strains, and engineering stress was calculated from the measured torque over a cross-sectional area of the sample (refer to eqn (8–12)† in ESI 4 for engineering stress and strain, respectively).Results and discussion
The targeted elastomers with covalently grafted voltage stabilisers are shown in Fig. 2. In order to realise these elastomers, copolymers were first synthesised and characterised before being cross-linked into elastomers.Synthesised PDMS–PPMS copolymers
Determined molecular weights of synthesised PDMS–PPMS copolymers are shown in Table 2. All copolymers have low polydispersity indexes (PDI ≤ 2.1). The disappearance of the Si–CH2![[double bond, length as m-dash]](https://www.rsc.org/images/entities/char_e001.gif) CH2 bond signal at 5.8–6.2 ppm was confirmed by 1H-NMR, to ensure that all vinyl groups in the PDMS had been consumed fully during the hydrosilylation of vinyl-terminated PDMS and hydride-terminated PPMS; refer to ESI 5 for NMR spectra in Fig. S2–9.† 1H-NMR spectra confirmed that the synthesised PDMS–PPMS copolymers were hydride functional, and all vinyl groups in the PDMS were fully reacted.
CH2 bond signal at 5.8–6.2 ppm was confirmed by 1H-NMR, to ensure that all vinyl groups in the PDMS had been consumed fully during the hydrosilylation of vinyl-terminated PDMS and hydride-terminated PPMS; refer to ESI 5 for NMR spectra in Fig. S2–9.† 1H-NMR spectra confirmed that the synthesised PDMS–PPMS copolymers were hydride functional, and all vinyl groups in the PDMS were fully reacted.
| Cross-linked PDMS–PPMS copolymer | Actual Mn,T (kg mol−1) | Polydispersity index, PDI (Mw/Mn) |
|---|---|---|
| 377DMS_2PMS | 32 | 2.1 |
| 231DMS_2PMS | 36 | 1.9 |
| 126DMS_2PMS | 73 | 1.5 |
| 80DMS_2PMS | 39 | 1.8 |
| 377DMS_6PMS | 42 | 1.7 |
| 231DMS_6PMS | 37 | 1.8 |
| 126DMS_6PMS | 82 | 1.6 |
| 80DMS_6PMS | 32 | 2.0 |
Linear viscoelasticity
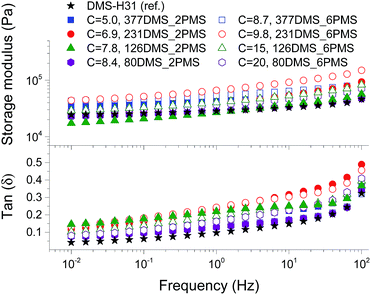
To evaluate the effect of the increased concentration of the phenyl group on viscoelastic properties, the prepared elastomers were characterised rheologically, as shown in Fig. 3. This is an important investigation to perform for these systems, since aromatics are well-known to inhibit utilised silylation chemistry. The PDMS–PPMS elastomers show to be well cross-linked and behave elastically, i.e. the inhibiting nature of the phenyl groups did not affect the final properties of the elastomers. The resulting storage moduli (G′) for all elastomers and the reference are between 104 and 105 Pa, and they all behave in a similar manner with close-to-identical relaxations. From these results it is obvious that the elastomers maintain network integrity. Relative losses [tan(δ)] are comparable to these of commercial silicone elastomers such as Elastosil RT625 from Wacker Chemie.38Stress–strain relationship
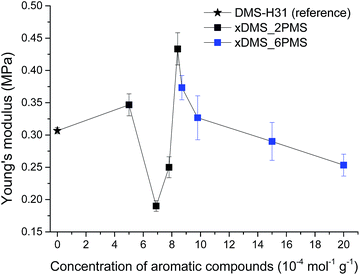
Stress–strain curves and Young's moduli of the cross-linked copolymers are shown in Fig. 4 and 5, respectively. All cross-linked copolymers show increased strain at breaking, compared to the reference (DMS-H31), due to an evident ‘plasticising’ effect (see Fig. 4). All elastomers are still strain-hardening despite being plasticised. The resulting Young's moduli at 5% strains of the cross-linked copolymers are shown in Fig. 5, and the soft nature of all the elastomers is obvious. Common Young's moduli of silicone elastomers are around 1 MPa.38 Another finding is that the cross-linked copolymer 80DMS_2PMS is slightly stronger than the reference elastomer (DMS-H31), not only with respect to the initial Young's modulus, but also with respect to ultimate strength.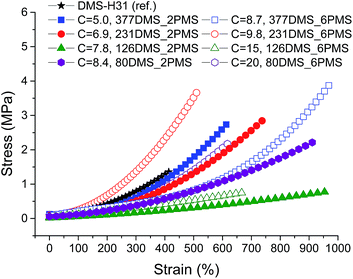 | ||
| Fig. 4 Stress–strain curves for PDMS–PPMS elastomers with different phenyl group concentrations at 23 °C (typical standard deviations in tensile measurements were of the order ±5%). | ||
With respect to actuation, elastomers C = 7.8 and 15 × 10−4 mol g−1 show the most softness. On the other hand, both elastomers do not possess any significant strain-hardening behaviour. The slightly stronger elastomers C = 8.4 and 8.7 × 10⁻⁴ mol g−1 show ideal properties for actuation with good, ultimately strain-hardening, behaviour.
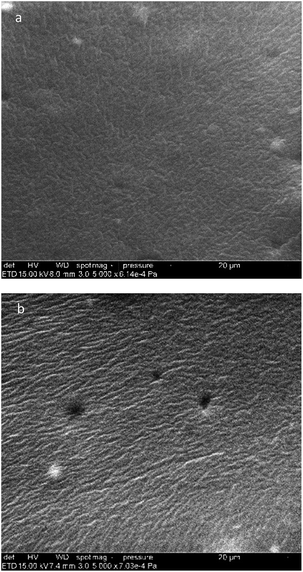
Obviously, from the mechanical data, there is no clear trend in mechanical behaviours except that a concentration of around 8.5 × 10⁻⁴ mol g−1 seems to be the most favourable. This is most likely due to local phase separation, which serves both to stabilise and to plasticise the elastomer, i.e. some regions will be rich in PPMS (rigid zones) and other regions poor (plasticised zones). This can be seen to some extent from SEM imaging of the resulting films with two examples shown in Fig. 6. As investigated by Luo et al.,39 PDMS shows a distinct triangular pattern whereas PMMS shows a pattern with bent rectangles. This is illustrated below by the elastomers 377DMS_2PMS and 80DMS_2PMS, wherein sample 377DMS_2PMS shows a distinct PDMS structure while elastomer 80DMS_2PMS has areas with both signatures. SEM pictures of all elastomers can be seen in ESI 6, Fig. S10.†
Dielectric properties
The conductivity and dielectric properties of the cross-linked PDMS–PPMS copolymers and the reference elastomer are shown in Fig. 7 and 8, respectively. The resulting conductivities indicate that none of the cross-linked copolymers is conductive, as illustrated in Fig. 7. Low conductivity is a key element in the actuation performance of the DE. The relative permittivity of prepared elastomers with short-chain PPMS initially increases and reaches a maximum phenyl group concentration of 6.9 × 10⁻⁴ mol g−1, albeit it decreases thereafter. On the other hand, the relative permittivity of cross-linked copolymers with long-chain PPMS decreases in line with an increase in phenyl concentration. The flat curves furthermore indicate that phase separation is not macroscopic but rather limited to the lower microscale or nanoscale. These observations again indicate that micro- or nanoscale phase separation takes place and that the morphology of the elastomers depends strongly on the concentration of phenyl groups. Dielectric losses, which are represented by tan(δ), are relatively low for all cross-linked copolymers, as shown in Fig. 8. The reference elastomer (DMS-H31) shows low tan(δ) as well.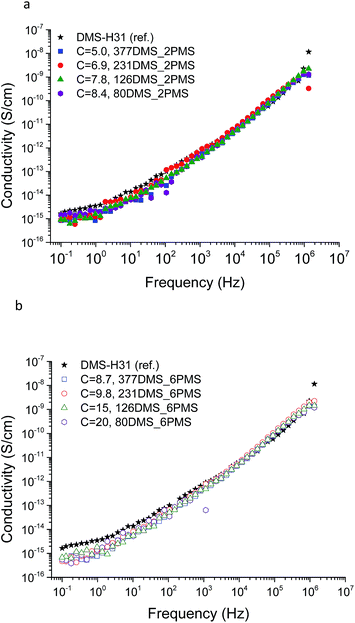 | ||
| Fig. 7 The conductivity of PDMS–PPMS elastomers with different phenyl concentrations of at 23 °C: (a) short-chain and (b) long-chain PPMS; C is in 10−4 mol g−1. | ||
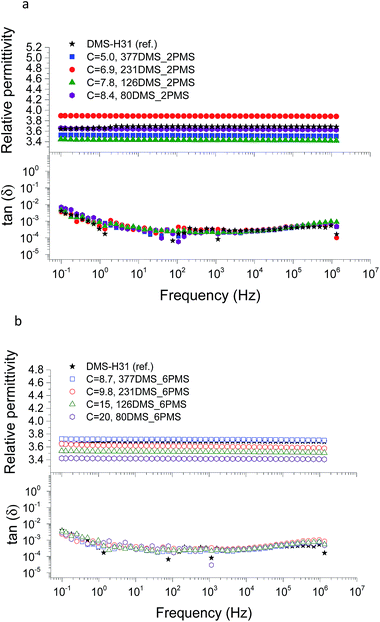 | ||
| Fig. 8 The dielectric properties of PDMS–PPMS elastomers with different phenyl concentrations at 23 °C: (a) short-chain and (b) long-chain PPMS; C is in 10−4 mol g−1. | ||
Electrical breakdown and Weibull analysis
The influence of the concentration of the phenyl group in cross-linked PDMS–PPMS copolymer on electrical breakdown strength was investigated. The resulting electrical breakdown strength of the cross-linked copolymers with different phenyl group concentrations is shown in Fig. 9, namely an optimum electrical breakdown strength (72 ± 3 V μm−1) occurring at a phenyl concentration of 8.4 × 10⁻⁴ mol g−1. In other words, electrical breakdown strength has increased 36% compared to the reference elastomer. The optimum is most likely due to the combination of favourable phase separation and a relatively high concentration of phenyl groups. Stiffness may also affect electrical breakdown strength strongly,9 i.e. the electrical breakdown strength of the reference elastomer is low due to the inherently soft nature of silicone elastomers cross-linked from high molecular weight PDMS polymers,40 and there is a broad amount of variation in the Young's moduli of the prepared elastomers. To evaluate whether the voltage stabilisation effect is rather an effect of increased stiffness, the influence of Y on electrical breakdown strength was investigated. There is no correlation, as seen from ESI 7 in Fig. S11,† which means that the effect is due to the voltage stabilisation effect.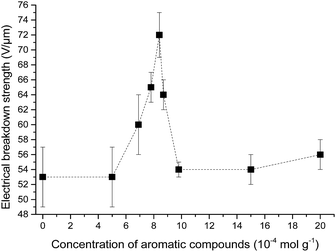 | ||
| Fig. 9 Electrical breakdown strength of PDMS elastomer and PDMS–PPMS copolymers with different phenyl group concentrations. | ||
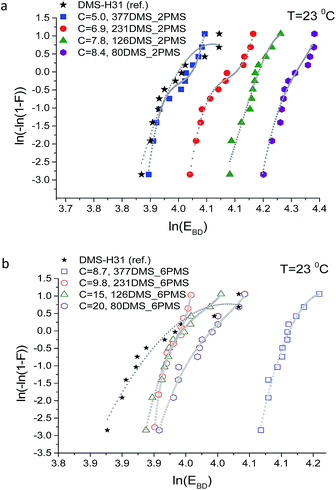
Weibull analysis was used to obtain a further understanding of the electrical reliability of the prepared elastomers. The Weibull probability distribution of failure for all films is shown in Fig. 10. The η-parameter, which is the Weibull scale parameter, was determined from the Weibull plot as the value at which failure probability, ln[−ln(1 − F)], was 63.2%.35 The β-parameter is the Weibull shape parameter, representing the broadness of distribution. The η-parameter is closely correlated to the mean breakdown voltage.41 A small value of the Weibull shape parameter indicates that electrical breakdown occurrences are broadly dispersed.41
Due to different prepared PDMS–PPMS elastomer film thicknesses, the determined electrical breakdown strengths were normalised based on a reference thickness for better comparison. Normalised dielectric breakdown strength can be determined by:28
 | (3) |
The results for the normalised electrical breakdown strength (En), Weibull η- and β-parameters and R2 of the linear fits for cross-linked copolymers, including the reference, are summarised in Table 3. Cross-linked PDMS–PPMS copolymers with long-chain PPMS possess lower electrical breakdown strength standard deviation than the copolymers with short-chain PPMS, as illustrated in Table 3. The coefficient of determination (R2) of all investigated elastomers is above 0.85, indicating that the measured electrical breakdown strengths correlate well with the fitted regression lines.
| Cross-linked PDMS–PPMS copolymer | Thickness (μm) | Electrical breakdown strength (V μm−1) | Weibull β-parameter | Weibull η-parameter | R2 | Normalised electrical breakdown (V μm−1) |
|---|---|---|---|---|---|---|
| DMS-H31 (ref.) | 105 | 53 ± 4 | 17 | 55 | 0.85 | 52.9 ± 3.6 |
| 377DMS_2PMS | 81 | 53 ± 4 | 17 | 55 | 0.85 | 53.7 ± 3.7 |
| 231DMS_2PMS | 91 | 60 ± 4 | 20 | 61 | 0.91 | 60.1 ± 3.4 |
| 126DMS_2PMS | 80 | 65 ± 2 | 32 | 66 | 0.94 | 65.5 ± 2.5 |
| 80DMS_2PMS | 90 | 72 ± 3 | 26 | 73 | 0.92 | 71.9 ± 3.1 |
| 377DMS_6PMS | 81 | 64 ± 2 | 47 | 65 | 0.89 | 64.1 ± 1.6 |
| 231DMS_6PMS | 95 | 54 ± 1 | 60 | 54 | 0.94 | 54.0 ± 1.6 |
| 126DMS_6PMS | 95 | 54 ± 2 | 39 | 55 | 0.88 | 54.0 ± 1.8 |
| 80DMS_6PMS | 95 | 56 ± 2 | 28 | 57 | 0.94 | 56.1 ± 2.2 |
The Weibull plots for all samples are shown in Fig. 10. The plotted data in the Weibull probability distribution of failure of elastomers with short-chain PPMS clearly show two domains (refer to Fig. 10(a)). This is an indication of the inhomogeneity of the phenyl group in the PDMS–PPMS matrix containing short-chain PPMS. On the other hand, the Weibull distribution data for the elastomers with long-chain PPMS show one domain with only a small discrepancy at high voltages, thereby indicating better homogeneity of the phenyl group in the PDMS–PPMS matrix.
Weibull parameters η and β at different phenyl group concentrations are compared and summarised in Fig. 11. One important finding from the values of the Weibull β-parameter is that the PDMS–PPMS elastomers with long-chain PPMS have larger β-parameter values compared to the elastomers with short-chain PPMS except at very high phenyl group loadings, where β drops. For both types of cross-linked copolymers an optimum η parameter value of around 8 × 10⁻⁴ is found. Furthermore no links between the Weibull parameters and the Young's moduli of the elastomers could be identified, as shown in ESI 8, Fig. S12.†
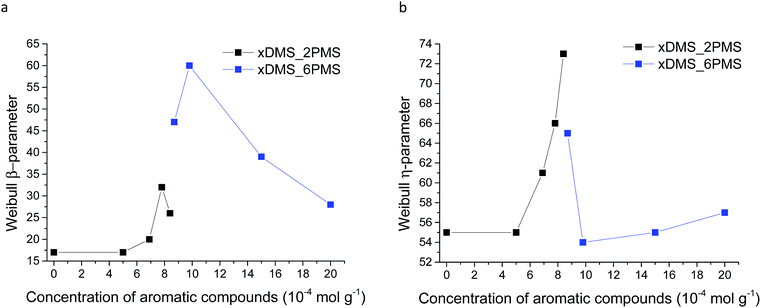 | ||
| Fig. 11 Weibull parameters for prepared PDMS–PPMS copolymer and reference (DMS-H31) samples: (a) β-parameter and (b) η-parameter. | ||
Conclusion
Inherently soft elastomers based on cross-linked PDMS–PPMS copolymers were synthesised successfully and proven to possess increased electrical breakdown strength, due to voltage stabilisation arising from aromatic groups of PPMS. Cross-linked copolymers with varying concentrations of aromatic groups were prepared from copolymers synthesised by varying the chain length of PDMS while maintaining the chain length of PPMS. The cross-linked copolymers possessed higher electrical breakdown strength than the pure PDMS-based reference elastomer, due to π-electrons of the aromatic group being capable of trapping charges. Aside from having high electrical breakdown strength, the cross-linked copolymers showed an increased storage modulus and low viscous loss, hence maintaining the network integrity of the dielectric elastomer. All cross-linked copolymers demonstrated strain-hardening behaviours. From the electrical breakdown strength, optimal phenyl group concentration was determined at approximately 8.4 × 10⁻⁴ mol g−1. As a result of these properties, voltage-stabilised elastomers were synthesised. Further studies will hopefully uncover better voltage stabilisers, which would subsequently be a giant step toward producing reliable dielectric elastomer-based products.Acknowledgements
The Malaysian Ministry of Education (MoE), Universiti Tun Hussein Onn Malaysia (UTHM) and Innovationsfonden Danmark are gratefully acknowledged for their funding.Notes and references
- F. B. Madsen, A. E. Daugaard, S. Hvilsted and A. L. Skov, Macromol. Rapid Commun., 2016, 37, 378–413 CrossRef CAS PubMed.
- P. Brochu and Q. Pei, Macromol. Rapid Commun., 2010, 31, 10–36 CrossRef CAS PubMed.
- R. Pelrine, R. Kornbluh, Q. Pei and J. Joseph, Science, 2000, 287, 836–839 CrossRef CAS PubMed.
- Z. Suo, Acta Mech. Solida Sin., 2010, 23, 549–577 CrossRef.
- X. Zhao, W. Hong and Z. Suo, Phys. Rev. B: Condens. Matter Mater. Phys., 2007, 76, 134113 CrossRef.
- Y. Liu, L. Liu, K. Yu, S. Sun and J. Leng, Smart Mater. Struct., 2009, 18, 95040 CrossRef.
- L. Liu, Y. Liu, J. Leng and K. Lau, Smart Mater. Struct., 2011, 20, 115015 CrossRef.
- S. Rosset and H. R. Shea, Appl. Phys. A: Mater. Sci. Process., 2013, 110, 281–307 CrossRef CAS.
- L. Yu and A. L. Skov, Int. J. Smart Nano Mater., 2015, 6, 268–289 CrossRef CAS.
- S. Vudayagiri, S. Zakaria, L. Yu, S. S. Hassouneh, M. Benslimane and A. L. Skov, Smart Mater. Struct., 2014, 23, 105017 CrossRef.
- Z. Zhang, L. Liu, J. Fan, K. Yu, Y. Liu, L. Shi and J. Leng, Proc. SPIE, 2008, 6926, 692610 CrossRef.
- L. J. Romasanta, P. Leret, L. Casaban, M. Hernández, M. A. de la Rubia, J. F. Fernández, J. M. Kenny, M. A. Lopez-Manchado and R. Verdejo, J. Mater. Chem., 2012, 22, 24705–24712 RSC.
- H. Böse, D. Uhl and R. Rabindranath, Proc. SPIE, 2012, 8340, 83402E CrossRef.
- B. Kussmaul, S. Risse, G. Kofod, R. Waché, M. Wegener, D. N. McCarthy, H. Krüger and R. Gerhard, Adv. Funct. Mater., 2011, 21, 4589–4594 CrossRef CAS.
- F. B. Madsen, A. E. Daugaard, S. Hvilsted, M. Y. Benslimane and A. L. Skov, Smart Mater. Struct., 2013, 22, 1–11 CrossRef.
- F. B. Madsen, I. Javakhishvili, R. E. Jensen, A. E. Daugaard, S. Hvilsted and A. L. Skov, Polym. Chem., 2014, 5, 7054–7061 RSC.
- P. Mazurek, S. Hvilsted and A. L. Skov, Polymer, 2016, 87, 1–7 CrossRef CAS.
- P. Mazurek, L. Yu, R. Gerhard, W. Wirges and A. L. Skov, J. Appl. Polym. Sci., 2016, 133, 44153 CrossRef.
- S. M. Ha, W. Yuan, Q. Pei, R. Pelrine and S. Stanford, Adv. Mater., 2006, 18, 887–891 CrossRef CAS.
- P. Brochu, H. Stoyanov, X. Niu and Q. Pei, Smart Mater. Struct., 2013, 22, 55022 CrossRef.
- F. B. Madsen, A. E. Daugaard, C. Fleury, S. Hvilsted and A. L. Skov, RSC Adv., 2014, 4, 6939–6945 RSC.
- C. Tugui, G. Stiubianu, M. Iacob, C. Ursu, A. Bele, S. Vlad and M. Cazacu, J. Mater. Chem. C, 2015, 3, 8963–8969 RSC.
- S. Zakaria, L. Yu, G. Kofod and A. L. Skov, Mater. Today Commun., 2015, 4, 204–213 CrossRef CAS.
- P. H. F. Morshuis and J. J. Smit, IEEE Trans. Dielectr. Electr. Insul., 2005, 12, 328–340 CrossRef.
- K. H. Stark and C. G. Garton, Nature, 1955, 176, 1225–1226 CrossRef.
- S. Zakaria, P. H. F. Morshuis, M. Y. Benslimane, K. V. Gernaey and A. L. Skov, Proc. SPIE, 2014, 9056, 90562V Search PubMed.
- R. Kochetov, A. V. Korobko, T. Andritsch, P. H. F. Morshuis, S. J. Picken and J. J. Smit, J. Phys. D: Appl. Phys., 2011, 44, 395401 CrossRef.
- S. Zakaria, P. H. F. Morshuis, M. Y. Benslimane, L. Yu and A. L. Skov, Smart Mater. Struct., 2015, 24, 55009 CrossRef.
- A. Trols, A. Kogler, R. Baumgartner, R. Kaltseis, C. Keplinger, R. Schwodiauer, I. Graz and S. Bauer, Smart Mater. Struct., 2013, 22, 104012 CrossRef.
- M. Kollosche, M. Melzer, A. Becker, H. Stoyanov, D. N. McCarthy, H. Ragusch and G. Kofod, Proc. SPIE, 2009, 7287, 728729 CrossRef.
- Y. Yamano and H. Endoh, IEEE Trans. Dielectr. Electr. Insul., 1998, 5, 270–275 CrossRef CAS.
- Y. Yamano, IEEE Trans. Dielectr. Electr. Insul., 2006, 13, 773–781 CrossRef CAS.
- V. Englund, R. Huuva, S. M. Gubanski and T. Hjertberg, Polym. Degrad. Stab., 2009, 94, 823–833 CrossRef CAS.
- J. McMurry, Organic Chemistry, Brooks/Cole, California, 8th edn, 2011 Search PubMed.
- A. H. A. Razak, P. Szabo and A. L. Skov, RSC Adv., 2015, 5, 53054–53062 RSC.
- M. A. Brook, H. U. Saier, J. Schnabel, K. Town and M. Maloney, Ind. Eng. Chem. Res., 2007, 46, 8796–8805 CrossRef CAS.
- S. Zakaria, F. B. Madsen and A. L. Skov, Polym.-Plast. Technol. Eng., 2016 DOI:10.1080/03602559.2016.1211689.
- A. L. Skov, A. G. Bejenariu, J. Bøgelund and M. Y. Benslimane, Proc. SPIE, 2012, 8340, 83400M CrossRef.
- Y. Luo, S. Tan, H. Wang, F. Wu, X. Liu, L. Li and Z. Zhang, Chem. Eng. J., 2008, 137, 496–502 CrossRef CAS.
- A. L. Larsen, K. Hansen, P. Sommer-Larsen, O. Hassager, A. Bach, S. Ndoni and M. Jørgensen, Macromolecules, 2003, 36, 10063–10070 CrossRef CAS.
- S. K. Nandi, X. Liu, D. K. Venkatachalam and R. G. Elliman, Phys. Rev. Appl., 2015, 4, 64010 CrossRef.
Footnote |
| † Electronic supplementary information (ESI) available: Number of PDMS–PPMS repeating units, stoichiometric ratios of synthesised copolymer and cross-linking, theoretical and realised molar concentrations of phenyl groups, 1H-NMR spectra of copolymers, SEM images, electrical breakdown strength and Weibull parameters as function of Young's moduli, and UV/Vis spectra. See DOI: 10.1039/c6ra25878f |
| This journal is © The Royal Society of Chemistry 2017 |

