 Open Access Article
Creative Commons Attribution 3.0 Unported Licence
Effect of storage environment on hydrogen generation by the reaction of Al with water†
Yin-Qiang Wanga,
Wei-Zhuo Gaib,
Xia-Yu Zhangc,
Hong-Yi Panc,
Zhenxiang Chengd,
Pingguang Xue and
Zhen-Yan Deng*a
aEnergy Materials & Physics Group, Department of Physics, Shanghai University, Shanghai 200444, China. E-mail: zydeng@shu.edu.cn; Fax: +86-21-66134208; Tel: +86-21-66134334
bSchool of Physics & Electronic Information, Luoyang Normal University, Luoyang 471934, China
cQianweichang College, Shanghai University, Shanghai 200444, China
dInstitute for Superconducting and Electronic Materials, University of Wollongong, North Wollongong, Wollongong, NSW 2500, Australia
eJapan Atomic Energy Agency, Tokai, Ibaraki 319-1195, Japan
First published on 12th January 2017
Abstract
Al powder was stored in saturated water vapor, oxygen, nitrogen and drying air separately for a time period of up to ∼six months, the degradation behavior of Al activity was characterized by the reaction of Al with water. It was found that water vapor decreased the induction time for the beginning of Al–water reaction and reduced the total hydrogen generation per unit weight of Al, while oxygen increased the induction time and retarded the Al–water reaction. In contrast, the effect of nitrogen and drying air on Al activity was weak. The mechanism analyses indicated that water vapor promoted the hydration of the Al surface passive oxide film and sped up the reaction of Al with water, while oxygen thickened the passive oxide film of the Al surface and prolonged its hydration process. These results imply that water vapor rather than oxygen is responsible for the degradation of Al activity during storage in the atmospheric environment.
Introduction
Al is the most abundant metal in the earth's crust (∼8.1%) and is widely used as a building material, in aircraft, industrial and civil products, paint, underwater propellant and high explosive, etc.1–5 In the past few years, Al metal as a hydrogen-generation material has attracted considerable attention due to its relatively low cost and high productivity of H2 in that one kg of Al reacts with water to generate as much as 0.11 kg H2.6,7 Usually, there is a compact and strongly adhesive passive film on an Al surface upon exposure to atmosphere, inhibiting the direct reaction of Al with water.In order to make Al react with water, different methods, based on the disruption of passive oxide film on Al particles, have been developed, e.g. using an alkaline solution to assist the Al–water reaction,8–16 alloying Al with Ga, In, Bi, Sn, Ca, Fe, etc.,17–31 mechanically milling Al metal with special oxide, soluble inorganic salt and carbon material,32–47 and Al surface modification,48–54 etc. All these approaches have made Al metal a promising hydrogen-generation material for portable fuel cell.
Usually Al powder and the activated Al are subjected to atmospheric environment before they are used. It was found that there is an activity degradation when the activated Al was stored in air with a definite humidity for a time period,17,20–22,27,41,44 but the mechanism responsible for degradation is not clear so far. As the main composition of air is nitrogen, oxygen and water vapor, it is highly meaningful to clarify their roles in affecting Al activity, which is instructive for the selection of the suitable gas environment to store and protect Al from degradation. In this work, Al powder and the activated Al were stored in saturated water vapor, oxygen, nitrogen and drying air separately for a long time period. Then the Al activity was characterized by the reaction of Al with water. Finally the main mechanism leading to the Al activity degradation was analyzed.
Experimental procedure
Two kinds of Al powders with the average sizes of 1.32 μm (high purity; Henan Yuanyang Aluminum Co., Henan, China) and 7.29 μm (99.9% purity; High Purity Chemical Co., Tokyo, Japan), and γ-Al2O3 powder (99.99% purity, surface area ∼ 190 m2 g−1; Taimei Chemical Co., Nagano, Japan) were used in the present study. Before the storage experiment, as-purchased 1.32 μm Al powder was heat-treated under vacuum (<10−4 bar) at a heating rate of 1 °C min−1 and held at 300 °C for 1 h, in order to keep all Al particles with the same surface state. This heat-treated Al powder is referred to as HTA hereafter. At the same time, one kind of activated Al powder was prepared as follows. 7.29 μm Al and γ-Al2O3 powders with a total weight of 15 g were put into a beaker with 150 ml of absolute ethanol, and then ultrasonically dispersed in an ultrasonic bath (40 kHz, 100 W) for 1 h. The mixture suspension was dried and sieved using a 100-mesh nylon sieve, and then pressed under a unidirectional pressure of 60 MPa to form the green compacts. The compacts were heat-treated under vacuum (<10−4 bar) at a heating rate of 1 °C min−1 and held at 300 °C for 1 h. The heat-treated compacts were crushed into powder and sieved using a 100-mesh nylon sieve, and finally became γ-Al2O3 modified Al powder (GMAP).54 This GMAP has a composition of 70 vol% Al + 30 vol% γ-Al2O3.The experiment for Al storage in water vapor was performed in a closed glass system with two connected bottles: one is with water and another is for Al storage. When the system is evacuated and then closed, liquid water will evaporate until the vapor pressure reaches saturation, and finally HTA and GMAP are stored in the bottle with saturated water vapor. The experiment for Al storage in oxygen or nitrogen was performed in a cylindrical vessel made of stainless steel. The vessel has an entrance and an exit, the exit is for evacuation and the entrance is for filling oxygen or nitrogen. Both the oxygen and nitrogen pressures for Al storage are 2 bars. All the processes of taking the samples from the vessel were done in a large argon-filled glove box, in order to protect HTA and GMAP from contact with air. The experiment for Al storage in drying air was performed in a drying cabinet with a constant humidity of ∼25%. All the storage experiments were done at room temperature. The vessels' structures and detailed storage procedure for HTA and GMAP are given in the ESI.†
The hydrogen-generation experiment of HTA or GMAP with water was carried out in a closed glass reactor (Fig. 1 of ref. 55). All the hydrogen-generation tests were conducted at a temperature of 35 °C, which was controlled by a thermostat water bath with an accuracy of ±1 °C. 1.0 g of HTA or GMAP was used in each test, which was suspended in 250 ml of deionized water. A magnetic agitation bar with a speed of ∼500 rpm was used to stir the mixture of water and HTA or GMAP. At the beginning, the reactor was filled by the ambient air and the initial gas pressure was 1 bar. As the Al–water reaction produces only one kind of gas, i.e. H2,49 the reaction evolution of Al with water could be determined by the gas pressure in the reactor using the ideal-gas equation
 | (1) |
Results and discussion
Fig. 1 shows the morphologies of as-received HTA and those after storage in different gas environments for a time period. It can be seen that as-received heat-treated Al particles are smooth and there are some very fine white particles covering on their surfaces (Fig. 1(a)). These fine particles are believed to be γ-Al2O3 grains and their agglomerates, because Al surface passive film has complicated phase constituents, including metastable Al2O3, boehmite and bayerite, etc., which begin to transform into γ-Al2O3 phase at a temperature of ∼180 °C. At the heat-treatment temperature of 300 °C, all the constituents in Al surface passive film are transformed into γ-Al2O3 phase, while a new surface dense passive film is formed after the heat-treated Al particles are re-exposed to air.54 This guarantees that all the as-received HTA particles have the same surface state. After storage of HTA in different gas environment for 3–6 months, it can be seen that the morphology of HTA particles in oxygen, nitrogen and drying air has no observable change (Fig. 1(c)–(e)), while there are many piece-like layered structures covering on Al particles after HTA was stored in water vapor for ∼5 months (Fig. 1(b)).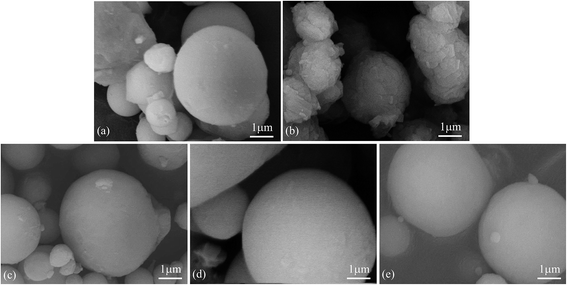 | ||
| Fig. 1 SEM micrographs of as-received HTA (a), that in (a) stored in water vapor for 158 days (b), in oxygen for 103 days (c), in nitrogen for 103 days (d) and in air for 189 days (e). | ||
Fig. 2 shows the morphologies of as-received GMAP and those after storage in different gas environment for a time period. It can be seen that as-received GMAP particle surfaces are almost completely covered by fine γ-Al2O3 grains (Fig. 2(a)), the same as previous work.54 After storage of GMAP in different gas environment for 1.5–5 months, it can be seen that the morphology of GMAP particles in oxygen, nitrogen and drying air has no observable change (Fig. 2(c)–(e)), while GMAP particle surfaces become a little bit dense and piece-like after it was stored in water vapor for ∼5 months (Fig. 2(b)), similar to the results in Fig. 1.
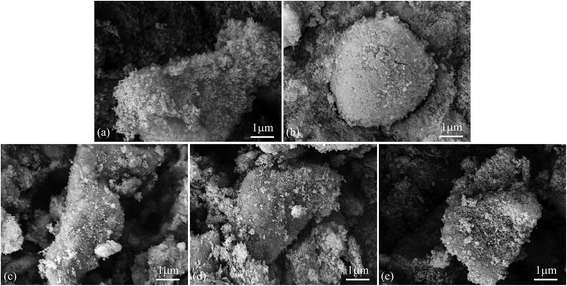 | ||
| Fig. 2 SEM micrographs of as-received GMAP (a), that in (a) stored in water vapor for 152 days (b), in oxygen for 127 days (c), in nitrogen for 50 days (d) and in air for 94 days (e). | ||
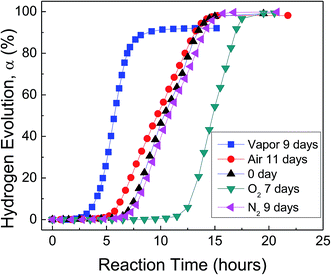
Fig. 3 shows H2 evolution from deionized water at a thermostat temperature of 35 °C using as-received HTA and those stored in water vapor, oxygen, nitrogen and air for a similar time, respectively. It can be seen that water vapor reduces the induction time for the beginning of Al–water reaction, while oxygen increases the induction time. The effect of nitrogen and drying air on Al activity is weak.
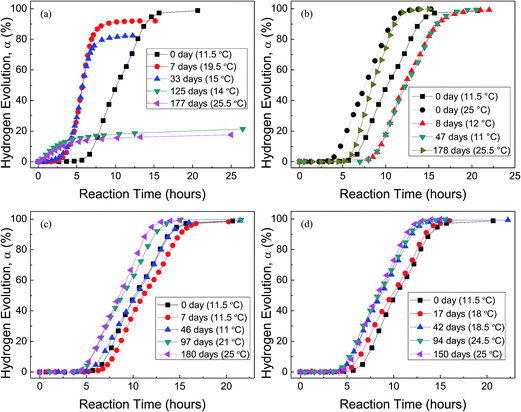
Fig. 4 shows the H2 evolution from deionized water at a thermostat temperature of 35 °C using HTA and those stored in water vapor, oxygen, nitrogen and drying air for different time, respectively, where the data in the parentheses are the environment temperatures during Al–water reaction tests. It can be seen that when HTA is stored in water vapor, the induction time for the beginning of Al–water reaction decreases and the total hydrogen generation per unit weight of Al is reduced. With the increase in storage time, the above tendency is more obvious. When the storage time in water vapor is ∼6 months, there is almost no induction time and the total hydrogen generation is <20% of that of as-received HTA (Fig. 4(a)).
The effect of oxygen on Al activity is different from that of water vapor (Fig. 4(b)). The induction time for the beginning of Al–water reaction increases and the total hydrogen generation per unit weight of Al almost has no any change. This phenomenon is obvious after HTA was stored in oxygen for 8 and 47 days. As our experiment was performed from winter to spring, the room temperature has a large fluctuation. Previous work56 has confirmed that the environment temperature has an influence on the practical temperature of water in the reactor, because the thermal diffusion of the reactor is related to the environment temperature. When the environment temperature increases, the water temperature in the reactor increases even the thermostat bath temperature is constant. This is why the induction time of as-received HTA at an environment temperature of 25 °C is shorter than that at 11.5 °C (Fig. 4(b)). At a similar environment temperature (∼25 °C), the induction time of HTA stored in oxygen for 178 days is still longer than that of as-received HTA, as shown in Fig. 4(b).
Fig. 4(c) and (d) indicate that the total hydrogen generation per unit weight of Al almost has no change after HTA was stored in nitrogen and drying air for 6 and 5 months, respectively. But there is a change in induction time after HTA was stored in nitrogen and drying air for different time period. It is noticed that this change is basically consistent with the change in environment temperature during Al–water reaction test, i.e. the change in induction time results from the change in environment temperature. Therefore, if the environment temperature is considered, it seems that the effect of nitrogen and drying air on Al activity is weak.
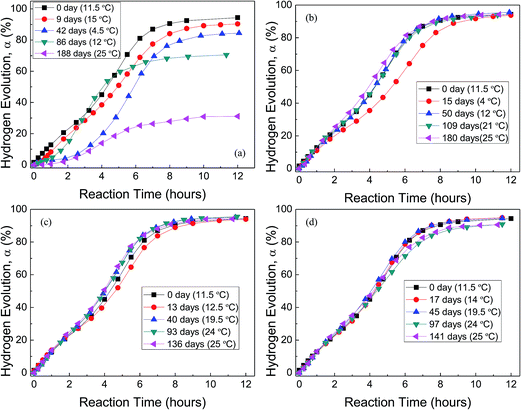
Fig. 5 shows the H2 evolution from deionized water at a thermostat temperature of 35 °C using GMAP and those stored in water vapor, oxygen, nitrogen and drying air for different time, respectively. GMAP is an activated Al, which almost has no induction time for the beginning of Al–water reaction.54 Therefore, the effect of different gas environment on the induction time of GMAP is small and unobservable. However, the total hydrogen generation per unit weight of Al decreases with increasing the storage time in water vapor. When the storage time in water vapor is ∼6 months, the total hydrogen generation is ∼30% of that of as-received GMAP (Fig. 5(a)). The effect of oxygen and nitrogen on the total hydrogen generation of GMAP is negligible even the storage time is up to 6 months (Fig. 5(b) and (c)). Moreover, the hydrogen-generation rate decreases after GMAP was stored in oxygen for 15 days (Fig. 5(b)), it probably is due to the lower environment temperature (4 °C) during Al–water reaction test. It is noticed that drying air has a small influence on the total hydrogen generation of GMAP. When the storage time in drying air is >3 months, the total hydrogen generation keeps ∼95% of that of as-received GMAP (Fig. 5(d)).
Fig. 6 and 7 show the X-ray diffraction patterns of as-received HTA and GMAP, and those after storage in different gas environment for a time period. It can be seen that as-received HTA only has Al metal phase, while as-received GMAP has a composition of Al and γ-Al2O3. The phase of the white particles on as-received HTA particle surfaces is not observed, the possible reason is that their amount is too small to be detected by X-ray diffraction (Fig. 6(a)). The phase constituents in HTA and GMAP have no observable change after they were stored in oxygen, nitrogen and drying air for several months except for water vapor. There is a bayerite (Al(OH)3) phase in HTA and GMAP after they were stored in water vapor for >3 months (Fig. 6(b) and 7(b)), indicating that part of their Al was consumed by the following reaction
| 2Al + 6H2O → 2Al(OH)3 + 3H2↑. | (2) |
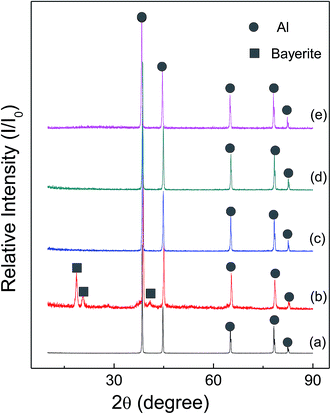 | ||
| Fig. 6 X-ray patterns of as-received HTA (a), that in (a) stored in water vapor for 158 days (b), in oxygen for 103 days (c), in nitrogen for 103 days (d) and in air for 189 days (e). | ||
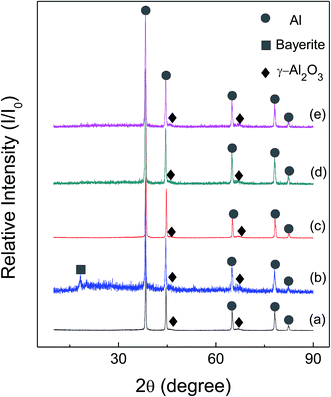 | ||
| Fig. 7 X-ray patterns of as-received GMAP (a), that in (a) stored in water vapor for 94 days (b), in oxygen for 152 days (c), in nitrogen for 50 days (d) and in air for 127 days (e). | ||
In Fig. 5(d), although the total hydrogen generation of GMAP decreases to ∼95% of that of as-received after it was stored in drying air for >3 months, the bayerite phase is not observed in Fig. 7(e), it is believed to be due to its low amount.
Previous mechanism analyses revealed that there is a hydration reaction in the passive oxide film on Al particle surface when Al particle is put into water.49 This hydration process determines the induction time for the beginning of Al–water reaction. That γ-Al2O3 grains on GMAP particle surfaces improve the Al–water reaction dynamics results from the catalytic effect of γ-Al2O3 on this hydration process,54 leading to almost no induction time for GMAP.
Based on the above experimental observation, a conceptual model is proposed to explain the change of Al particle after storage in oxygen and water vapor, respectively, as shown in Fig. 8. It should be mentioned that Al surface passive film is very thin and with thinness in several nanometer,57 which is difficult to be detected by X-ray diffraction (Fig. 6(a)). When Al particle is stored in oxygen, oxygen will transport through the passive film57 and contact Al inside, and then reacts with Al to form alumina, leading to a thickness increase in the passive film (Fig. 8(b)). The thickness increase in the passive film will prolong the hydration process and results in a longer induction time than as-received HTA, as shown in Fig. 3 and 4(b). As GMAP almost has no induction time, the effect of oxygen on its Al reaction dynamics is not obvious, as shown in Fig. 5(b).
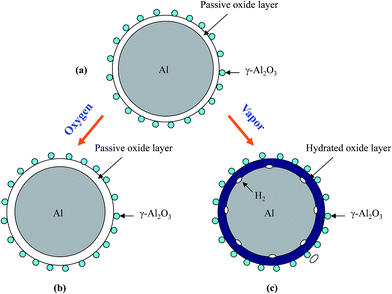 | ||
| Fig. 8 Schematic representation of the surface structure of an as-received HTA particle (a) and the change after it is stored in oxygen (b) and in water vapor (c) for a time period, respectively. | ||
When Al particle is stored in water vapor, water molecules will hydrate with the Al surface passive oxide film and reach the surface of Al inside,49 and then react with Al to generate hydrogen (Fig. 8(c)). With increasing the storage time in water vapor, more Al in HTA and GMAP is consumed. This is why the induction time of HTA decreases and the total hydrogen generation for both HTA and GMAP is reduced, as shown in Fig. 4(a) and 5(a). The above speculation was also confirmed by X-ray diffraction (Fig. 6(b) and 7(b)) and SEM observation. The piece-like structure on HTA and GMAP particle surfaces (Fig. 1(b) and 2(b)) should be the reaction byproduct bayerite.
As nitrogen does not react with Al at room temperature, the Al activity almost has no change after HTA and GMAP are stored in nitrogen environment, as shown in Fig. 4(c) and 5(c), which was also confirmed by X-ray diffraction (Fig. 6(d) and 7(d)) and SEM observation (Fig. 1(d) and 2(d)). In this work, drying air has a humidity of ∼25%, there should be a synergic effect of oxygen and water vapor on Al activity when HTA and GMAP are stored in drying air. Oxygen increases the thickness of Al surface oxide film and prolongs the reaction induction time, however water vapor promotes the hydration process and speeds up the Al–water reaction. It seems that this synergic effect on the Al activity is weak even HTA and GMAP were stored in drying air for ∼5 months (Fig. 3, 4(d) and 5(d)), which was also confirmed by X-ray diffraction (Fig. 6(e) and 7(e)) and SEM observation (Fig. 1(e) and 2(e)). Of course, the Al activity degradation of GMAP in drying air is faster than that of HTA due to the catalytic effect of γ-Al2O3 on the hydration process (see Fig. 4(d) and 5(d)). The above results imply that Al metal can be stored in nitrogen, oxygen and drying air, in order to keep its activity.
Conclusions
In this work, the effect of storage gas environment on Al activity for a time period up to ∼6 months was investigated. It was found that oxygen increases the thickness of Al surface passive film and prolongs its hydration process, leading to a longer induction time for the beginning of Al–water reaction (HTA). Water vapor promotes the hydration process of Al surface passive film and speeds up the Al–water reaction, leading to a decrease in total hydrogen generation per unit amount of Al for both HTA and GMAP. The effect of nitrogen and drying air on the Al activity is weak, because nitrogen does not react with Al at room temperature and there is a lower humidity in drying air. Our results indicate that water vapor rather than oxygen is responsible for the degradation of Al activity during storage in atmospheric environment.Acknowledgements
We would like to thank the financial support of Shanghai Key Laboratory of High Temperature Superconductors (No. 14DZ2260700).References
- D. F. Waters and C. P. Cadou, J. Power Sources, 2013, 221, 272–283 CrossRef CAS.
- L. Bai, F. Fang, Y. Y. Zhao, Y. G. Liu, J. P. Li, G. Y. Huang and H. Y. Sun, RSC Adv., 2014, 4, 43039–43046 RSC.
- W. Z. Gai, Z. Y. Deng and Y. Shi, RSC Adv., 2015, 5, 84223–84231 RSC.
- G. Y. Huang, S. M. Xu, Y. Yang, H. Y. Sun and Z. H. Xu, RSC Adv., 2016, 6, 10763–10774 RSC.
- G. Y. Huang, X. Y. Guo, X. Cao, Q. H. Tian and H. Y. Sun, Nano Energy, 2016, 28, 338–345 CrossRef CAS.
- Z. Y. Deng, J. M. F. Ferreira and Y. Sakka, J. Am. Ceram. Soc., 2008, 91, 3825–3834 CrossRef CAS.
- X. N. Huang, T. Gao, X. L. Pan, D. Wei, C. J. Lv, L. S. Qin and Y. X. Huang, J. Power Sources, 2013, 229, 133–140 CrossRef CAS.
- J. Macanás, L. Soler, A. M. Candela, M. Muñoz and J. Casado, Energy, 2011, 36, 2493–2501 CrossRef.
- H. B. Dai, G. L. Ma, H. J. Xia and P. Wang, Energy Environ. Sci., 2011, 4, 2206–2212 CAS.
- M. K. Yu, M. J. Kim, B. Y. Yoon, S. K. Oh, D. H. Nam and H. S. Kwon, Int. J. Hydrogen Energy, 2014, 39, 19416–19423 CrossRef CAS.
- A. Saffarzadeh, N. Arumugam and T. Shimaoka, Int. J. Hydrogen Energy, 2016, 41, 820–831 CrossRef CAS.
- B. Yuan, S. C. Tan and J. Liu, Int. J. Hydrogen Energy, 2016, 41, 1453–1459 CrossRef CAS.
- A. O. Dudoladov, O. A. Buryakovskaya, M. S. Vlaskin, A. Z. Zhuk and E. I. Shkolnikov, Int. J. Hydrogen Energy, 2016, 41, 2230–2237 CrossRef CAS.
- C. Y. Ho and C. H. Huang, Int. J. Hydrogen Energy, 2016, 41, 3741–3747 CrossRef CAS.
- J. L. Lopez-Miranda and G. Rosas, Int. J. Hydrogen Energy, 2016, 41, 4054–4059 CrossRef CAS.
- X. H. Yang, B. Yuan and J. Liu, Int. J. Hydrogen Energy, 2016, 41, 6193–6199 CrossRef CAS.
- O. V. Kravchenko, K. N. Semenenko, B. M. Bulychev and K. B. Kalmykov, J. Alloys Compd., 2005, 397, 58–62 CrossRef CAS.
- M. Q. Fan, F. Xu and L. X. Sun, Int. J. Hydrogen Energy, 2007, 32, 2809–2815 CrossRef CAS.
- M. Q. Fan, L. X. Sun and F. Xu, Energy, 2010, 35, 2922–2926 CrossRef CAS.
- A. V. Ilyukhina, O. V. Kravchenko, B. M. Bulychev and E. I. Shkolnikov, Int. J. Hydrogen Energy, 2010, 35, 1905–1910 CrossRef CAS.
- Z. W. Zhao, X. Y. Chen and M. M. Hao, Energy, 2011, 36, 2782–2787 CrossRef CAS.
- J. T. Ziebarth, J. M. Woodall, R. A. Kramer and G. Choi, Int. J. Hydrogen Energy, 2011, 36, 5271–5279 CrossRef CAS.
- X. Y. Hu, G. Z. Zhu, Y. J. Zhang, Y. M. Wang, M. S. Gu, S. Yang, P. X. Song, X. J. Li, H. J. Fang, G. S. Jiang and Z. F. Wang, Int. J. Hydrogen Energy, 2012, 37, 11012–11020 CrossRef CAS.
- H. H. Wang, Y. Chang, S. J. Dong, Z. F. Lei, Q. B. Zhu, P. Luo and Z. X. Xie, Int. J. Hydrogen Energy, 2013, 38, 1236–1243 CrossRef CAS.
- T. T. He, W. Wang, D. M. Chen and K. Yang, Int. J. Hydrogen Energy, 2014, 39, 684–691 CrossRef CAS.
- S. Elitzur, V. Rosenband and A. Gany, Int. J. Hydrogen Energy, 2014, 39, 6328–6334 CrossRef CAS.
- X. Y. Chen, Z. W. Zhao, X. H. Liu, M. M. Hao, A. L. Chen and Z. Y. Tang, J. Power Sources, 2014, 254, 345–352 CrossRef CAS.
- T. P. Huang, Q. Gao, D. Liu, S. N. Xu, C. B. Guo, J. J. Zou and C. D. Wei, Int. J. Hydrogen Energy, 2015, 40, 2354–2362 CrossRef CAS.
- W. J. Yang, T. Y. Zhang, J. H. Zhou, W. Shi, J. Z. Liu and K. F. Cen, Energy, 2015, 88, 537–543 CrossRef CAS.
- W. J. Yang, T. Y. Zhang, J. Z. Liu, Z. H. Wang, J. H. Zhou and K. F. Cen, Energy, 2015, 93, 451–457 CrossRef CAS.
- W. J. Yang, X. W. Liu, J. Z. Liu, Z. H. Wang, J. H. Zhou and K. F. Cen, Int. J. Hydrogen Energy, 2016, 41, 7927–7934 CrossRef CAS.
- E. Czech and T. Troczynski, Int. J. Hydrogen Energy, 2010, 35, 1029–1037 CrossRef CAS.
- K. Mahmoodi and B. Alinejad, Int. J. Hydrogen Energy, 2010, 35, 5227–5232 CrossRef CAS.
- H. Luo, J. Liu, X. X. Pu, J. Liang, Z. J. Wang, F. J. Wang, K. Zhang, Y. J. Peng, B. Xu, J. H. Li and X. B. Yu, J. Am. Ceram. Soc., 2011, 94, 3976–3982 CrossRef CAS.
- P. Dupiano, D. Stamatis and E. L. Dreizin, Int. J. Hydrogen Energy, 2011, 36, 4781–4791 CrossRef CAS.
- H. W. Wang, H. W. Chung, H. T. Teng and G. Z. Cao, Int. J. Hydrogen Energy, 2011, 36, 15136–15144 CrossRef CAS.
- X. N. Huang, C. J. Lv, Y. Wang, H. Y. Shen, D. Chen and Y. X. Huang, Int. J. Hydrogen Energy, 2012, 37, 7457–7463 CrossRef CAS.
- H. T. Teng, T. Y. Lee, Y. K. Chen, H. W. Wang and G. Z. Cao, J. Power Sources, 2012, 219, 16–21 CrossRef CAS.
- S. S. Razavi-Tousi and J. A. Szpunar, Int. J. Hydrogen Energy, 2013, 38, 795–806 CrossRef CAS.
- H. Q. Nie, S. S. Zhang, M. Schoenitz and E. L. Dreizin, Int. J. Hydrogen Energy, 2013, 38, 11222–11232 CrossRef CAS.
- X. Y. Chen, Z. W. Zhao, M. M. Hao and D. Z. Wang, J. Power Sources, 2013, 222, 188–195 CrossRef CAS.
- Y. Y. Jia, J. Shen, H. X. Meng, Y. M. Dong, Y. J. Chai and N. Wang, J. Alloys Compd., 2014, 588, 259–264 CrossRef CAS.
- F. Xu, L. X. Sun, X. F. Lan, H. L. Chu, Y. J. Sun, H. Y. Zhou, F. Li, L. N. Yang, X. L. Si, J. Zhang, S. Walter and Z. Gabelica, Int. J. Hydrogen Energy, 2014, 39, 5514–5521 CrossRef CAS.
- S. S. Razavi-Tousi and J. A. Szpunar, Metall. Mater. Trans. E, 2014, 1, 247–256 CAS.
- Y. A. Liu, X. H. Wang, H. Z. Liu, Z. H. Dong, S. Q. Li, H. W. Ge and M. Yan, Energy, 2014, 72, 421–426 CrossRef CAS.
- Y. A. Liu, X. H. Wang, H. Z. Liu, Z. H. Dong, S. Q. Li, H. W. Ge and M. Yan, Energy, 2015, 84, 714–721 CrossRef CAS.
- Y. A. Liu, X. H. Wang, H. Z. Liu, Z. H. Dong, S. Q. Li, H. W. Ge and M. Yan, Energy, 2015, 89, 907–913 CrossRef CAS.
- Z. Y. Deng, Y. F. Liu, Y. Tanaka, J. H. Ye and Y. Sakka, J. Am. Ceram. Soc., 2005, 88, 977–979 CrossRef CAS.
- Z. Y. Deng, J. M. F. Ferreira, Y. Tanaka and J. H. Ye, J. Am. Ceram. Soc., 2007, 90, 1521–1526 CrossRef CAS.
- Z. Y. Deng, Y. B. Tang, L. L. Zhu, Y. Sakka and J. H. Ye, Int. J. Hydrogen Energy, 2010, 35, 9561–9568 CrossRef CAS.
- C. S. Fang, W. Z. Gai and Z. Y. Deng, J. Am. Ceram. Soc., 2014, 97, 44–47 CrossRef CAS.
- N. Wang, H. X. Meng, Y. M. Dong, Z. L. Jia, L. J. Gao and Y. J. Chai, Int. J. Hydrogen Energy, 2014, 39, 16936–16943 CrossRef CAS.
- Y. Yang, W. Z. Gai, Z. Y. Deng and J. G. Zhou, Int. J. Hydrogen Energy, 2014, 39, 18734–18742 CrossRef CAS.
- W. Z. Gai, Y. Shi, Z. Y. Deng and J. G. Zhou, Int. J. Hydrogen Energy, 2015, 40, 12057–12062 CrossRef CAS.
- W. Z. Gai, W. H. Liu, Z. Y. Deng and J. G. Zhou, Int. J. Hydrogen Energy, 2012, 37, 13132–13140 CrossRef CAS.
- G. H. Liang, W. Z. Gai, Z. Y. Deng, P. G. Xu and Z. X. Cheng, RSC Adv., 2016, 6, 35305–35314 RSC.
- B. C. Bunker, G. C. Nelson, K. R. Zavadil, J. C. Barbour, F. D. Wall and J. P. Sullivan, et al., J. Phys. Chem. B, 2002, 106, 4705–4713 CrossRef CAS.
Footnote |
| † Electronic supplementary information (ESI) available. See DOI: 10.1039/c6ra25563a |
| This journal is © The Royal Society of Chemistry 2017 |

