 Open Access Article
Creative Commons Attribution 3.0 Unported Licence
A fluorescence “turn-on” chemosensor for Hg2+ and Ag+ based on NBD (7-nitrobenzo-2-oxa-1,3-diazolyl)†
Seong Youl Lee,
Kwon Hee Bok and
Cheal Kim*
Department of Fine Chemistry, Department of Interdisciplinary Bio IT Materials, Seoul National University of Science and Technology, Seoul 139-743, Korea. E-mail: chealkim@seoultech.ac.kr; Fax: +82-2-973-9149; Tel: +82-2-970-6693
First published on 3rd January 2017
Abstract
A new fluorescent sensor 1 was prepared by bridging a 7-nitrobenzo-2-oxo-1,3-diazolyl (NBD) fluorophore with a dimethyl ethylene amine group via an ethylamine spacer. Distinct “turn-on” fluorescence changes of 1 were observed upon the addition of Hg2+ and Ag+ in the aqueous solution. The sensor 1 showed high sensitivity toward Hg2+ and Ag+ with detection limits of 0.05 μM and 0.12 μM, respectively. Moreover, the sensing abilities of 1 for Hg2+ and Ag+ were successfully carried out in real water samples, and 1 functioned as fluorescent test strip with silica plate. The sensing mechanisms of 1 with Hg2+ and Ag+ were studied by using photophysical experiments, NMR titration, and ESI-mass spectrometry analysis. Moreover, turn-on fluorescence of 1 toward Hg2+ and Ag+ caused by photo-induced electron transfer (PET) was explained by density functional theory (DFT) calculations.
1. Introduction
The development of selective fluorescence chemosensors for the detection of heavy and transition metal ions has received considerable attention because these ions show important toxic effects in biological and environmental systems.1–5 Mercury is one of the most dangerous and commonplace pollutants in the environment. Human activities, such as burning coal and using mercury to manufacture industrial products, have increased the amount of mercury in air, water and soil.5,6 It can be accumulated over time on the bodies of humans and animals, and acts as a neurotoxin, harming the brain and nervous system.7 High exposure to mercury may result in serious diseases, such as prenatal brain damage, kidney dysfunction, and disorders of the central nervous system.8 Silver is a type of important precious metal and has been widely used in industry, such as electrical and electronic applications, photographic production and the manufacturing of fungicides.9 These widespread applications have resulted in increased silver content of environmental systems.10 Apart from the industrial importance, silver ions can cause severe damage to human beings.11 For example, silver ions inactivate sulfhydryl enzymes and combine with amine, imidazole, and carboxyl groups of various metabolites.12–14 Therefore, sensing mercury and silver ions has steadily attracted a great deal of attention in various areas.15Conventional methods, such as inductively coupled plasma atomic mass spectrometry, atomic absorption spectroscopy and electrochemical workstation,16–18 have been utilized to realize the detection of mercury and silver ions. Although these methods are sensitive and accurate, advanced instructor and complicated time-consuming sample pre-treatments are needed. In contrast, fluorescent chemosensors have been regarded as useful tools for sensing biologically important metal ions because of their advantages, such as low cost, facile sample preparation, the simplicity and high sensitivity.19–28 However, both mercury and silver ions are known as fluorescence quenchers. Most of reported fluorescent chemosensors for mercury and silver ions are based on a fluorescence quenching mechanism, and single-ion responsive.29,30 Instead, multi-ion recognizing with a single sensor is recently getting popular due to their advantages, such as cost reduction and more efficient analysis. Until now, only a few “turn-on” chemosensors that can detect simultaneously both mercury and silver ion have been reported.19,31–33
NBD (7-nitrobenzo-2-oxo-1,3-diazolyl) is a well-known fluorophore and frequently adopted in designing a fluorescent chemosensor owing to its distinct spectral properties.34–41 As for the receptor, N,N′-dimethyl ethylene amine group offers a good possibility of chelation with transition metal ions.42 Therefore, we expected that a chemosensor having NBD and N,N′-dimethyl ethylene amine moieties (fluorophore-receptor) linked via ethylamine (bridge) might effectively detect a certain metal ion through the photoinduced electron transfer (PET) process.43–47
Herein, we report a fluorescence chemosensor 1 based on bridging a 7-nitrobenzo-2-oxo-1,3-diazolyl (NBD) fluorophore with dimethyl ethylene amine group via an ethylamine spacer for Hg2+ and Ag+. These two metal ions induced the “turn-on” fluorescence of 1 in aqueous solution. Moreover, 1 could be used to quantify Hg2+ and Ag+ in water samples and function as fluorescent test strip. The sensing mechanisms of Hg2+ and Ag+ were supported by theoretical calculations.
2. Experimental
2.1. Materials and equipment
All the solvents and reagents (analytical grade and spectroscopic grade) were obtained from Sigma-Aldrich and used as received. 1H NMR and 13C NMR measurements were performed on a Varian 400 MHz and 100 MHz spectrometer, and chemical shifts were recorded in ppm. Electrospray ionization mass spectra (ESI-MS) were collected on a Thermo Finnigan (San Jose, CA, USA) LCQTM Advantage MAX quadrupole ion trap instrument. Absorption spectra were recorded at room temperature using a Perkin Elmer model Lambda 25 UV/Vis spectrometer. The emission spectra were recorded on a Perkin-Elmer LS45 fluorescence spectrometer. Elemental analysis for carbon, nitrogen and hydrogen was carried out by using a Vario micro cube elemental analyzer (ELEMENTAR) in laboratory center of Seoul National University of Science and Technology, Korea.2.2. Synthesis of sensor 1
The compound 2 was synthesized according to the literature method.35 The 1H NMR spectra of 2 were recorded in DMSO-d6 (Fig. S1†), and the descriptions of the signals include: s = singlet, d = doublet, t = triplet and m = multiplet (400 MHz, 25 °C): δ = 9.49 (s, 1H), 8.51 (d, 1H), 6.53 (d, 1H), 3.91 (s, 4H). The sensor 1 was prepared by the reaction of 2 (0.29 g, 1.0 mmol), N,N-dimethylethylenediamine (899.5 μL, 10 mmol) and K2CO3 (0.14 g, 1.0 mmol) in acetonitrile (CH3CN). After stirring at 60 °C for 5 days, the solvent was removed under the reduced pressure to afford brown oil. Silica gel chromatography was used to isolate pure product (10![[thin space (1/6-em)]](https://www.rsc.org/images/entities/char_2009.gif) :
:![[thin space (1/6-em)]](https://www.rsc.org/images/entities/char_2009.gif) 1, v/v, CH2Cl2–CH3OH). Yield: 0.062 g (21%). The 1H NMR spectra of 1 were recorded in CDCl3 (Fig. S2,† 400 MHz, 25 °C): δ = 8.48 (d, 1H), 6.14 (d, 1H), 3.48 (s, 2H), 2.87 (t, 2H), 2.71 (t, 2H), 2.59 (t, 2H), 2.30 (s, 6H), 13C NMR (Fig. S3,† 100 MHz, DMSO-d6, 25 °C): δ = 144.02, 139.50, 137.14, 132.39, 122.25, 94.13, 67.22, 49.27, anal. calcd for C12H18N6O3: C, 48.97; H, 6.16; N, 28.56%. C, 48.50.; H, 6.15.; N, 28.27%. LRMS (ESI): m/z calcd for C12H18N6O3 + H+: 295.15; found 295.00.
1, v/v, CH2Cl2–CH3OH). Yield: 0.062 g (21%). The 1H NMR spectra of 1 were recorded in CDCl3 (Fig. S2,† 400 MHz, 25 °C): δ = 8.48 (d, 1H), 6.14 (d, 1H), 3.48 (s, 2H), 2.87 (t, 2H), 2.71 (t, 2H), 2.59 (t, 2H), 2.30 (s, 6H), 13C NMR (Fig. S3,† 100 MHz, DMSO-d6, 25 °C): δ = 144.02, 139.50, 137.14, 132.39, 122.25, 94.13, 67.22, 49.27, anal. calcd for C12H18N6O3: C, 48.97; H, 6.16; N, 28.56%. C, 48.50.; H, 6.15.; N, 28.27%. LRMS (ESI): m/z calcd for C12H18N6O3 + H+: 295.15; found 295.00.
2.3. Fluorescence titrations
For Hg2+, a stock solution (5 mM) of the sensor 1 was prepared in dimethylsulfoxide (DMSO) and 3 μL of the sensor 1 (5 mM) was diluted to 2.997 mL buffer–CH3CN mixture (7![[thin space (1/6-em)]](https://www.rsc.org/images/entities/char_2009.gif) :
:![[thin space (1/6-em)]](https://www.rsc.org/images/entities/char_2009.gif) 3, v/v) to make final concentration of 5 μM. Then, 0.15–1.50 μL of a stock solution of Hg(NO3)2 (20 mM) were added to 3 mL of 1 solution (5 μM). After mixing them for a few seconds, fluorescence spectra were taken at room temperature.
3, v/v) to make final concentration of 5 μM. Then, 0.15–1.50 μL of a stock solution of Hg(NO3)2 (20 mM) were added to 3 mL of 1 solution (5 μM). After mixing them for a few seconds, fluorescence spectra were taken at room temperature.
For Ag+, a stock solution (5 mM) of the sensor 1 was prepared in DMSO and 3 μL of the sensor 1 (5 mM) was diluted to 2.997 mL buffer–CH3CN mixture (7![[thin space (1/6-em)]](https://www.rsc.org/images/entities/char_2009.gif) :
:![[thin space (1/6-em)]](https://www.rsc.org/images/entities/char_2009.gif) 3, v/v) to make final concentration of 5 μM. Then, 0.15–2.40 μL of a stock solution of AgNO3 (20 mM) were added to 3 mL of 1 solution (5 μM). After mixing them for a few seconds, fluorescence spectra were taken at room temperature.
3, v/v) to make final concentration of 5 μM. Then, 0.15–2.40 μL of a stock solution of AgNO3 (20 mM) were added to 3 mL of 1 solution (5 μM). After mixing them for a few seconds, fluorescence spectra were taken at room temperature.
2.4. UV-vis titrations
For Hg2+, a stock solution (5 mM) of the sensor 1 was prepared in DMSO and 3 μL of the sensor 1 (5 mM) was diluted to 2.997 mL buffer–CH3CN mixture (7![[thin space (1/6-em)]](https://www.rsc.org/images/entities/char_2009.gif) :
:![[thin space (1/6-em)]](https://www.rsc.org/images/entities/char_2009.gif) 3, v/v) to make final concentration of 5 μM. Then, 0.15–1.80 μL of a stock solution of Hg(NO3)2 (20 mM) were added to 3 mL of 1 solution (5 μM). After mixing them for a few seconds, UV-vis spectra were taken at room temperature.
3, v/v) to make final concentration of 5 μM. Then, 0.15–1.80 μL of a stock solution of Hg(NO3)2 (20 mM) were added to 3 mL of 1 solution (5 μM). After mixing them for a few seconds, UV-vis spectra were taken at room temperature.
For Ag+, a stock solution (5 mM) of the sensor 1 was prepared in DMSO and 3 μL of the sensor 1 (5 mM) was diluted to 2.997 mL buffer–CH3CN mixture (7![[thin space (1/6-em)]](https://www.rsc.org/images/entities/char_2009.gif) :
:![[thin space (1/6-em)]](https://www.rsc.org/images/entities/char_2009.gif) 3, v/v) to make final concentration of 5 μM. Then, 0.15–2.10 μL of a stock solution of AgNO3 (20 mM) were added to 3 mL of 1 solution (5 μM). After mixing them for a few seconds, UV-vis spectra were taken at room temperature.
3, v/v) to make final concentration of 5 μM. Then, 0.15–2.10 μL of a stock solution of AgNO3 (20 mM) were added to 3 mL of 1 solution (5 μM). After mixing them for a few seconds, UV-vis spectra were taken at room temperature.
2.5. Job plot measurements
For Hg2+, a series of solutions containing sensor 1 (20 μM) and Hg(NO3)2 (20 μM) were prepared in such a manner that the total volumes of sensor 1 and metal ion remained constant (3 mL), and buffer–CH3CN mixture (7![[thin space (1/6-em)]](https://www.rsc.org/images/entities/char_2009.gif) :
:![[thin space (1/6-em)]](https://www.rsc.org/images/entities/char_2009.gif) 3, v/v) was used as a solvent. After mixing them for a few seconds, fluorescence spectra were taken at room temperature. Job plot was drawn by plotted against the molar fraction of sensor 1 under the constant total concentration.
3, v/v) was used as a solvent. After mixing them for a few seconds, fluorescence spectra were taken at room temperature. Job plot was drawn by plotted against the molar fraction of sensor 1 under the constant total concentration.
For Ag+, a series of solutions containing sensor 1 (20 μM) and AgNO3 (20 μM) were prepared in such a manner that the total volumes of sensor 1 and metal ion remained constant (3 mL), and buffer–CH3CN mixture (7![[thin space (1/6-em)]](https://www.rsc.org/images/entities/char_2009.gif) :
:![[thin space (1/6-em)]](https://www.rsc.org/images/entities/char_2009.gif) 3, v/v) was used as a solvent. After mixing them for a few seconds, fluorescence spectra were taken at room temperature. Job plot was drawn by plotted against the molar fraction of sensor 1 under the constant total concentration.
3, v/v) was used as a solvent. After mixing them for a few seconds, fluorescence spectra were taken at room temperature. Job plot was drawn by plotted against the molar fraction of sensor 1 under the constant total concentration.
2.6. Competition experiments
For Hg2+, a stock solution of the sensor 1 (5 mM) was prepared in DMSO and 3.0 μL of this solution was diluted to 3 mL of buffer–CH3CN mixture (7![[thin space (1/6-em)]](https://www.rsc.org/images/entities/char_2009.gif) :
:![[thin space (1/6-em)]](https://www.rsc.org/images/entities/char_2009.gif) 3, v/v) to make final concentration of 5 μM. Stock solutions (20 mM) of various metal ions such as Al3+, Ga3+, In3+, Zn2+, Cu2+, Cd2+, Fe2+, Fe3+, Mg2+, Cr3+, Ag+, Co2+, Ni2+, Na+, K+, Ca2+, Mn2+ and Pb2+ were prepared. 1.35 μL of each metal solution was taken and added to 3 mL of the solution of sensor 1 (5 μM) to give 1.8 equiv. of metal ions. Then, 1.35 μL of Hg2+ solution was added into the mixed solution of each metal ion and 1 to make 1.8 equiv. After mixing them for a few seconds, fluorescence spectra were taken at room temperature.
3, v/v) to make final concentration of 5 μM. Stock solutions (20 mM) of various metal ions such as Al3+, Ga3+, In3+, Zn2+, Cu2+, Cd2+, Fe2+, Fe3+, Mg2+, Cr3+, Ag+, Co2+, Ni2+, Na+, K+, Ca2+, Mn2+ and Pb2+ were prepared. 1.35 μL of each metal solution was taken and added to 3 mL of the solution of sensor 1 (5 μM) to give 1.8 equiv. of metal ions. Then, 1.35 μL of Hg2+ solution was added into the mixed solution of each metal ion and 1 to make 1.8 equiv. After mixing them for a few seconds, fluorescence spectra were taken at room temperature.
For Ag+, a stock solution of the sensor 1 (5 mM) was prepared in DMSO and 3.0 μL of this solution was diluted to 3 mL of buffer–CH3CN mixture (7![[thin space (1/6-em)]](https://www.rsc.org/images/entities/char_2009.gif) :
:![[thin space (1/6-em)]](https://www.rsc.org/images/entities/char_2009.gif) 3, v/v) to make final concentration of 5 μM. Stock solutions (20 mM) of various metal ions such as Al3+, Ga3+, In3+, Zn2+, Cu2+, Cd2+, Fe2+, Fe3+, Mg2+, Cr3+, Hg2+, Co2+, Ni2+, Na+, K+, Ca2+, Mn2+ and Pb2+ were prepared. 1.95 μL of each metal solution was taken and added to 3 mL of the solution of sensor 1 (5 μM) to give 2.6 equiv. of metal ions. Then, 1.95 μL of Ag+ solution was added into the mixed solution of each metal ion and 1 to make 2.6 equiv. After mixing them for a few seconds, fluorescence spectra were taken at room temperature.
3, v/v) to make final concentration of 5 μM. Stock solutions (20 mM) of various metal ions such as Al3+, Ga3+, In3+, Zn2+, Cu2+, Cd2+, Fe2+, Fe3+, Mg2+, Cr3+, Hg2+, Co2+, Ni2+, Na+, K+, Ca2+, Mn2+ and Pb2+ were prepared. 1.95 μL of each metal solution was taken and added to 3 mL of the solution of sensor 1 (5 μM) to give 2.6 equiv. of metal ions. Then, 1.95 μL of Ag+ solution was added into the mixed solution of each metal ion and 1 to make 2.6 equiv. After mixing them for a few seconds, fluorescence spectra were taken at room temperature.
2.7. pH effect test
For Hg2+, a series of buffers with pH values ranging from 2 to 12 was prepared by mixing sodium hydroxide solution and hydrochloric acid in bis–tris buffer. After the solution with a desired pH was achieved, a stock solution (5 mM) of the sensor 1 was prepared in DMSO and 3.0 μL of this solution was diluted to 3 mL of buffer–CH3CN (7![[thin space (1/6-em)]](https://www.rsc.org/images/entities/char_2009.gif) :
:![[thin space (1/6-em)]](https://www.rsc.org/images/entities/char_2009.gif) 3, v/v) mixture to make final concentration of 5 μM. Stock solutions (20 mM) of various Hg2+ ions were prepared and 1.35 μL of each stock solution was taken and added to 3 mL of the solution of sensor 1 (5 μM) to give 1.8 equiv. of metal ions. After reacting them for a few seconds, fluorescence spectra were taken at room temperature.
3, v/v) mixture to make final concentration of 5 μM. Stock solutions (20 mM) of various Hg2+ ions were prepared and 1.35 μL of each stock solution was taken and added to 3 mL of the solution of sensor 1 (5 μM) to give 1.8 equiv. of metal ions. After reacting them for a few seconds, fluorescence spectra were taken at room temperature.
For Ag+, a series of buffers with pH values ranging from 2 to 12 was prepared by mixing sodium hydroxide solution and hydrochloric acid in bis–tris buffer. After the solution with a desired pH was achieved, a stock solution (5 mM) of the sensor 1 was prepared in DMSO and 3.0 μL of this solution was diluted to 3 mL of buffer–CH3CN (7![[thin space (1/6-em)]](https://www.rsc.org/images/entities/char_2009.gif) :
:![[thin space (1/6-em)]](https://www.rsc.org/images/entities/char_2009.gif) 3, v/v) to make final concentration of 5 μM. Stock solutions (20 mM) of various Ag+ ions were prepared and 1.95 μL of each stock solution was taken and added to 3 mL of the solution of sensor 1 (5 μM) to give 2.6 equiv. of metal ions. After reacting them for a few seconds, fluorescence spectra were taken at room temperature.
3, v/v) to make final concentration of 5 μM. Stock solutions (20 mM) of various Ag+ ions were prepared and 1.95 μL of each stock solution was taken and added to 3 mL of the solution of sensor 1 (5 μM) to give 2.6 equiv. of metal ions. After reacting them for a few seconds, fluorescence spectra were taken at room temperature.
2.8. Water sample collection
The drinking water samples were collected from a water purifier and tap water samples collected from a tap in our laboratory.2.9. 1H NMR titrations
For Hg2+, three NMR tubes of sensor 1 (1.47 mg, 0.005 mmol) dissolved in CD3CN (700 μL) were prepared and then three different concentrations (0, 0.0025 and 0.005 mmol) of Hg(NO3)2 dissolved in DMF-d7 were added to each solution of sensor 1. After shaking them for a minute, 1H NMR spectra were obtained at room temperature.For Ag+, three NMR tubes of sensor 1 (1.47 mg, 0.005 mmol) dissolved in CD3CN (700 μL) were prepared and then three different concentrations (0, 0.0025 and 0.005 mmol) of AgNO3 dissolved in CD3CN were added to each solution of sensor 1. After shaking them for a minute, 1H NMR spectra were obtained at room temperature.
2.10. Theoretical calculation methods
All DFT/TDDFT calculations based on the hybrid exchange correlation functional B3LYP48,49 were carried out using Gaussian 03 program.50 The 6-31G** basis set51,52 was used for the main group elements, whereas the Lanl2DZ effective core potential (ECP)53–55 was employed for Hg and Ag. In vibrational frequency calculations, there was no imaginary frequency for the optimized geometries of 1, 1–Hg2+ and 1–Ag+, suggesting that these geometries represented local minima. For all calculations, the solvent effect of acetonitrile was considered by using the Cossi and Barone's CPCM (conductor-like polarizable continuum model).56,57 To investigate the electronic properties of singlet excited states, time-dependent DFT (TDDFT) was performed in the ground state geometries of 1, 1–Hg2+ and 1–Ag+. The 25 singlet–singlet excitations were calculated and analyzed. The GaussSum 2.1 (ref. 58) was used to calculate the contributions of molecular orbitals in electronic transitions.3. Results and discussion
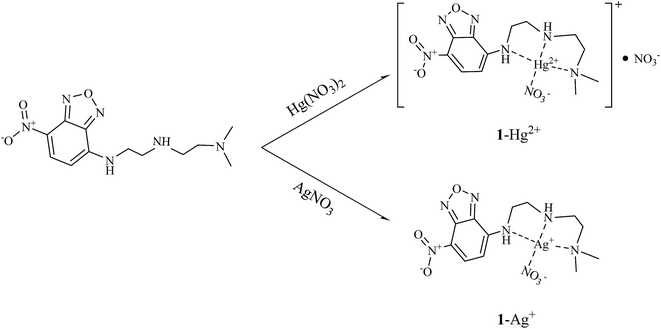
The compound 2 was synthesized by the substitution reaction of NBD chloride and bromoethylamine according to the literature method, and the sensor 1 was also prepared by the substitution reaction of 2 and N,N-dimethylethylenediamine with 21% yield in CH3CN (Scheme 1). Both compounds 1 and 2 were characterized by 1H NMR and 13C NMR, ESI-mass spectroscopy, and elemental analysis.3.1. Fluorescence and absorption spectroscopic studies of 1 toward Hg2+ and Ag+
To explore the sensing behavior of sensor 1 toward metal ions, the fluorescence responses to various metal ions including Al3+, Ga3+, In3+, Zn2+, Cd2+, Cu2+, Fe2+, Fe3+, Mg2+, Cr3+, Hg2+, Ag+, Co2+, Ni2+, Na+, K+, Ca2+, Mn2+ and Pb2+ were investigated in buffer–CH3CN (7![[thin space (1/6-em)]](https://www.rsc.org/images/entities/char_2009.gif) :
:![[thin space (1/6-em)]](https://www.rsc.org/images/entities/char_2009.gif) 3, v/v) solution (Fig. 1). Compared to the other metal ions examined, remarkable enhancements of fluorescence were observed in the presence of Hg2+ and Ag+, suggesting that 1 can be used to sense Hg2+ and Ag+ as a “turn-on” chemosensor. In contrast, no obvious fluorescent response behavior to other metal ions was observed under the identical conditions.
3, v/v) solution (Fig. 1). Compared to the other metal ions examined, remarkable enhancements of fluorescence were observed in the presence of Hg2+ and Ag+, suggesting that 1 can be used to sense Hg2+ and Ag+ as a “turn-on” chemosensor. In contrast, no obvious fluorescent response behavior to other metal ions was observed under the identical conditions.
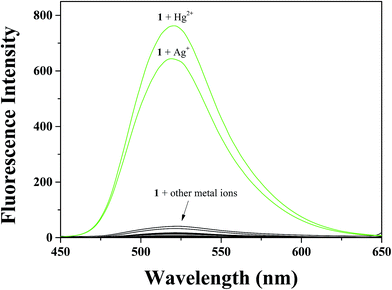 | ||
Fig. 1 Fluorescence spectral changes of 1 (5 μM) in the presence of 2.6 equiv. of different metal ions in a mixture of buffer–CH3CN (7![[thin space (1/6-em)]](https://www.rsc.org/images/entities/char_2009.gif) : :![[thin space (1/6-em)]](https://www.rsc.org/images/entities/char_2009.gif) 3, v/v). 3, v/v). | ||
In order to gain an insight into the signaling properties of 1 toward Hg2+, fluorescence titrations were conducted. The fluorescence intensity at 520 nm increased up to 1.8 equiv. of Hg2+ (Fig. 2). The interaction between 1 and Hg2+ was further investigated through UV-vis titration (Fig. 3). Upon the addition of Hg2+ to a solution of 1, the absorption peaks at 340 and 460 nm gradually decreased while the absorption intensity at 400 increased. Moreover, three clear-defined isosbestic points at 324 nm, 366 nm and 447 nm were observed, which implied that the only one product was generated from 1 upon binding Hg2+.
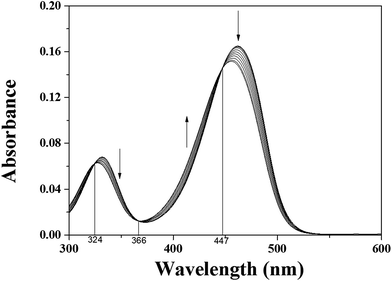 | ||
Fig. 3 Absorption spectral changes of 1 (5 μM) in the presence of different concentrations of Hg2+ ions in a mixture of buffer–CH3CN (7![[thin space (1/6-em)]](https://www.rsc.org/images/entities/char_2009.gif) : :![[thin space (1/6-em)]](https://www.rsc.org/images/entities/char_2009.gif) 3, v/v) at room temperature. 3, v/v) at room temperature. | ||
To determine the stoichiometric ratio of 1 and Hg2+, Job plot analysis59 was carried out using emission titration experiments in the presence of various molar fractions of Hg2+ (Fig. S4†). A maximum emission was observed when the molar fraction reached 0.5, suggesting that the complex formation between 1 and Hg2+ has a stoichiometric ratio of 1![[thin space (1/6-em)]](https://www.rsc.org/images/entities/char_2009.gif) :
:![[thin space (1/6-em)]](https://www.rsc.org/images/entities/char_2009.gif) 1. As shown in Fig. 4, the 1
1. As shown in Fig. 4, the 1![[thin space (1/6-em)]](https://www.rsc.org/images/entities/char_2009.gif) :
:![[thin space (1/6-em)]](https://www.rsc.org/images/entities/char_2009.gif) 1 complex formation was also confirmed by ESI-mass analysis. The peak at m/z = 558.00 corresponded to the coordination structure of [1 + Hg2+ + NO3−]+ (calcd: 558.10). The evidence for the reaction between 1 and Hg2+ was further provided by 1H NMR titration (Fig. S5†). Upon complexation with 1 equiv. of Hg2+, the protons H1 and H2 of aromatic ring moved slightly downfield. At the same time, the protons H4–H9 underwent large downfield shifts, which indicate the coordination of Hg2+ to the three aliphatic amine nitrogens (Scheme 2). There was no shift in the position of proton signals on further addition of Hg2+ (>1.0 equiv.).
1 complex formation was also confirmed by ESI-mass analysis. The peak at m/z = 558.00 corresponded to the coordination structure of [1 + Hg2+ + NO3−]+ (calcd: 558.10). The evidence for the reaction between 1 and Hg2+ was further provided by 1H NMR titration (Fig. S5†). Upon complexation with 1 equiv. of Hg2+, the protons H1 and H2 of aromatic ring moved slightly downfield. At the same time, the protons H4–H9 underwent large downfield shifts, which indicate the coordination of Hg2+ to the three aliphatic amine nitrogens (Scheme 2). There was no shift in the position of proton signals on further addition of Hg2+ (>1.0 equiv.).
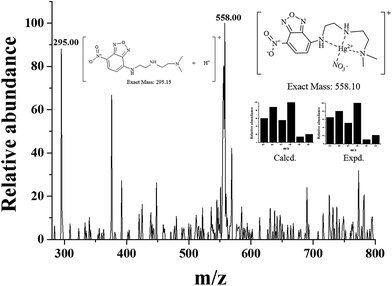 | ||
| Fig. 4 Positive-ion electrospray ionization mass spectrum of 1 (10 μM) upon addition of Hg(NO3)2 (1.0 equiv.). | ||
On the basis of the 1![[thin space (1/6-em)]](https://www.rsc.org/images/entities/char_2009.gif) :
:![[thin space (1/6-em)]](https://www.rsc.org/images/entities/char_2009.gif) 1 stoichiometry and fluorescence titration data, the binding constant of 1–Hg2+ complex was determined to be 5.0 × 10⁴ from Benesi–Hildebrand equation (Fig. S6†).60 This value is within the range of those (103 to 1010) reported for Hg2+ sensing chemosensor. The detection limit (3σ/K)61 of sensor 1 as a fluorometric sensor for the analysis of Hg2+ was found to be 0.05 μM (Fig. S7†), which is the lowest one among those of chemosensors previously reported for the simultaneous detection of Hg2+ and Ag+, to the best of our knowledge (Table S1†).
1 stoichiometry and fluorescence titration data, the binding constant of 1–Hg2+ complex was determined to be 5.0 × 10⁴ from Benesi–Hildebrand equation (Fig. S6†).60 This value is within the range of those (103 to 1010) reported for Hg2+ sensing chemosensor. The detection limit (3σ/K)61 of sensor 1 as a fluorometric sensor for the analysis of Hg2+ was found to be 0.05 μM (Fig. S7†), which is the lowest one among those of chemosensors previously reported for the simultaneous detection of Hg2+ and Ag+, to the best of our knowledge (Table S1†).
The fluorescence competition experiments were conducted by adding 1.8 equiv. of Hg2+ to the solution of 1 in the presence of 1.8 equiv. of other common background metal ions (Fig. 5). No fluorescence intensity change of 1–Hg2+ complex was observed with metal ions such as Al3+, Ga3+, In3+, Zn2+, Cd2+, Cu2+, Fe2+, Fe3+, Mg2+, Cr3+, Ag+, Co2+, Ni2+, Na+, K+, Ca2+, Mn2+ and Pb2+. The results indicated that the presence of background ions exerted no interference to the detection of Hg2+.
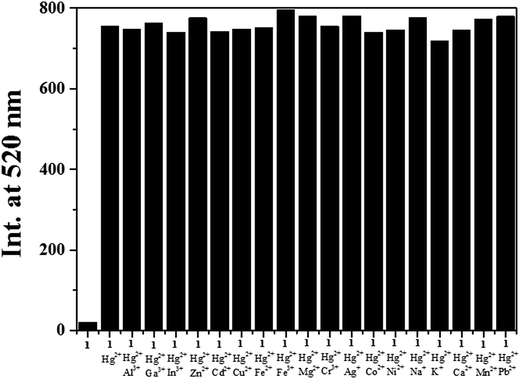 | ||
| Fig. 5 Competitive selectivity of 1 (5 μM) toward Hg2+ (1.8 equiv.) in the presence of other metal ions (1.8 equiv.). | ||
The influence of pH on the detection properties of 1 for Hg2+ was examined in buffer–CH3CN (7![[thin space (1/6-em)]](https://www.rsc.org/images/entities/char_2009.gif) :
:![[thin space (1/6-em)]](https://www.rsc.org/images/entities/char_2009.gif) 3, v/v) solution at various pH values ranging from 2 to 12 (Fig. S8†). A stable and strong fluorescence intensity of 1–Hg2+ complex was observed between pH 6 and 9. This result warranted its application under environmental conditions, without any change in detection of Hg2+.
3, v/v) solution at various pH values ranging from 2 to 12 (Fig. S8†). A stable and strong fluorescence intensity of 1–Hg2+ complex was observed between pH 6 and 9. This result warranted its application under environmental conditions, without any change in detection of Hg2+.
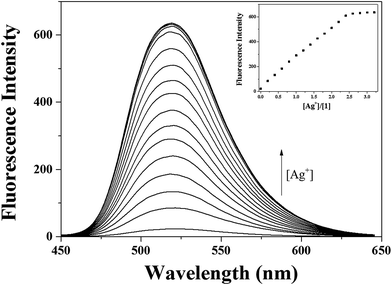
Next, the binding properties of 1 with Ag+ were studied by fluorescence and UV-vis titration experiments. The fluorescence titration experiments were performed by increasing concentration of Ag+ into a solution of 1 (Fig. 6). The fluorescence intensity increased up to 2.6 equiv. and then no further change was observed. The UV-vis titration of 1 with Ag+ solution revealed that the absorption bands at 330 nm and 460 nm decreased and a band at 400 nm gradually increased (Fig. S9†). Clear isosbestic points at 323 nm, 366 nm and 446 nm emerged during the UV-vis titration, which indicated that the only one complex was formed between 1 and Ag+.
The stoichiometry of the 1–Ag+ complex was determined by Job plot,59 ESI-mass spectrometry analysis and 1H NMR titration. The Job plot for the binding of 1 and Ag+ exhibited a 1![[thin space (1/6-em)]](https://www.rsc.org/images/entities/char_2009.gif) :
:![[thin space (1/6-em)]](https://www.rsc.org/images/entities/char_2009.gif) 1 stoichiometry (Fig. S10†). The positive-ion mass spectrum confirmed the formation of [1 + Ag+ + NO3− + H+]+ based on the presence of a peak at m/z = 464.40 (calcd: 464.04) (Fig. S11†). In Fig. S12† is shown the 1H NMR spectra of 1 in the absence and presence of Ag+. Upon addition of 1.0 equiv. of Ag+, the protons H1 and H2 of aromatic ring moved slightly upfield. The protons H4–H9 showed large downfield shifts, which indicated that the binding sites of 1 with Ag+ might be the three aliphatic amine nitrogens (Scheme 2). There was no shift in the position of proton signals on further addition of Ag+ (>1.0 equiv.).
1 stoichiometry (Fig. S10†). The positive-ion mass spectrum confirmed the formation of [1 + Ag+ + NO3− + H+]+ based on the presence of a peak at m/z = 464.40 (calcd: 464.04) (Fig. S11†). In Fig. S12† is shown the 1H NMR spectra of 1 in the absence and presence of Ag+. Upon addition of 1.0 equiv. of Ag+, the protons H1 and H2 of aromatic ring moved slightly upfield. The protons H4–H9 showed large downfield shifts, which indicated that the binding sites of 1 with Ag+ might be the three aliphatic amine nitrogens (Scheme 2). There was no shift in the position of proton signals on further addition of Ag+ (>1.0 equiv.).
The association constant for 1–Ag+ complex was calculated to be 3.5 × 10⁴ M−1 from a Benesi–Hildebrand plot (Fig. S13†).60 This value is within the range of those (102 to 109) reported for Ag+-binding sensors. The detection limit61 of 1 for Ag+ was determined to be 0.12 μM (Fig. S14†), which is the second lowest one among those of chemosensors previously reported for the simultaneous detection of Hg2+ and Ag+, to the best of our knowledge (Table S1†).
To utilize 1 as an ion-selective fluorescence chemosensor for Ag+, the effect of competing metal ions was carried out (Fig. S15†). Upon addition of 2.6 equiv. of Ag+ in the presence of other metal ions (2.6 equiv.), such as Al3+, Ga3+, In3+, Zn2+, Cd2+, Cu2+, Fe2+, Fe3+, Cr3+, Mg2+, Hg2+, Co2+, Ni2+, Na+, K+, Ca2+, Mn2+ and Pb2+ there was no interference in the detection of Ag+ from most of the metal ions. Hg2+ showed about 25% increase of the emission of 1–Ag+ complex.
The pH dependence of 1 in the absence and presence of Ag+ was conducted at various pH (2–12) (Fig. S16†). 1–Ag+ complex showed a stable and strong fluorescence intensity between pH 6 and 9. This result warranted its application under environmental systems, without any change in detection of Ag+.
To understand the binding ability and reversibility of 1 to Hg2+ and Ag+, we carried out reversible experiments by using an ethylenediaminetetraacetic acid (EDTA) (Fig. 7). The addition of EDTA to a solution of 1–Hg2+ complex caused an immediate decrease of the fluorescence intensity (Fig. 7a). Upon the addition of Hg2+ again, the fluorescence intensity at 520 nm was recovered. The emission changes were almost reversible even after several cycles with the sequentially alternative addition of Hg2+ and EDTA. These results indicated that sensor 1 could be recyclable simply through treatment with a proper reagent such as EDTA. In contrast, the addition of EDTA to the solution of 1–Ag+ complex showed no change of fluorescence intensity (Fig. 7b), indicating that 1–Ag+ complex was irreversible with EDTA. Importantly, it is worthwhile to mention that the reversible property of 1–Hg2+ complex by EDTA is very useful, because it can distinguish 1–Hg2+ complex from 1–Ag+ complex. As shown in Fig. 1, both Hg2+ and Ag+ showed the “turn-on” fluorescence in the presence of 1. If 1 would show a “turn-on” fluorescence in the presence of a certain metal ion, it can be Hg2+ or Ag+. In such a case, the reversible property with EDTA would indicate that the metal ion could be Hg2+, while it could be Ag+ with no reversible property.
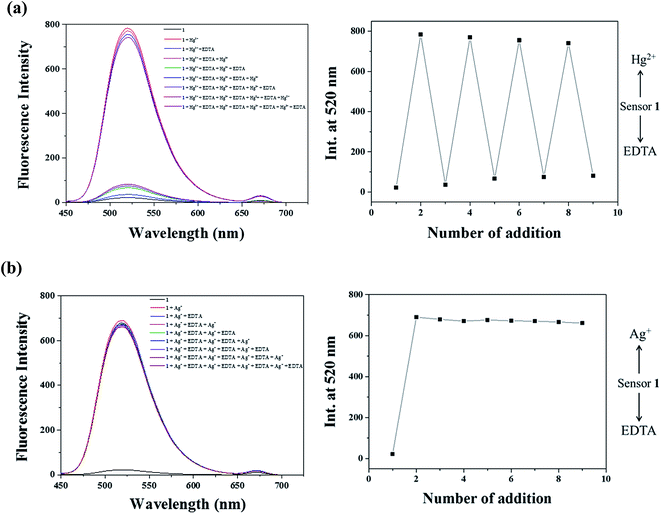 | ||
| Fig. 7 Fluorescence spectral changes of 1 (5 μM) after the sequential addition of (a) Hg2+ and EDTA and (b) Ag+ and EDTA. | ||
Additionally, we found that 1–Ag+ complex underwent demetallation with Cl− to regenerate the sensor 1, while 1–Hg2+ complex did not react with Cl− (Fig. S17†). These observations would be useful to determine Hg2+ in a mixture of Ag+ and Hg2+. In the case of a mixture solution containing both Hg2+ and Ag+ ions, the addition of Cl− into the solution would remove Ag+ ions by the formation of AgCl. Then, Hg2+ can be determined by 1. On the other hand, EDTA can be used to remove Hg2+ in a mixture solution of Hg2+ and Ag+. Then, Ag+ can be determined by 1.
We constructed calibration curves for the determination of Hg2+ and Ag+ by 1 (Fig. 8 and S18†). Good linear relationships were observed for both 1–Hg2+ and 1–Ag+ with correlation coefficients of R2 = 0.9992 and 0.9969 (n = 3), respectively. To evaluate the practical abilities of 1 with Hg2+ and Ag+, tap water and drinking water samples were selected and analyzed. Each sample was analyzed with three replicates. As shown in Tables 1 and 2, satisfactory recoveries and suitable R.S.D. values for both Hg2+ and Ag+ were obtained. These results suggested that the chemosensor 1 could be useful for the measurements of Hg2+ and Ag+ in chemical and environmental applications.
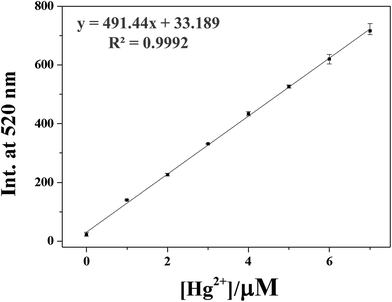 | ||
Fig. 8 Emission intensity (520 nm) of 1 as a function of Hg2+ concentration. [1] = 5 μmol L−1 and [Hg2+] = 0.0–7.0 μmol L−1 in buffer–CH3CN mixture (7![[thin space (1/6-em)]](https://www.rsc.org/images/entities/char_2009.gif) : :![[thin space (1/6-em)]](https://www.rsc.org/images/entities/char_2009.gif) 3, v/v). 3, v/v). | ||
| Sample | Hg2+ added (μmol L−1) | Hg2+ found (μmol L−1) | Recovery (%) | R.S.D. (n = 3) (%) |
|---|---|---|---|---|
a Conditions: [1] = 5 μmol L−1 in 10 mM buffer–CH3CN solution (7![[thin space (1/6-em)]](https://www.rsc.org/images/entities/char_2009.gif) : :![[thin space (1/6-em)]](https://www.rsc.org/images/entities/char_2009.gif) 3, pH 7.0).b 5.00 μmol L−1 of Hg2+ ions was artificially added into drinking water.c 5.00 μmol L−1 of Hg2+ ions was artificially added into tap water. 3, pH 7.0).b 5.00 μmol L−1 of Hg2+ ions was artificially added into drinking water.c 5.00 μmol L−1 of Hg2+ ions was artificially added into tap water. |
||||
| Drinking water | 0.00 | 0.00 | 97.4 | 4.95 |
| 5.00b | 4.87 | |||
| Tap water | 0.00 | 0.00 | 103.4 | 7.30 |
| 5.00c | 5.17 | |||
| Sample | Ag+ added (μmol L−1) | Ag+ found (μmol L−1) | Recovery (%) | R.S.D. (n = 3) (%) |
|---|---|---|---|---|
a Conditions: [1] = 5 μmol L−1 in 10 mM buffer–CH3CN solution (7![[thin space (1/6-em)]](https://www.rsc.org/images/entities/char_2009.gif) : :![[thin space (1/6-em)]](https://www.rsc.org/images/entities/char_2009.gif) 3, pH 7.0).b 7.00 μmol L−1 of Ag+ ions was artificially added into drinking water.c 7.00 μmol L−1 of Ag+ ions was artificially added into tap water. 3, pH 7.0).b 7.00 μmol L−1 of Ag+ ions was artificially added into drinking water.c 7.00 μmol L−1 of Ag+ ions was artificially added into tap water. |
||||
| Drinking water | 0.00 | 0.00 | 101.6 | 1.49 |
| 7.00b | 7.11 | |||
| Tap water | 0.00 | 0.00 | 103.7 | 6.94 |
| 7.00c | 7.26 | |||
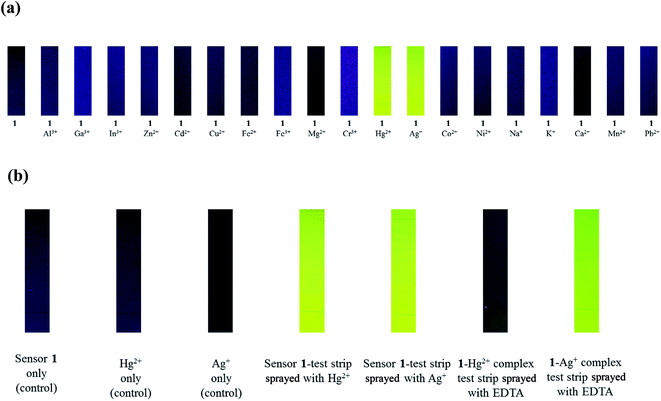
For practical application, fluorescent test strips were prepared by immersing silica plate in a CH3CN solution of 1 and then dried in air. As shown in Fig. 9, when the test strips were immersed in solutions of Hg2+ and Ag+, they exhibited strong fluorescence under the UV lamp (356 nm, Fig. 9a). Importantly, EDTA can distinguish 1–Hg2+ complex from 1–Ag+ complex (Fig. 9b). Therefore, the fluorescent test strip coated with 1 can be used for detecting Hg2+ and Ag+ ions.
3.2. Theoretical calculation studies for 1–Hg2+ and 1–Ag+
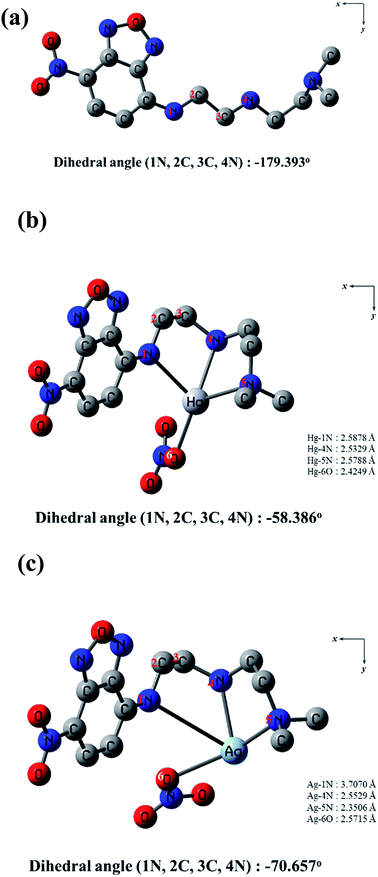
To get insight into the mechanism on the fluorescence sensing of 1 toward Hg2+ and Ag+, density functional theory (DFT) and time dependent-density functional theory (TD-DFT) calculations were conducted. All optimization studies were carried out using the B3LYP/6-31G(d,p) method basis set on the Gaussian 03 program. The calculated energy-minimized structures of 1, 1–Hg2+ and 1–Ag+ species are shown in Fig. 10. The energy-minimized structure of 1 showed a chair structure with the dihedral angle of 1N, 2C, 3C, 4N = −179.393° (Fig. 10a). On the other hand, 1–Hg2+ and 1–Ag+ complexes showed drastic changes in their geometries. 1–Hg2+ complex exhibited a tetra-coordinated structure with the dihedral angle of 1N, 2C, 3C, 4N = −58.386°, and Hg2+ was coordinated to 1N, 4N, 5N of 1 and an oxygen atom of NO3− (Fig. 10b). For 1–Ag+ complex, Ag+ was coordinated to 1N, 4N, 5N of 1 and an oxygen atom of NO3− with the dihedral angle of 1N, 2C, 3C, 4N = −70.657° (Fig. 10c). TD-SCF calculations were conducted to provide more information about the electronic characters between 1 and the two metal ions. The transition energies and oscillator strengths of 1, 1–Hg2+ and 1–Ag+ complexes were obtained from GEN basis set (Fig. S19–S23†). In the case of 1, the main molecular orbital (MO) contribution of the 6th lowest excited state was determined for the HOMO−1→ LUMO+1 transition (319.45 nm, Fig. S19†). The HOMO−1 of 1 mainly located on the dimethyl ethylenediamine segment, and LUMO+1 spread around the NBD moiety. These results indicated a photo-induced electron transfer (PET) from the dimethyl ethylenediamine segment to the NBD moiety with the initial non-radiative process of 1. With the introduction of Hg2+, the 3rd excited state was determined for the main molecular orbital contribution (HOMO → LUMO+2 transition, Fig. S20†). HOMO and LUMO+2 of 1–Hg2+ complex mainly lied in the NBD moiety. Its transition was assigned to π → π* transition in the NBD moiety and indicated a radiative transition. MO diagrams and excitation energies of 1 and 1–Hg2+ are shown in Fig. S21.† For the 1–Ag+ complex, the main molecular orbital (MO) contribution of the 5th lowest excited state was determined for HOMO → LUMO+1 (323.28 nm, Fig. S22†). The HOMO and LUMO+1 were localized in the NBD moiety, and related to π → π* transition (Fig. S23†). Therefore, these results indicated that the “turn-on” sensing mechanisms of 1 toward Hg2+ and Ag+ may be due to the inhibition of PET process. With the integration of information obtained from Job plot, ESI-mass spectroscopy analysis, 1H NMR titration and theoretical calculations, the binding modes of 1–Hg2+ and 1–Ag+ complexes are depicted in Scheme 2.4. Conclusion
We have synthesized a new chemosensor 1, based on the NBD and the dimethyl ethylene amine groups. The sensor 1 could be used for the simultaneous fluorescence “turn-on” recognition of Hg2+ and Ag+ in aqueous solution. The binding modes of 1 with Hg2+ and Ag+ were determined by Job plot, ESI-mass spectrometry and 1H NMR titration. Their turn-on fluorescence caused by inhibition of PET was explained by DFT calculations. Moreover, 1 can clearly distinguish Hg2+ from Ag+ by use of an EDTA. For practical application, 1 could be used to detect and quantify Hg2+ and Ag+ levels in real water samples, and also showed fluorescent detection of Hg2+ and Ag+ with test strips. Therefore, we believe that sensor 1 will offer an important guidance to the development of single sensors for recognizing both Hg2+ and Ag+.Acknowledgements
Basic Science Research Program through the National Research Foundation of Korea (NRF) funded by the Ministry of Education, Science and Technology (NRF-2014R1A2A1A11051794 and NRF-2015R1A2A2A09001301) are gratefully acknowledged. We thank Nano-Inorganic Laboratory, Department of Nano & Bio Chemistry, Kookmin University to access the Gaussian 03 program packages.References
- B. Valeur and I. Leray, Coord. Chem. Rev., 2000, 205, 3–40 CrossRef CAS.
- S. Goswami, A. K. Das and S. Maity, Dalton Trans., 2013, 42, 16259–16263 RSC.
- L. Tang, M. Cai, P. Zhou, J. Zhao, K. Zhong, S. Hou and Y. Bian, RSC Adv., 2013, 3, 16802–16809 RSC.
- D. Maity and T. Govindaraju, Chem. Commun., 2012, 48, 1039–1041 RSC.
- H. H. Harris, I. J. Pickering and G. N. George, Science, 2003, 301, 1203 CrossRef CAS PubMed.
- S. Goswami, S. Maity, A. C. Maity, A. kumar Das, B. Pakhira, K. Khanra, N. Bhattacharyya and S. Sarkar, RSC Adv., 2015, 5, 5735–5740 RSC.
- P. B. Tchounwou, W. K. Ayensu, N. Ninashvili and D. Sutton, Environ. Toxicol., 2003, 18, 149–175 CrossRef CAS PubMed.
- J. Mutter, J. Naumann, R. Schneider, H. Walach and B. Haley, Neuroendocrinol. Lett., 2005, 26, 439–446 Search PubMed.
- X.-B. Zhang, Z.-X. Han, Z.-H. Fang, G.-L. Shen and R.-Q. Yu, Anal. Chim. Acta, 2006, 562, 210–215 CrossRef CAS.
- Z. L. He, X. E. Yang and P. J. Stoffella, J. Trace Elem. Med. Biol., 2005, 19, 125–140 CAS.
- H. T. Ratte, Environ. Toxicol. Chem., 1999, 18, 89–108 CrossRef CAS.
- K. Matsuda, N. Hiratsuka, T. Koyama, Y. Kurihara, O. Hotta, Y. Itoh and K. Shiba, Clin. Chem., 2001, 47, 763–766 CAS.
- A. C. And and E. U. Akkaya, J. Am. Chem. Soc., 2005, 127, 10464–10465 CrossRef PubMed.
- J. L. Sessler, E. Tomat and V. M. Lynch, J. Am. Chem. Soc., 2006, 128, 4184–4185 CrossRef CAS PubMed.
- B. Gu, L. Huang, N. Mi, P. Yin, Y. Zhang, X. Tu, X. Luo, S. Luo and S. Yao, Analyst, 2015, 140, 2778–2784 RSC.
- C. P. Hanna, J. F. Tyson and S. McIntosh, Anal. Chem., 1993, 65, 653–656 CrossRef CAS PubMed.
- S. C. K. Shum, H. M. Pang and R. S. Houk, Anal. Chem., 1992, 64, 2444–2450 CrossRef CAS PubMed.
- L. G. Martin, L. T. Jongwana and A. M. Crouch, Electrochim. Acta, 2010, 55, 4303–4308 CrossRef CAS.
- W. Shen, L. Wang, M. Wu and X. Bao, Inorg. Chem. Commun., 2016, 70, 107–110 CrossRef CAS.
- W. Shi, Y. Chen, X. Chen, Z. Xie and Y. Hui, J. Lumin., 2016, 174, 56–62 CrossRef CAS.
- J. H. Kim, J. Y. Noh, I. H. Hwang, J. J. Lee and C. Kim, Tetrahedron Lett., 2013, 54, 4001–4005 CrossRef CAS.
- Y. W. Choi, G. R. You, M. M. Lee, J. Kim and C. Kim, Inorg. Chem. Commun., 2014, 46, 43–46 CrossRef CAS.
- Y. W. Choi, J. J. Lee, G. R. You and C. Kim, RSC Adv., 2015, 5, 38308–38315 RSC.
- J. J. Lee, Y. S. Kim, E. Nam, S. Y. Lee, M. H. Lim and C. Kim, Dalton Trans., 2016, 45, 5700–5712 RSC.
- S. Y. Lee, J. J. Lee, K. H. Bok, J. A. Kim, Y. K. So and C. Kim, Inorg. Chem. Commun., 2016, 70, 147–152 CrossRef CAS.
- D. Maity, A. Raj, K. Dhanasekaran, T. K. Kundu and T. Govindaraju, Supramol. Chem., 2015, 27, 589–594 CrossRef CAS.
- L. Tang and M. Cai, Sens. Actuators, B, 2012, 173, 862–867 CrossRef CAS.
- S. Goswami, S. Das and K. Aich, Tetrahedron Lett., 2013, 54, 4620–4623 CrossRef CAS.
- H. C. Hung, C. W. Cheng, Y. Y. Wang, Y. J. Chen and W. S. Chung, Eur. J. Org. Chem., 2009, 36, 6360–6366 CrossRef.
- J. Fan, C. Chen, Q. Lin and N. Fu, Sens. Actuators, B, 2012, 173, 874–881 CrossRef CAS.
- S. Khatua and M. Schmittel, Org. Lett., 2013, 15, 4422–4425 CrossRef CAS PubMed.
- X. Zhang, Y. Xu, P. Guo and X. Qian, New J. Chem., 2012, 36, 1621–1625 RSC.
- H. A. El-Shekheby, A. H. Mangood, S. M. Hamza, A. S. Al-Kady and E.-Z. M. Ebeid, Luminescence, 2014, 29, 158–167 CrossRef CAS PubMed.
- S. Y. Lee, K. H. Bok, J. A. Kim, S. Y. Kim and C. Kim, Tetrahedron, 2016, 72, 5563–5570 CrossRef CAS.
- Z. Xie, K. Wang, C. Zhang, Z. Yang, Y. Chen, Z. Guo, G.-Y. Lu and W. He, New J. Chem., 2011, 35, 607–613 RSC.
- Y. Liu, Q. Qiao, M. Zhao, W. Yin, L. Miao, L. Wang and Z. Xu, Dyes Pigm., 2016, 133, 339–344 CrossRef CAS.
- G. Zhou, H. Wang, Y. Ma and X. Chen, Tetrahedron, 2013, 69, 867–870 CrossRef CAS.
- Z. Xu, G. H. Kim, S. J. Han, M. J. Jou, C. Lee, I. Shin and J. Yoon, Tetrahedron, 2009, 65, 2307–2312 CrossRef CAS.
- Y. B. Ruan, S. Maisonneuve and J. Xie, Dyes Pigm., 2011, 90, 239–244 CrossRef CAS.
- R. Rani, K. Paul and V. Luxami, New J. Chem., 2016, 40, 2418–2422 RSC.
- Y. Shen, Y. Zhang, X. Zhang, C. Zhang, L. Zhang, J. Jin, H. Li and S. Yao, Anal. Methods, 2014, 6, 4797–4802 RSC.
- G. J. Park, J. J. Lee, G. R. You, L. Nguyen, I. Noh and C. Kim, Sens. Actuators, B, 2016, 223, 509–519 CrossRef CAS.
- J. Kumar, M. J. Sarma, P. Phukan and D. K. Das, Dalton Trans., 2015, 44, 4576–4581 RSC.
- S. Suganya, S. Velmathi and D. Mubarakali, Dyes Pigm., 2014, 104, 116–122 CrossRef CAS.
- D. Zhou, C. Sun, C. Chen, X. Cui and W. Li, J. Mol. Struct., 2015, 1079, 315–320 CrossRef CAS.
- P. Song, J. X. Ding and T. S. Chu, Spectrochim. Acta, Part A, 2012, 97, 746–752 CrossRef CAS PubMed.
- Y. Zhang, H. Chen, D. Chen, D. Wu, Z. Chen, J. Zhang, X. Chen, S. H. Liu and J. Yin, Sens. Actuators, B, 2016, 224, 907–914 CrossRef CAS.
- A. D. Becke, J. Chem. Phys., 1993, 98, 5648–5652 CrossRef CAS.
- C. Lee, W. Yang and R. G. Parr, Phys. Rev. B: Condens. Matter Mater. Phys., 1988, 37, 785–789 CrossRef CAS.
- C. Gonzalez, J. A. Pople, M. J. Frisch, G. W. Trucks, H. B. Schlegel, G. E. Scuseria, M. A. Robb, J. R. Cheeseman, J. A. Montgomery Jr, T. Vreven, K. N. Kudin, J. C. Burant, J. M. Millam, S. S. Iyengar, J. Tomasi, V. Barone, B. Mennucci, M. Cossi, G. Scalmani, N. Rega and G. A. Peters, Gaussian, Inc., Wallingford CT, 2004.
- P. C. Hariharan and J. A. Pople, Theor. Chim. Acta, 1973, 28, 213–222 CrossRef CAS.
- M. M. Francl, W. J. Pietro, W. J. Hehre, J. S. Binkley, M. S. Gordon, D. J. DeFrees and J. A. Pople, J. Chem. Phys., 1982, 77, 3654–3665 CrossRef CAS.
- P. J. Hay and W. R. Wadt, J. Chem. Phys., 1985, 82, 270–283 CrossRef CAS.
- W. R. Wadt and P. J. Hay, J. Chem. Phys., 1985, 82, 284–298 CrossRef CAS.
- W. R. Wadt and P. J. Hay, J. Chem. Phys., 1985, 82, 299–310 CrossRef.
- V. Barone and M. Cossi, J. Phys. Chem. A, 1998, 102, 1995–2001 CrossRef CAS.
- M. Cossi and V. Barone, J. Chem. Phys., 2001, 115, 4708–4717 CrossRef CAS.
- N. M. O'Boyle, A. L. Tenderholt and K. M. Langner, J. Comput. Chem., 2008, 29, 839–845 CrossRef PubMed.
- P. Job, Ann. Chim., 1928, 9, 113–203 CAS.
- H. A. Benesi and J. H. Hildebrand, J. Am. Chem. Soc., 1949, 71, 2703–2707 CrossRef CAS.
- Y.-K. Tsui, S. Devaraj and Y.-P. Yen, Sens. Actuators, B, 2012, 161, 510–519 CrossRef CAS.
Footnote |
| † Electronic supplementary information (ESI) available. See DOI: 10.1039/c6ra25585j |
| This journal is © The Royal Society of Chemistry 2017 |


