DOI:
10.1039/C6RA25610D
(Paper)
RSC Adv., 2017,
7, 5937-5947
Magnetic nanoparticles with fluorescence and affinity for DNA sensing and nucleus staining†
Received
21st October 2016
, Accepted 12th December 2016
First published on 17th January 2017
Abstract
Most traditional fluorescent dyes have poor photostability and high toxicity. To address this problem, we modified magnetic nanoparticles (MNPs) with fluorescent Hoechst dye via covalent conjugation. The prepared MNPs were characterized by fluorescence spectrometry, transmission electron microscopy, Fourier transform infrared, and photon correlation spectrometry to verify their optical and chemical properties. Additionally, the pH effects of modification on the amide conjugation between Hoechst dye and MNPs were evaluated to maximize the conjugation efficacy. The Hoechst MNPs could target chromosome DNA and emit fluorescence after ultraviolet light irradiation. The nucleus of human embryonic kidney cells and rabbit corneal epithelial cells could be labeled within 1 min. The modified MNPs exhibited bright fluorescence and retained good magnetic properties. The influences of various parameters, such as salt effect and contact time, on the adsorption isotherms of ssDNA and plasmid DNA were investigated to understand the mechanism of nucleus labeling. The DNA adsorption behaviors of Hoechst MNPs followed the Langmuir isotherm model and the pseudo-second order kinetic model. The maximum adsorption values of ssDNA and pDNA were 1034 and 252 μg mg−1 MNP, respectively, which were higher than those in the literature. The fluorescent properties and the specific DNA bind capacity make the developed MNPs promising for fluorescent labeling and DNA separation.
Introduction
Hoechst dyes are used for nuclear staining because these derivatives are strongly fluorescent, cell permeable, and water soluble. Hoechst 33342 specifically binds to the minor groove of AT-rich sequences of double-stranded (ds) DNA and emits the excited fluorescence.1 The heterocyclic moiety in this dye is important for efficiently interacting with the DNA double helix, thus making the Hoechst–DNA complex more stable. Moreover, the phenyl ring of Hoechst is different from its parental compound Hoechst 33258 through 4-ethoxy substitution, which enhances membrane permeability for the cytometric and microscopic analyses of DNA content.2 The cationic charge in the Hoechst dye can provide electrostatic attraction through its amine groups and DNA anionic phosphates. Although the extensive studies of Hoechst dye for the staining, researches related to improve the efficacy and safe of this dye are still ongoing. Magnetic nanoparticles (MNPs) are of great interest because of their ultra-small size, good stability, and low toxicity. For example, MNPs can be guided by magnets to the target and be used as drug transporters. Fluorescent MNPs have already been synthesized to apply as dual sensing agents.3,4 Surface modification with specific ligands can simultaneously render the MNPs for different purposes, such as labeling, targeting, separating, and imaging tasks.5 Moreover, fluorescent nanoparticles enable accessing the targeted organelles and reducing the fluorescent background using high-resolution microscopes.6 Recently, fluorescent nanoparticles targeting specific bio-macromolecules with high specificity have provided insight into the detailed internalization pathway in vivo and in vitro.7 This emission from the fluorophores can provide valuable images using a fluorescence microscope. These nanoparticles also enable researchers to perform their optical tracking in intracellular processes as well as single cell isolation through magnet manipulation.8 Moreover, nanoparticles with small diffusion resistance and a high surface area can facilitate intracellular trafficking, uniform distribution, and specific modification.9
Monitoring DNA events in the nucleus continues to draw much interest among researchers because of the need to understand biological details in the nucleus.10 However, problems such as a limited diffusion rate and fluorescence quenching in the cytosols have to be overcome. Strategies such as core–shell nanocarriers, novel fluorophores, and linker design provide potential solutions.11 Different fluorophores, including quantum dot, fluorescein, and flavone, are combined with MNPs for labeling and detection applications.12 Li et al. successfully designed magnetic nanospheres containing fluorescein that can be applied to β-estradiol isolation and environmental hormone recognition.13 Zhang et al. prepared rhodamine-labeled Fe3O4 nanoparticles with stable fluorescence for the contrast agent in MRI and fluorescence sensing.14 Hybrid MNPs coated with perylene-diimide dye on their SiO2 surfaces have metal-enhanced fluorescence and the potential for cancer targeting functions.15 MNPs coated by vinylbenzyl carbazole dye have shown to be an effective contrast agent in MRI.16 The polymer shell of MNPs doped with CdSe/ZnS quantum dots has successfully been used in luminescence detection and magnetic separation.17 Recently, fluorescent MNPs have been designed by conjugating the acridine on the surface of MNPs. Functionalized MNPs can label cell nucleus through the specific absorption between DNA and acridine on MNPs and can emit fluorescence after DNA binding.18 These studies support the finding that fluorescent nanoparticles can facilitate various purposes, such as tracking, sensing, imaging, and labeling. Despite the extensive applications of Hoechst dye for DNA staining, uncertainty still remains concerning the dye's photo-stability and intense washes after staining.19 Hoechst-conjugated MNPs have not been reported so far according to our best knowledge. Therefore, we aim to develop a facile protocol for the fluorescent modification of MNPs. The potential implications of Hoechst MNPs as the fluorescent probe for cell imaging and as the adsorbent for DNA are studied. The systematic investigation of the cation species and ionic strength in the nucleus labeling mechanism using the Hoechst MNPs is also examined.
Experimental section
Materials
Hoechst 33342, N-(3-dimethylaminopropyl)-N′-ethyl carbodiimide (EDC), and KBr were purchased from Sigma-Aldrich (St. Louis, MO, USA). Paramagnetic iron oxide nanoparticles (COOH-surface modified) were purchased from Taiwan Advance Nanotech (Taoyuan, Taiwan). Plasmid EGFP-C3 (size 4.7 kb) was obtained from Takara Bio (Shiga, Japan). The plasmid was amplified in Escherichia coli DH-5 alpha and purified using a purification kit (GeneMark, Taipei, Taiwan). Single-stranded (ss) DNA of salmon milt was obtained from Maruha-Nichiro Foods Inc. (Tokyo, Japan). The size of the salmon milt DNA ranges from 300 bp to 500 bp. The purity of plasmid DNA (pDNA) and ssDNA was higher than 99% as determined using the 260/280 nm rule. All reagents were used without further purification.
Preparation of dye-coated MNPs
In our modification process, the amount of MNPs (0.45 mg) were mixed with 1 mL of a pH buffered solution containing 0.047 mg mL−1 of Hoechst dye (MW 561.9) and 0.4 mg mL−1 of EDC (MW 191.7), and reacted at a constant vortex rate for 0.5 h at 32 °C. The mole ratio of EDC to Hoechst dye was 25 in order to drive the crosslinking reaction to move forward. Several authors adopt the similar strategy for their conjugation reactions.20–22 Hoechst-modified nanoparticles were obtained and washed three times with deionized water to remove the un-reacted dye, separated using a magnetic separation system (Millipore), and stored at 4 °C. The pH conditions (3, 5, 7, 9, and 11) were obtained using acetic acid and sodium bicarbonate. The fluorescence of Hoechst was measured by an Epoch Spectrophotometer (Biotek, Winooski, VT) using ex 340 nm and em 455 nm. The density of the dye on the MNP surface was estimated by the mass balance of the initial and final dye concentrations in the reaction solution.
Characterization of Hoechst MNPs
The size and surface property of MNPs were characterized by transmission electron microscopy (TEM). A drop of diluted sample was dispersed onto a 100 mesh copper grid, and the excess drop was removed with filter paper. The sample containing a copper grid (CF200-Cu, Electron Microscopy Science) was dried for 2 h at 55 °C prior to TEM analysis. The morphology of the various MNPs was observed by TEM (JM-1011, JEOL, Tokyo, Japan). Fourier transform infrared spectroscopy (Alpha, Bruker, Germany) was used to characterize the presence of specific chemical groups in the modified MNPs. Dried samples (0.8 mg) were mixed with 80 mg KBr (IR grade) and compressed into a thin membrane using a desktop pellet press (ICL, Garfield, NJ). The IR spectra were processed by Bruker OPUS software. The zeta potential was characterized using a Zetasizer Nano ZS 90 (Malvern, Worcestershine, U.K.) at a temperature of 32 °C. The concentration of MNPs under different pH conditions was 0.001 mg mL−1. The different buffers (pH 3, 5, 6, 8, and 11) were obtained by adjusting the amount of CH3COOH (0.1%) and NaOH (0.1%).
Fluorescence characterization
Fluorescence spectrometer (F-2500, Hitachi, Japan) was employed to determine the emission spectra of modified MNPs (0.025 mg mL−1 in phosphate buffered saline (PBS)). The emission fluorescence spectra were recorded at the excitation wavelength of 350 nm over the emission range of 360–600 nm. The spectra of excited fluorescence were recorded at the emission wavelength of 455 nm over the excitation range of 300–440 nm. The slit of emission and excitation was 10 nm. The fluorescence images of the modified MNP/pDNA were recorded using the Gel-Doc EZ Imager (Biorad, Hercules, CA). MNPs of 5 mg were dried in a 70 °C oven overnight. Then, the MNPs were analyzed using a TGA Instrument Q50 at a constant heating rate of 10 °C min−1 from 37 °C to 550 °C in a nitrogen environment. The magnetization characteristics of MNPs were analyzed by a superconducting quantum interference device (SQUID, Quantum Design, MPMS7). MNPs of 0.1 mg were loaded on a filter paper for the SQUID test. The temperature was 300 K, and the magnetic range was ±10 K Gauss for the SQUID analysis.
Cell culture and MNP uptake analysis
The human embryonic kidney cells (HEK293T) and rabbit corneal epithelial cells (SIRC) cell lines were obtained from the Bioresource Collection and Research Center (Hsinchu, Taiwan) and were maintained in D MEM (high glucose) and MEM supplemented with 10% serum, respectively. In the MNP uptake experiments, cells were seeded in 48-well plates at a density of 6 × 10⁴ cells per well and allowed to grow for 24 h. DMEM medium (0.2 mL) containing 4 μg of MNP solution and 2 μg of Hoechst was added to the 48-well plate at 37 °C for various incubation intervals. The cells were washed with 0.2 mL PBS to remove the remaining particles. At the end of the incubation, cells were fixed by 0.15 mL of 4% formaldehyde and analyzed by the IN Cell Analyzer 1000 (GE Healthcare, Piscataway, NJ). Cells in 48-well plates were then analyzed for fluorescence intensity and fluorescent positive percentage. Fluorescence at 455 nm in the nucleus stained by Hoechst MNPs was recorded after excitation at 350 nm. The fluorescence of the dye at 526 nm was quantitatively analyzed after excitation at 502 nm. To analyze the fluorescent images, the IN Cell Investigator was used to identify the Hoechst-positive cells (blue fluorescence) and acridine orange-positive cells (green fluorescence). The percentage of fluorescence positive cells is defined as follows: (the number of cells exhibiting both blue and green fluorescence/the number of cells exhibiting blue fluorescence) × 100%. Cell viability is defined as follows: (the number of nuclei in treated cells/the number of nuclei in controlled cells) × 100%.
Adsorption of pDNA or ssDNA by MNPs
MNPs of 10 μg (10 μL) were added to the DNA solution (10 μL) at various DNA solutions and mixed with the 0.5 M salt solution (NaCl or CaCl2) in an Eppendorf tube and incubated for 30 min. The tested pDNA concentrations included 120, 130, 140, 175, 239, 280, 350, 478, and 550 ng μL−1. The ssDNA concentrations included 175, 239, 280, 500, 600, 700, 800, 900, and 1000 ng μL−1. The MNPs were removed magnetically from the DNA solution by a magnet. The amounts of DNA adsorbed on the magnetic nanoadsorbents were estimated from the mass balance of DNA in the solution. The concentration of nucleic acids was calculated by the NanoDrop spectrophotometer (Thermo, Wilmington, DE). For all experiments, four separate experiments were performed under each condition. The standard deviation of the measurement was calculated using the STDEV function of Microsoft Excel (Microsoft, Redmond, WA, USA).
Adsorption isotherms of MNPs
The Langmuir isotherm model was used to predict the existence of the monolayer coverage of the adsorbates. This model assumes that an adsorption site on the adsorbent surface is occupied by an adsorbate; no further sorption can take place at this site. The Freundlich isotherm model assumes that the adsorbent consists of heterogeneous surface and multiple layers of adsorbate formation. The DNA adsorption data were fitted by the Langmuir and Freundlich isotherm equations employing the iterative fitting method of Sigmaplot (Systat software, San Jose, CA). In the adsorption kinetics assay, the MNPs were removed from the solution by a magnet at different intervals of 1, 3, 5, 7, 10, 20, 30 min. The equilibrium concentration of DNA (Ce, mg L−1) was determined using the NanoDrop spectrophotometer (Thermo, Wilmington, DE). The concentration result was the average of triplicate measurements. The equilibrium adsorption capacity (q, mg g−1) of the magnetic adsorbent was calculated by conducting a mass balance of initial and equilibrium amounts of DNA in the solution. The following equations are for pseudo-first-order and pseudo-second-order kinetics, respectively. The pseudo-first-order and the pseudo-second-order kinetics models were used to analyze the kinetics. Both kinetic models can evaluate the availability of the adsorption sites on the surface of the adsorbent. The DNA adsorption rate determines the equilibrium time of the adsorption process and can be enumerated from kinetic analysis.
Langmuir:
Freundlich:
Pseudo-first-order:
Pseudo-second-order:
Results and discussion
Characterization of fluorescent MNPs
MNPs were coupled with the Hoechst dye through the carbodiimide activation to synthesize the fluorescent composites. The pH of conjugation for the dye and MNPs was optimized in the modification process. The pH effect on the Hoechst content of the MNPs is shown in Fig. 1. The modification efficacy of Hoechst increased rapidly from 1% at pH 7 to 14% at pH 9. The modification of MNPs by Hoechst was favored in the alkaline condition as the amine protonation in the dye impedes the conjugation with the activated carboxyl group. The enhancement was due to the removal of proton from the amine group of the Hoechst dye at basic pH conditions. Hoechst could efficiently form the amide bond with the MNPs and remain on the surfaces because of the increase in fluorescence at pH 9–11. Additionally, the thermogravimetric analysis (TGA), magnetization curves, TEM images, and zeta potential data of the Hoechst MNPs (HC MNPs) and bare MNPs are presented in ESI Fig. S1–S4.† According to the (TGA) analysis, the weight loss for bare MNPs and Hoechst MNPs was 10% and 14%, respectively (Fig. S1†). This result indicated that bare MNPs contained 10% organic compound. The Hoechst content in the nanoparticles was 4% of the total weight of MNPs synthesized in the alkaline process. The magnetization curves for two kinds of MNPs showed the characteristic sigmoidal trend under the external magnetic field. The saturation magnetization values of the MNPs and Hoechst MNPs were 20 and 40 emu g−1 Fe, respectively (Fig. S2†). The developed Hoechst MNPs were superparamagnetic and showed no hysteresis. Moreover, these superparamagnetic nanoparticles provided a strong response to an external magnetic field. TEM images indicated that the size of Hoechst MNPs was around 14.6 ± 2.4 nm, which was suitable for cell labeling and adsorption process (Fig. S3†). After modification, the isoelectric point of the Hoechst MNPs decreased from the original pH 3.3 to 5.3, which might be due to the low dissociation constant of bare MNPs (Fig. S4†). Our characteristic results indicated the successful synthesis of Hoechst MNPs using the developed process.
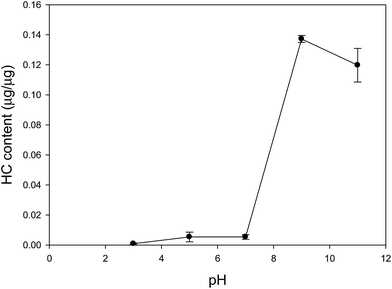 |
| | Fig. 1 Effect of reaction pH on Hoechst dye coating on MNP. | |
The surface of Hoechst MNPs is illustrated in Fig. 2 to show the covalent conjugation and Hoechst structure. To evaluate the fluorescence properties of the Hoechst dye and Hoechst MNPs, we analyzed the emission spectra of Hoechst MNPs, bare MNPs, and free Hoechst with the addition of DNA. The fluorescence emission spectra in the 360–600 nm range were recorded by fixing the excitation at 350 nm. As shown in Fig. 3, both free dye and Hoechst MNPs emitted an obvious fluorescence at 390 nm when the pDNA was added. The Hoechst dye can bind to the A–T regions of DNA in the minor groove.23 Upon binding to DNA, the free Hoechst dye and Hoechst MNPs increased the fluorescence intensity by 160–183% upon the addition of pDNA. The fluorescence intensity of the Hoechst MNPs was slightly lower than that of free Hoechst. This quenching could be attributed to energy being transferred to the iron oxide nanoparticles.24 No fluorescence was observed in the bare MNPs in the absence or presence of pDNA. These results revealed the successful modification of the dye in the MNPs because of the strong emission intensity and high fluorescent yield of the Hoechst MNPs. The fluorescence emission spectra of the Hoechst MNPs synthesized under different pH conditions in the absence or presence of plasmid DNA are shown in Fig. S5.† In the alkaline process, Hoechst could efficiently conjugate with the MNPs and donate the fluorescent property to the MNPs. When Hoechst MNPs was alone or mixed with pDNA, the fluorescence emission was similar to the fluorescence emission of the free Hoechst dye (Fig. S6†). The high content of the dye in the nanoparticles could result in enhanced fluorescence intensity. Hoechst MNPs produced at the pH 11 condition showed the strongest fluorescence intensity based on the fluorescence spectra. Therefore, the Hoechst MNPs synthesized in the pH 11 process were chosen for further investigation in this study. Previously different molecules, such as netropsin, pentamidine, distamycin, and Hoechst 33258, have been reported to bind DNA through the minor groove of duplex DNA.25 The fluorescence of Hoechst is greatly enhanced by the dye interaction with the A–T pairs in the supercoiled DNA. These results indicated that the Hoechst MNPs could label DNA and emit strong fluorescence. The evaluation of Hoechst MNPs for DNA localization and nucleus labeling is presented in the next section.
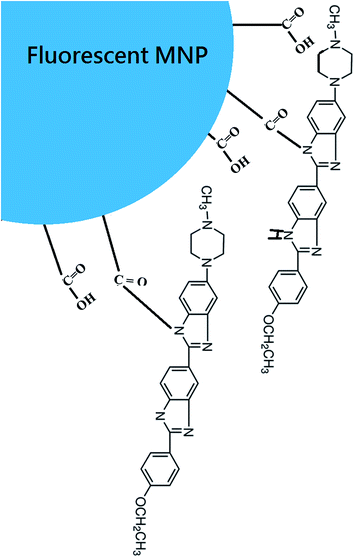 |
| | Fig. 2 The proposed linkage between MNP and Hoechst dye. | |
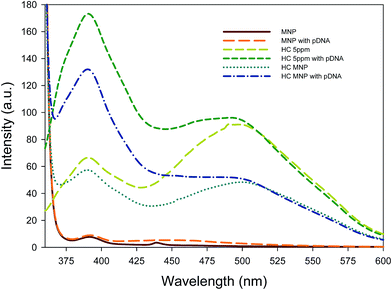 |
| | Fig. 3 Fluorescence emission spectra of bare MNPs, Hoechst (HC) MNPs synthesized at different pH conditions, and Hoechst dye in the absence or presence of plasmid DNA. The wavelength of 340 nm was chosen for the excitation of fluorescent nanoparticles over the range of emission wavelengths (360–600 nm). Plasmid DNA (556 ng μL−1, 10 μL) was mixed with Hoechst dye and Hoechst MNPs (1 mg mL−1, 10 μL) for the measurement of fluorescence emission spectra. | |
Cell labeling ability and biocompatibility of Hoechst MNPs
HEK293T and SIRC were chosen as the models to investigate the ability of Hoechst MNPs for nucleus staining. The binding affinity of Hoechst MNPs to DNA depends on its chemical structure and the target DNA sequence. A noticeable shortage is that this free dye is quickly pumped out of cells, and therefore the staining is maintained for relatively short time.26 HEK293T and SIRC cells were incubated with free HC, MNPs, and Hoechst MNPs at different lengths of time to investigate the uptake rate of fluorescence nanoparticles by cells. The resulting mean fluorescence intensity was measured by the IN Cell Analyzer. Fig. 4 shows the mean fluorescence intensity at 1, 30, and 60 min of incubation. The Hoechst MNPs could stain the cells in a time-dependent manner similar to the free dye. By contrast, the bare MNPs could not generate fluorescence within the cells. The fluorescence of Hoechst MNPs and free Hoechst within the cells could be observed as quickly as 1 min. HEK293T swallowed more Hoechst MNPs than did the SIRC cells as the mean fluorescence intensity was higher. However, modification of the dye on MNPs would slow down the dye's diffusion in the cellular cytosol compared with the free Hoechst dye.
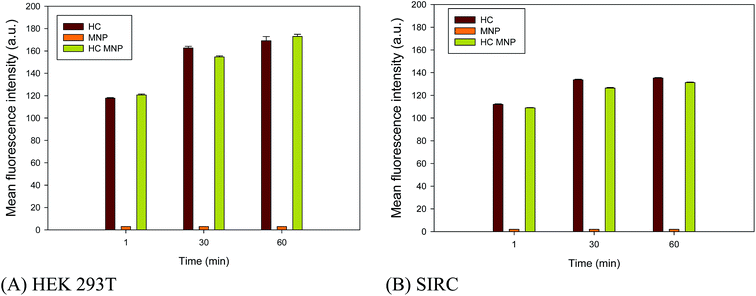 |
| | Fig. 4 Fluorescence intensity of HEK 293T cell line (A) and SIRC cell line (B) after HC, MNPs and Hoechst MNPs treatment for different time. The result was an average of triplicate measurements. Error bar represented the standard deviation. | |
To clarify the staining ability of the Hoechst MNPs in the cells, we measured the cell images using the IN Cell Analyzer. Cells were counterstained with acridine solution, which is a cytosol stain. The fluorescence from acridine produced a bright green one and that from Hoechst MNPs produced blue as shown in Fig. 5. We observed that the emission of Hoechst MNPs was clearly located inside the nucleus. Thus, binding fluorescent dyes onto MNPs enabled their direct fluorescent labeling of the cells. The fluorescent nanoparticles showed spontaneous blue fluorescence and exhibited distinct distributions in cells. We observed fluorescent nucleus stained with Hoechst MNPs (Fig. 5). No uptake was observed into the endoplasmic reticulum, structures of the Golgi body, or other parts of cells. Several studies have prepared fluorescent nanoparticles for the cell labeling purpose.11 However, the detailed mechanism by which cells readily take up Hoechst MNPs remains unclear. Although Hoechst dye is a safe DNA stain with minimal effects on cell viability,27 cellular toxicity has been reported at high concentrations.28 To evaluate the biocompatibility effect of MNPs, free Hoechst dye and Hoechst MNPs on HEK293T and SIRC cells at different doses were tested (Fig. 6A and B). For the ultimate use of the Hoechst MNPs as cell labeling, these MNPs should retain their low toxicity. As shown in Fig. 6, both Hoechst MNPs and bare MNPs showed good biocompatibility and maintained the viability around 95%. HEK293T and SIRC cells could maintain 90% viability using 160 μg mL−1 Hoechst MNPs. The free Hoechst dye caused a significant reduction in cell viability when tested at a concentration of 12.5 μg mL−1 and induced further death at higher concentrations. At a high concentration of 160 μg mL−1 Hoechst MNPs, the viable cells were still more than 90% for SIRC cells and 100% for HEK293T cells after a 24 h treatment. These results indicated that Hoechst MNPs were highly biocompatible and safe for in vitro staining. To understand the mechanism of nucleus labeling by Hoechst MNPs, the effects of salt and contact time on the adsorption isotherms of ssDNA and plasmid DNA were investigated in the following section.
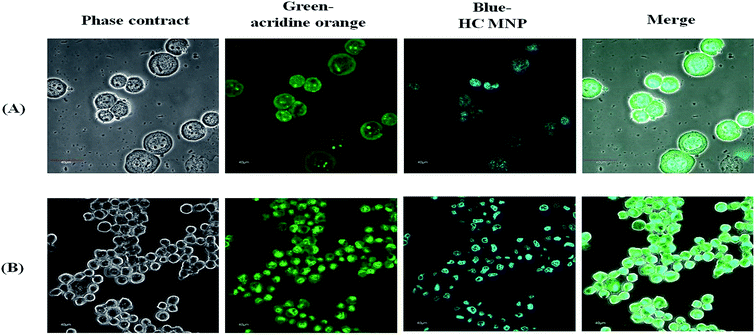 |
| | Fig. 5 Fluorescence and phase contract images of HEK 293T (A) and SIRC (B) after Hoechst MNPs treatment for 1 minute. Acridine orange is stained by green (ex: 502 nm, em: 526 nm) and HC by blue (ex: 352 nm, em: 455 nm). The scale bar in the photos represents 40 μm. | |
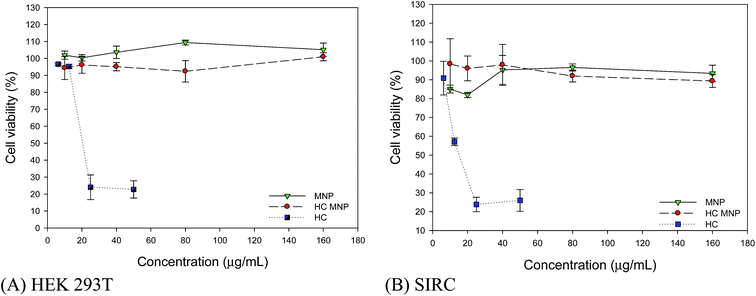 |
| | Fig. 6 Biocompatibility of MNPs in HEK 293T cell line (A) and SIRC cell line (B). DMEM medium (0.2 mL) containing 20 μg of MNPs, Hoechst MNPs and HC was added to the 48-well plate at 37 °C for 24 h and the cells were washed with 0.2 mL PBS, fixed by 0.15 mL of 4% formaldehyde and analyzed by IN Cell Analyzer. The result was an average of triplicate measurements. Error bar represented the standard deviation. | |
Plasmid and ssDNA adsorption behaviors
The chromosome staining of Hoechst MNPs in mammalian cells was discussed using the Langmuir and Freundlich models. Adsorption isotherms determine the maximal amount of adsorbed DNA and the dissociation constant at a fixed adsorbent and time, and they provide insights into the adsorption mechanism. In this experiment, the adsorption of plasmid dsDNA and ssDNA was carried out in the presence of monovalent and divalent salts. The Langmuir and Freundlich models are commonly used to study the adsorption phenomenon. The ionic effect determines the adsorption capacities, with higher salt concentrations resulting in more DNA adsorption.29 We studied the adsorption capacity of Hoechst MNPs as a function of cation species on dsDNA and ssDNA. Fig. 7A and B showed the isotherms of adsorbed ssDNA and pDNA onto Hoechst MNPs with the help of 0.5 M NaCl concentration. As shown in Fig. 7, more ssDNA (182 μg mg−1) was adsorbed on the Hoechst MNPs compared with that (127 μg mg−1) of the bare MNPs in presence of NaCl. With the help of CaCl2, Hoechst MNPs adsorbed 1034 μg mg−1 ssDNA (Fig. 8). In presence of NaCl, the adsorption capacities of Hoechst MNPs were 181.7 and 132.1 μg mg−1 for ssDNA and dsDNA, respectively (Table 1). Divalent CaCl2 was a stronger enhancer than monovalent NaCl for both bare and Hoechst MNPs. The adsorption efficiency of Hoechst MNPs was higher than that of bare MNPs. The adsorption capacity was dependent on DNA type and molecular weight. The adsorption trend showed that ssDNA could adsorb more than pDNA on Hoechst MNPs because of the less steric hindrance of ssDNA. The adsorption capacity of MNPs and Hoechst MNPs increased with the increase in DNA loading. The Langmuir and Freundlich models were adapted to predict the adsorption phenomenon using the MNPs and DNA. In all cases, the calculated R2 value was found to be >0.95, which indicates that both Langmuir and Freundlich isotherms fitted well in all cases. However, the assumptions of the two isotherms are different. The Langmuir isotherm model is based on the assumption of maximum adsorption to a monolayer of adsorbate molecules over a homogeneous adsorbent surface with a constant energy. By contrast, the Freundlich isotherm model assumes that the adsorbent has a heterogeneous surface.30 NaCl and CaCl2 are the essential salts in the cells that maintain the cells' physiological functions. The large adsorption capacities of Hoechst MNPs in presence of CaCl2 (Fig. 8) can explain its nucleus targeting ability under the cellular condition (NaCl 0.5 M).
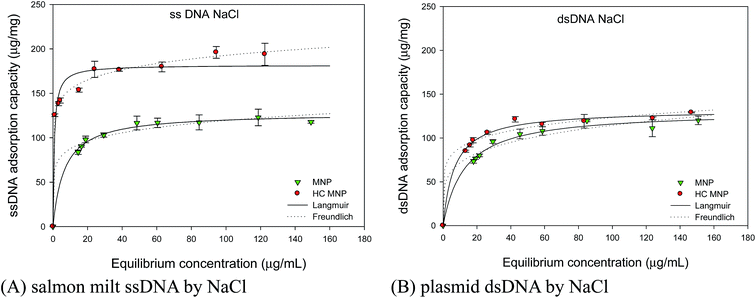 |
| | Fig. 7 Effect of sodium chloride on the adsorption isotherm of salmon milt ssDNA (A) and plasmid dsDNA (B). The adsorption of plasmid DNA is performed by mixing various amount of DNA (10 μL), Hoechst MNPs (1000 μg mL−1, 10 μL), and salts (0.5 M, 10 μL). The stock concentration of plasmid dsDNA and salmon milt ssDNA are 550 and 1000 ng μL−1, respectively. The lines are simulated by using the parameters of Langmuir and Freundlich models. The solid and dash lines are respectively simulated by using the parameters of Langmuir and Freundlich model in Table 1. The error bar represented the standard deviation determined in triplicate experiments. | |
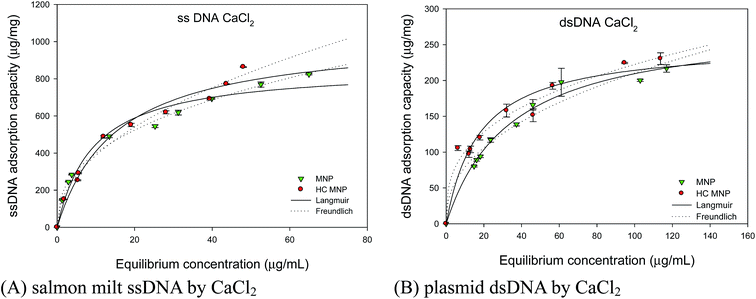 |
| | Fig. 8 Effect of calcium chloride on the adsorption isotherm of salmon milt ssDNA (A) and plasmid dsDNA (B). The adsorption of plasmid DNA is performed by mixing various amount of DNA (10 μL), Hoechst MNPs (1000 μg mL−1, 10 μL), and salts (0.5 M, 10 μL). The stock concentration of plasmid dsDNA and salmon milt ssDNA are 550 and 1000 ng μL−1, respectively. The lines are simulated by using the parameters of Langmuir and Freundlich models. The solid and dash lines are respectively simulated by using the parameters of Langmuir and Freundlich models in Table 1. The error bar represented the standard deviation determined in triplicate experiments. | |
Table 1 Effect of cation sources on adsorption isotherms of plasmid dsDNA and salmon milt ssDNA
| |
Parameters |
MNP |
HC MNP |
| NaCl |
CaCl2 |
NaCl |
CaCl2 |
| ssDNA |
| Langmuir |
R2 |
0.994 |
0.971 |
0.956 |
0.979 |
| KL |
6.71 |
9.36 |
0.74 |
15.29 |
| qm |
127.9 |
863.3 |
181.8 |
1033.8 |
| Freundlich |
R2 |
0.979 |
0.995 |
0.994 |
0.984 |
| KF |
64.1 |
161.5 |
123.5 |
128.8 |
| n |
0.13 |
0.39 |
0.10 |
0.48 |
![[thin space (1/6-em)]](https://www.rsc.org/images/entities/char_2009.gif) |
| pDNA |
| Langmuir |
R2 |
0.988 |
0.987 |
0.992 |
0.932 |
| KL |
12.9 |
34.5 |
6.8 |
17.7 |
| qm |
130.8 |
281.7 |
132.1 |
252.0 |
| Freundlich |
R2 |
0.967 |
0.964 |
0.980 |
0.974 |
| KF |
44.7 |
29.8 |
64.1 |
45.8 |
| n |
0.20 |
0.43 |
0.14 |
0.34 |
From the results in Table 1 and Fig. 8, CaCl2 efficiently increased the adsorption capacities for both bare and Hoechst MNPs than did NaCl. This enhancement is due to the following reasons. Charge screening efficiency depends on the nature of the ions that allow the DNA molecule to approach the surface close enough for adsorption by van der Waals forces at a close distance from the surface. The DNA adsorption rates and attachment efficiencies in NaCl solutions were much lower than those in CaCl2 solutions.31 CaCl2 forms “inner-sphere” complexes with both pDNA and COOH-groups of MNPs, and then bridges between the MNPs and the pDNA are formed.32 NaCl forms weaker “outer-sphere” complexes with the phosphate backbone and the MNPs. Therefore, the adsorption capacities of MNPs in the presence of CaCl2 were larger than those in the presence of NaCl. Divalent ions bind to DNA stronger than monovalent ions during the adsorption of DNA on inorganic materials.33 Indeed, the increasing adsorption efficiency of Hoechst MNPs is mainly due to the coating of HC on MNPs that further improves the DNA binding ability of modified Hoechst MNPs. The higher adsorption of ssDNA on Hoechst MNPs is attributed to its small size (0.3–0.5 kb), which is much smaller than that of dsDNA (4.7 kb). DNA size has an intense effect on its adsorption as size may affect the conformational restriction and ability to find available binding sites on surfaces.34,35 Electrostatic binding normally appears in cationic molecules that are not capable to bind to the internal pockets of DNA. Therefore, our modified Hoechst MNPs interact with DNA along the exterior of the helix, and the complex is dominated by coulomb interactions between cationic species and the positively charged phosphate backbone.36 Furthermore, Hoechst binds to the outside of the DNA helix by interacting with the A–T base pairs by deeply penetrating into its minor groove. The adsorption of DNA by Hoechst MNPs in an alkaline condition and in the presence of ions is stabilized by electrostatic van der Waals forces and hydrogen-bonding interactions between the Hoechst MNPs and DNA groups in the minor groove walls.37
Kinetics of pDNA and ssDNA adsorption
We further explored the adsorption kinetics of the Hoechst MNPs to explain its fast staining in 1 min. The pseudo-first-order and pseudo-second-order kinetic models are commonly applied to study the kinetics of the adsorption process.38 In the 0.5 M CaCl2 solution, the adsorption rates for pDNA and ssDNA were higher than those in 0.5 M NaCl. Divalent cations, such as CaCl2, can bind to the phosphate backbone and neutralize its negative charges. Therefore, the electrostatic repulsion between the DNA molecules and the MNP surface was considerably reduced, thus resulting in an increase in adsorption rate. The adsorption kinetics under the two salts conditions (0.5 M NaCl and 0.5 M CaCl2) was rapid and reached equilibrium within 10 min. The kinetics parameters are summarized in Table 2. The correlation coefficient for the pseudo-first-order kinetic model was <0.96, which indicates a poor pseudo-first-order fit to the experimental data. Fig. 9A–D show the adsorption kinetics curve for ssDNA and pDNA in the presence of NaCl and CaCl2. The binding amount increased rapidly in the first 5 min and plateaued from 5 to 30 min for both ssDNA and pDNA. In the study, 30 min was selected as the time to stop the binding reaction between Hoechst MNPs and DNA. The value of the pseudo-second order rate constant, k2, in presence of CaCl2 for ssDNA adsorption using Hoechst MNPs was obtained as 0.0086 (μg mg−1 min−1)−1, and the equilibrium adsorption capacity was obtained as 241.77 μg mg−1. The value of the rate constant, k2, in the presence of CaCl2 for pDNA adsorption using Hoechst MNPs was obtained as 0.0066 μg mg−1 min−1, and the equilibrium adsorption capacity was obtained as 171.34 μg mg−1. The linear correlation coefficient value (R2) was found to be the best at 0.99. The results in Fig. 9 indicate that the adsorption process obeyed the pseudo-second-order kinetic model. The pseudo-second-order kinetic model shows the adsorption of the pDNA and ssDNA, followed by chemisorption mechanism through electrostatic attraction. The adsorption of DNA by the developed MNP was a fast process that could reach equilibrium within 10 min. The adsorptive process using MNPs may be performed in a well-mixed system instead of a conventional packed bed as the nanoscale size of the nanoparticles results in high-pressure drops in the column. Conventional resins have diameters in the range of sub-micron to micron and large internal porosities to ensure adequate surface area for adsorption. The diffusion limitation in porous resins leads to the decrease in the adsorption efficacy and available capacity for the target compound.39 Compared with conventional processes, the advantages of MNP separation may be attributed to its speed, accuracy, stability, and simplicity. Additionally, they can be easily recovered and regenerated even in the presence of colloidal contaminants. In this study, the developed Hoechst MNPs with a high capacity and small diffusion resistance to the adsorption of biomolecules can be useful. When the rate-determining step is the mass transport to the adsorption sites, the kinetics of the process can be described on the basis of the diffusion equation.40 However, the nanoscale of MNPs can provide better diffusion and movement in the solution. Previously, the adsorption of strontium ions in these zwitterionic hybrid membranes fit well with the pseudo-second-order model. Its mechanism related to diffusion–chemisorption was one of the main adsorption mechanisms.40 The adsorption of the dsDNA and ssDNA followed the pseudo-second-order model (Tables 2 and 3). Nevertheless, the detailed mechanism using the Hoechst MNPs on nucleus staining merits further investigation.
Table 2 Kinetic parameters for salmon milt DNA adsorption by using MNPs and Hoechst MNPs with the help of NaCl and CaCl2
| ssDNA |
Parameters |
MNP |
HC MNP |
| NaCl |
CaCl2 |
NaCl |
CaCl2 |
| Pseudo first order equation |
R2 |
0.986 |
0.970 |
0.941 |
0.971 |
| qe |
105.50 |
210.71 |
164.42 |
227.26 |
| K1 |
0.33 |
0.90 |
0.34 |
1.29 |
| Pseudo second order equation |
R2 |
0.990 |
0.993 |
0.984 |
0.991 |
| qe |
119.88 |
229.03 |
183.95 |
241.77 |
| K2 |
0.0036 |
0.0057 |
0.0027 |
0.0086 |
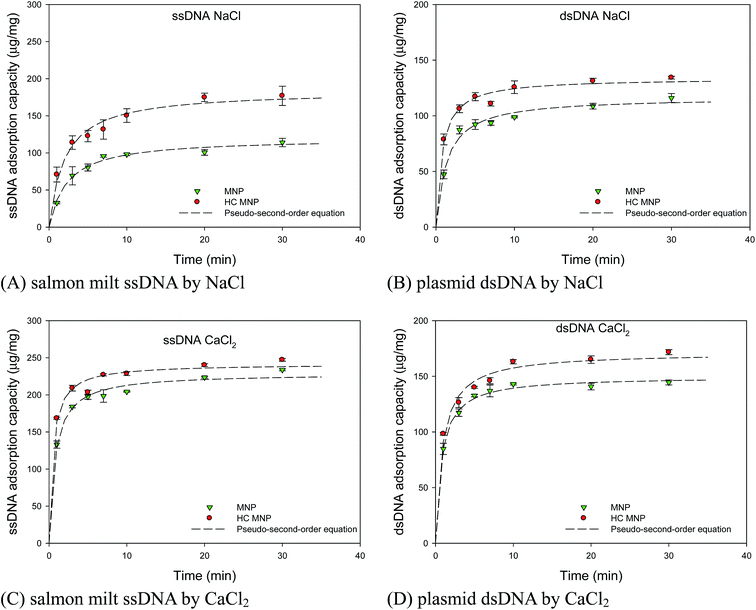 |
| | Fig. 9 Effect of cation sources on adsorption kinetics of salmon milt ssDNA and plasmid dsDNA by using NaCl (A and B) and CaCl2 (C and D). The adsorption of plasmid DNA is performed by mixing various amount of DNA (10 μL), Hoechst MNPs (1000 μg mL−1, 10 μL), and salts (0.5 M, 10 μL). The stock concentration of plasmid dsDNA and salmon milt ssDNA are 550 and 1000 ng μL−1, respectively. The lines are simulated by using the parameters of pseudo-second-order model in Table 2. The error bar represented the standard deviation determined in triplicate experiments. | |
Table 3 Kinetic parameters for plasmid DNA adsorption using MNPs and Hoechst MNPs with the help of NaCl and CaCl2
| pDNA |
Parameters |
MNP |
HC MNP |
| NaCl |
CaCl2 |
NaCl |
CaCl2 |
| Pseudo first order equation |
R2 |
0.971 |
0.988 |
0.966 |
0.954 |
| qe |
104.50 |
139.03 |
123.18 |
156.63 |
| K1 |
0.55 |
0.83 |
0.91 |
0.79 |
| Pseudo second order equation |
R2 |
0.990 |
0.997 |
0.991 |
0.990 |
| qe |
116.72 |
149.79 |
133.76 |
171.34 |
| K2 |
0.0064 |
0.0088 |
0.0099 |
0.0066 |
Conclusions
We developed the facile synthesis of fluorescent MNPs using carbodiimide as a cross-linking reagent to conjugate the Hoechst dye. The Hoechst MNPs showed specific targeting to pDNA and excellent fluorescence emission. Biocompatibility assay revealed that the Hoechst MNPs were low toxic and suitable for biomedical application. The targeting phenomenon of the developed MNPs to chromosome DNA could be explained by the strong association constant predicted by the Langmuir isotherm. Furthermore, the adsorption of both ssDNA and pDNA on the Hoechst MNPs obeyed the pseudo-second-order kinetic model. Cellular imaging assay of the nanoparticles in two mammalian cells showed their excellent ability of cell penetration and chromosome imaging. The fluorescent nanoparticles displayed a strong blue emission and superparamagnetic behaviors. Such advantages as fluorescence and specific DNA adsorption made the Hoechst MNPs promising for fluorescent labeling and DNA separation.
Conflict of interest
The authors would like to declare that no potential conflicts of interest exist.
Acknowledgements
We express gratitude to Ministry of Science and Technology (MOST 105-2221-E-182-070), Chang Gung University (BMRP 758) and Chang Gung Memorial Hospital (CMRPD 1E0351) for funding and supporting this research.
References
- L. H. Fornander, L. Wu, M. Billeter, P. Lincoln and B. Nordén, J. Phys. Chem. B, 2013, 117, 5820–5830 CrossRef CAS PubMed.
- A. Y. Chen, C. Yu, B. Gatto and L. F. Liu, Proc. Natl. Acad. Sci. U. S. A., 1993, 90, 8131–8135 CrossRef CAS.
- M. Sun, B. Sun, Y. Liu, Q. D. Shen and S. Jiang, Sci. Rep., 2016, 6, 22368 CrossRef CAS PubMed.
- W. Xu, J. Y. Park, K. Kattel, M. W. Ahmad, B. A. Bony, W. C. Heo, S. Jin, J. W. Park, Y. Chang, T. J. Kim, J. A. Park, J. Y. Do, K. S. Chae and G. H. Lee, RSC Adv., 2012, 2, 10907–10915 RSC.
- G. Wang and X. Su, Analyst, 2011, 136, 1783–1798 RSC.
- L. E. Samuelson, B. M. Anderson, M. Bai, M. J. Dukes, C. R. Hunt, J. D. Casey, Z. Han, V. Papadopoulos and D. J. Bornhop, RSC Adv., 2014, 4, 9003–9011 RSC.
- G. Fu, W. Liu, Y. Li, Y. Jin, L. Jiang, X. Liang, S. Feng and Z. Dai, Bioconjugate Chem., 2014, 25, 1655–1663 CrossRef CAS PubMed.
- Z. Bakhtiary, A. A. Saei, M. J. Hajipour, M. Raoufi, O. Vermesh and M. Mahmoudi, Nanomedicine, 2016, 12, 287–307 CAS.
- S. H. Huang and R. S. Juang, J. Nanopart. Res., 2011, 13, 4411–4430 CrossRef.
- G. Kandasamy and D. Maity, Int. J. Pharm., 2015, 496, 191–218 CrossRef CAS PubMed.
- C. Kaewsaneha, P. Tangboriboonrat, D. Polpanich and A. Elaissari, ACS Appl. Mater. Interfaces, 2015, 7, 23373–23386 CAS.
- J. Yao, M. Yang and Y. Duan, Chem. Rev., 2014, 114, 6130–6178 CrossRef CAS PubMed.
- Y. Li, C. Dong, J. Chu, J. Qi and X. Li, Nanoscale, 2011, 3, 280–287 RSC.
- W. Zhang, Y. Zhang, X. Shi, C. Liang and Y. Xian, J. Mater. Chem., 2011, 21, 16177–16183 RSC.
- Y. Lu, Y. Zheng, S. You, F. Wang, Z. Gao, J. Shen, W. Yang and M. Yin, ACS Appl. Mater. Interfaces, 2015, 7, 5226–5232 CAS.
- J. Liu, W. He, L. Zhang, Z. Zhang, J. Zhu, L. Yuan, H. Chen, Z. Cheng and X. Zhu, Langmuir, 2011, 27, 12684–12692 CrossRef CAS PubMed.
- D. Wang, J. He, N. Rosenzweig and Z. Rosenzweig, Nano Lett., 2004, 4, 409–413 CrossRef CAS.
- C. H. Liu, S. L. Sahoo and M. H. Tsao, Colloids Surf., B, 2014, 115, 150–156 CrossRef CAS PubMed.
- A. Nakamura, K. Takigawa, Y. Kurishita, K. Kuwata, M. Ishida, Y. Shimoda, I. Hamachi and S. Tsukiji, Chem. Commun., 2014, 50, 6149–6152 RSC.
- M. Bloemen, C. Denis, M. Peeters, L. De Meester, A. Gils, N. Geukens and T. Verbiest, Microchim. Acta, 2015, 182, 1439–1446 CrossRef CAS.
- G. T. Hermanson, in Bioconjugate Techniques, Academic Press, New York, Second edn, 2008, pp. 969–1002 Search PubMed.
- F. S. Chu, F. C. Chang and R. D. Hinsdill, Appl. Environ. Microbiol., 1976, 31, 831–835 CAS.
- P. Pandya, M. M. Islam, G. S. Kumar, B. Jayaram and S. Kumar, J. Chem. Sci., 2010, 122, 247–257 CrossRef CAS.
- R. Bilan, F. Fleury, I. Nabiev and A. Sukhanova, Bioconjugate Chem., 2015, 26, 609–624 CrossRef CAS PubMed.
- M. Mrksich and P. B. Dervan, J. Am. Chem. Soc., 1993, 115, 2572–2576 CrossRef CAS.
- C. W. Scharenberg, M. A. Harkey and B. Torok-Storb, Blood, 2002, 99, 507–512 CrossRef CAS PubMed.
- R. E. Durand and P. L. Olive, J. Histochem. Cytochem., 1982, 30, 111–116 CrossRef CAS PubMed.
- D. W. Siemann and P. C. Keng, Cancer Res., 1986, 46, 3556–3559 CAS.
- X. Li, J. Zhang and H. Gu, Langmuir, 2012, 28, 2827–2834 CrossRef CAS PubMed.
- I. X. Garcia-Zubiri, G. Gonzalez-Gaitano and J. R. Isasi, J. Colloid Interface Sci., 2009, 337, 11–18 CrossRef CAS PubMed.
- T. H. Nguyen and M. Elimelech, Biomacromolecules, 2006, 8, 24–32 CrossRef PubMed.
- J. D. Knight and R. C. Adami, Int. J. Pharm., 2003, 264, 15–24 CrossRef CAS PubMed.
- S. M. Solberg and C. C. Landry, J. Phys. Chem. B, 2006, 110, 15261–15268 CrossRef CAS PubMed.
- H. G. Martinson, Biochemistry, 1973, 12, 2737–2746 CrossRef CAS PubMed.
- A. Silberbebg, J. Phys. Chem., 1962, 66, 1884–1907 CrossRef.
- M. Ghaemi and G. Absalan, Microchim. Acta, 2014, 181, 45–53 CrossRef CAS.
- S. M. Nelson, L. R. Ferguson and W. A. Denny, Mutat. Res., Fundam. Mol. Mech. Mutagen., 2007, 623, 24–40 CrossRef CAS PubMed.
- Y. Liu, Colloids Surf., A, 2008, 320, 275–278 CrossRef CAS.
- D. H. Chen and S. H. Huang, Process Biochem., 2004, 39, 2207–2211 CrossRef CAS.
- Y. Miyake, H. Ishida, S. Tanaka and S. D. Kolev, Chem. Eng. J., 2013, 218, 350–357 CrossRef CAS.
Footnote |
| † Electronic supplementary information (ESI) available. See DOI: 10.1039/c6ra25610d |
|
| This journal is © The Royal Society of Chemistry 2017 |
Click here to see how this site uses Cookies. View our privacy policy here.  Open Access Article

![[thin space (1/6-em)]](https://www.rsc.org/images/entities/char_2009.gif)


