 Open Access Article
Creative Commons Attribution 3.0 Unported Licence
Zn–Fe–O@C hollow microspheres as a high performance anode material for lithium-ion batteries
Jiayue Zhaoa,
Junming Sub,
Siyang Liua,
Xiang Chenb,
Tao Huangb and
Aishui Yu*a
aDepartment of Chemistry, Collaborative Innovation Center of Chemistry for Energy Materials, Shanghai Key Laboratory of Molecular Catalysis and Innovative Materials, Institute of New Energy, Fudan University, Shanghai 200438, China. E-mail: asyu@fudan.edu.cn; Fax: +86-21-51630320; Tel: +86-21-51630320
bLaboratory of Advanced Materials, Fudan University, Shanghai 200438, China
First published on 17th January 2017
Abstract
In this study, Zn–Fe–O@C hollow microspheres are prepared by chemical vapor deposition (CVD) method with ZnFe2O4 hollow microspheres as precursors which are synthesized via a facile solvothermal method. ZnFe2O4 hollow microspheres and Zn–Fe–O@C hollow microspheres are characterized by X-ray diffraction, Raman spectroscopy, scanning electron microscopy and transmission electron microscopy. The physical analysis shows a fraction of Fe(III) reduced to Fe(II) and the hollow microspheres maintained during the CVD process. Zn–Fe–O@C hollow microspheres can deliver a reversible specific capacity of 1035.6 mA h g−1 after 50 cycles at a current density of 100 mA g−1, and maintain a stable capacity as high as 1000 mA h g−1 at 500 mA g−1 after 200 cycles. Compared with ZnFe2O4 hollow microspheres, Zn–Fe–O@C hollow microspheres present excellent rate performance. The better electrochemical performances of the Zn–Fe–O@C hollow microspheres should be ascribed to the carbon coating, which can elevate electrical conductivity and improve the structural stability of the active materials.
1. Introduction
Currently, graphite has been widely invoked as a commercial anode material for lithium-ion batteries (LIBs).1,2 However, the graphite has a few disadvantages, such as the relatively low theoretical specific capacity (372 mA h g−1) and potential safety concerns.3 Binary transition metal oxides have shown their significantly higher capacities in LIBs, which are several times higher than that of graphite, and better safety characteristics. Moreover, a suitable combination of different metal oxides can be selected to overcome the weaknesses of simple transition metal oxides. Recently, zinc ferrite (ZnFe2O4) has caught significant attention for its high theoretical specific capacity (1072 mA h g−1), high natural abundance, low toxicity and environmental friendliness.4,5 As firstly reported by NuLi et al. in 2004, they synthesized ZnFe2O4 thin-film by a pulsed laser deposition method and the ZnFe2O4 thin-film showed immense potential for development as an anode material.6 Unfortunately, ZnFe2O4 suffers from low electrical conductivity and tremendous volume change during the cycling process, leading to poor rate performance and fast capacity fading, which impede its application in high-energy LIBs.Strategies have been proposed to resolve the above mentioned drawbacks. One widely adopted approach is to fabricate nanocomposites with decreased size or optimized morphologies and structures. Because making the ZnFe2O4 materials with nanoscale size, such as ZnFe2O4 nano-octahedrons,7 ZnFe2O4 nanorods,8 ZnFe2O4 nanofibers9 can increase the contact between active materials and electrode, facilitate the transportation of both electrons and Li+ by shortening the diffusion path of them and mitigate the volume change during the charge/discharge processes.10,11 To further better electrochemical performances of ZnFe2O4 materials, surface modification with high electronic conductivity materials can efficiently enhance the electron conductivity of the composites and suppress volume expansion during cycling.12,13 Various electronic conductivity materials have been investigated, such as graphene,14 porous carbon,15 carbon nanotubes16 and so on. To our best knowledge, it is rarely reported that ZnFe2O4 materials with optimized structure is coated with a uniform carbon layer by chemical vapor deposition (CVD) method.
Herein, ZnFe2O4 hollow microspheres were prepared by a one-pot solvothermal procedure and followed by thermal annealing without template. Zn–Fe–O@C hollow microspheres were synthesized by chemical vapor deposition (CVD) method, which could coat a uniform carbon layer. Zn–Fe–O@C hollow microspheres exhibited the well-optimized structure and excellent electrochemical performances.
2. Experimental sections
2.1 Synthesis of ZnFe2O4 hollow microspheres and Zn–Fe–O@C hollow microspheres
Zn(CH3COO)2·2H2O (3 mmol), Fe(NO3)3·9H2O (6 mmol) and urea(10 mmol) were dissolved in 40 ml of ethylene glycol by magnetic stirring at room temperature and then the solution was transferred into a Teflon-lined autoclave with a capacity about 50 ml. After heat treated the autoclave at 200 °C for 24 h, it was cooled down to room temperature at an electric oven. The deposit was washed with ethanol for three times, and dried at 80 °C in vacuum for 10 h. Finally, the as-prepared precursors were calcined at 600 °C for 4 h in air. The obtained composite were ZnFe2O4.Carbon coated Zn–Fe–O hollow microspheres were synthesized by a chemical vapor deposition (CVD) method. ZnFe2O4 hollow microspheres (400 mg) were placed at a corundum boat which was at the center of a quartz tube furnace. The Ar gas mixture passed through toluene and was introduced into the furnace. Then, the temperature was increased at a rate of 10 °C min−1 from room temperature to 800 °C and maintained for 5 min. Last, the cooling rate was 5 °C min−1.
2.2 Characterization
XRD patterns were obtained using a Bruker D8 Advance X-ray diffractometer at 40 kV and 40 mA with a Cu Kα radiation (λ = 1.5418 Å). Raman spectroscopy was performed using a Dior LABRAM-1B spectrometer with a 633 nm incident laser light. The content of carbon was characterized by vario EL Elemental Analyzer (Analysensysteme GmbH). TEM images and the high resolution images were recorded using a high resolution transmission electron microscope (HRTEM, JEOL 2011). Particle morphology was examined by a field-emission scanning electron microscope (FESEM, JEOL JSM-6390).2.3 Electrochemical measurements
The electrochemical performances were studied using CR2016 coin cells. The coin cells were assembled in an argon-filled glove box. The working electrodes consisted of the active materials (70 wt%), Super P carbon black (20 wt%) and sodium alginate (10 wt%). Cu foil was used as the current collector. Then the coated electrodes were dried in vacuum at 80 °C for 12 h. Typical mass loading of active material is 2.0 ± 0.2 mg cm−2. The electrolyte was 1 M LiPF6 solution in a mixture of ethylene carbonate, dimethyl carbonate, and diethylene carbonate (EC![[thin space (1/6-em)]](https://www.rsc.org/images/entities/char_2009.gif) :
:![[thin space (1/6-em)]](https://www.rsc.org/images/entities/char_2009.gif) DMC
DMC![[thin space (1/6-em)]](https://www.rsc.org/images/entities/char_2009.gif) :
:![[thin space (1/6-em)]](https://www.rsc.org/images/entities/char_2009.gif) DEC = 1
DEC = 1![[thin space (1/6-em)]](https://www.rsc.org/images/entities/char_2009.gif) :
:![[thin space (1/6-em)]](https://www.rsc.org/images/entities/char_2009.gif) 1
1![[thin space (1/6-em)]](https://www.rsc.org/images/entities/char_2009.gif) :
:![[thin space (1/6-em)]](https://www.rsc.org/images/entities/char_2009.gif) 1, v/v/v), and the separator was a polypropylene micro-porous film (Cell-gard 2300). The open-circuit voltage (OCV) of the as-prepared coin cells is 2.90 ± 0.05 V as the standard OCV of the 2025-type coin cells. The galvanostatic charge–discharge tests were at room temperature between 0.01 V and 3.0 V versus Li/Li+ on LAND CT2001A test system. The cyclic voltammetry (CV) profiles were performed on CH Instrument 660A electrochemical workstation. Electrochemical impedance spectroscopy (EIS) measurements were recorded by Zahner IM6e electrochemical workstation.
1, v/v/v), and the separator was a polypropylene micro-porous film (Cell-gard 2300). The open-circuit voltage (OCV) of the as-prepared coin cells is 2.90 ± 0.05 V as the standard OCV of the 2025-type coin cells. The galvanostatic charge–discharge tests were at room temperature between 0.01 V and 3.0 V versus Li/Li+ on LAND CT2001A test system. The cyclic voltammetry (CV) profiles were performed on CH Instrument 660A electrochemical workstation. Electrochemical impedance spectroscopy (EIS) measurements were recorded by Zahner IM6e electrochemical workstation.
3. Results and discussion
Fig. 1a shows the XRD pattern of ZnFe2O4 hollow microspheres. All diffraction peaks of ZnFe2O4 hollow microspheres can be indexed to cubic ZnFe2O4 (PDF#22-1012), and no other peaks assigned to ZnO and Fe2O3 can be observed. The narrow peak width and strong intensity illustrate the good crystallinity of ZnFe2O4 hollow microspheres. While for Zn–Fe–O@C hollow microspheres (Fig. 1b), the peaks of zinc oxide and iron oxides can be observed. In the CVD process, toluene gas liquefied firstly and the toluene seeped into ZnFe2O4 hollow microspheres. At high temperature, the toluene decomposed quickly and carbon was deposited on ZnFe2O4 hollow microspheres,17 accompanied with the reduction of partial Fe(III) and the decomposition of ZnFe2O4. To confirm the form of carbon, Raman spectrum was recorded. The Raman spectrum of Zn–Fe–O@C hollow microspheres in Fig. 1c shows the D and G characteristic peaks of graphite. The graphite content in Zn–Fe–O@C hollow microspheres is estimated to be 4.17 wt% according to CHN elemental analysis, as shown in Table 1. | ||
| Fig. 1 The XRD pattern of (a) ZnFe2O4 hollow microspheres and (b) Zn–Fe–O@C hollow microspheres; (c) Raman spectra of Zn–Fe–O@C hollow microspheres. | ||
| Wght [mg] | C/N ratio | Content [%] | Peak area |
|---|---|---|---|
| 5.5990 | 350.1 | N: 0.012 | 15 |
| C: 4.169 | 6195 | ||
| H: 0.118 | 446 |
The morphology of ZnFe2O4 hollow microspheres and Zn–Fe–O@C hollow microspheres was characterized by SEM and TEM. Fig. 2a and Fig. 2b show that ZnFe2O4 are composed of a number of microspheres with a diameter of 200 nm. In addition, ZnFe2O4 microsphere is a hierarchical structure accumulated by nanoparticles with their sizes in the range of 20–40 nm. As shown in Fig. 2c, ZnFe2O4 microsphere is hollow and its diameter is about 200 nm, well consistent with the SEM result. From HRTEM image of ZnFe2O4 hollow microspheres in Fig. 2d, the d-spacing of the lattice planes is measured at 0.254 nm, which correspond with the 311 crystal planes of ZnFe2O4 in a face-centered cubic phase. Fig. 3a–c indicates that the morphology of ZnFe2O4 hollow microspheres do not change after CVD carbon coating. The magnified image of Zn–Fe–O@C hollow microspheres in Fig. 3d clearly indicates that the hollow microspheres are homogeneously coated a 2–3 nm uniform carbon layer.
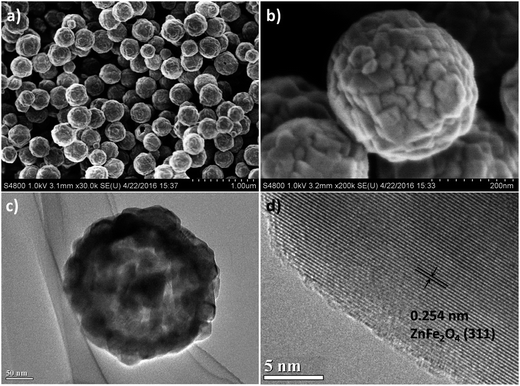 | ||
| Fig. 2 (a) and (b) SEM image of ZnFe2O4 hollow microspheres; (c) low magnification and (d) high magnification TEM image of ZnFe2O4 hollow microspheres. | ||
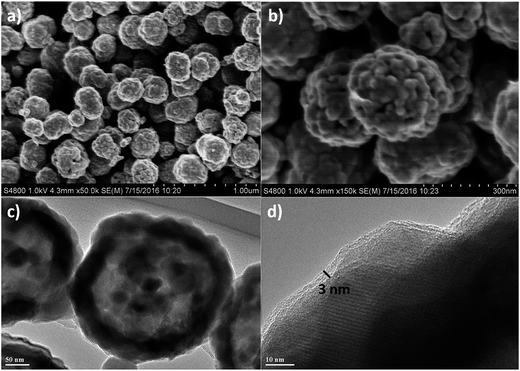 | ||
| Fig. 3 (a) and (b) SEM image of Zn–Fe–O@C hollow microspheres; (c) low magnification and (d) high magnification TEM image of Zn–Fe–O@C hollow microspheres. | ||
The CV profiles of ZnFe2O4 hollow microspheres and Zn–Fe–O@C hollow microspheres for the first five cycles at a scan rate of 0.1 mV s−1 are shown in Fig. 4. As seen from Fig. 4a, two cathodic peaks at 0.82 V and 0.45 V in the initial cycle. The peak at 0.82 V corresponds to Li-intercalation into ZnFe2O4 to form LixZnFe2O4 (eqn (1)). And the strong cathodic peak at 0.45 V can be attributed to the reaction of Li+ with LixZnFe2O4 into Zn0 and Fe0 (eqn (2)), and the further lithiation of Zn0 to give a Li–Zn alloy (eqn (3)),18,19 which leads to destruction of crystal structure. Two anodic peaks at 1.57 V and 1.83 V in the initial cycle are assigned to the oxidation of Zn0 (eqn (4)) and Fe0 (eqn (5) and (6)).20,21 There are also some weak signals at 0.1–0.6 V in the anodic scan, which may correspond to the multi-step de-alloying process of LixZn. Since eqn (1) and (2) are irreversible, ZnFe2O4 could not be recovered in the later cycles.7 Both cathodic and anodic peaks move positively in the following cycles, resulting from the polarization during the first cycle. In the second cycle, it appears three cathodic peaks at 1.33 V, 0.95 V and 0.85 V. The two peaks at 1.33 V and 0.95 V may correspond to the reduction of Fe(II) and Fe(III) to Fe0 (eqn (5) and (6)),22,23 and the peak at 0.85 V results from the reduction of ZnO and the lithiation of Zn0 to LixZn (eqn (3) and (4)). It is presumed that Fe(II) appears because the oxidation of Fe0 is not complete (eqn (6)). As material is full-activated with cycles, only the cathodic peak at 0.92 V and the anodic peak at 1.62 V are preserved, which is indicative of a nano-structure rearrangement.
| ZnFe2O4 + xLi+ + xe− → LixZnFe2O4 | (1) |
| LixZnFe2O4 + (8 − x)Li+ + (8 − x)e− → Zn0 + 2Fe0 + 4Li2O | (2) |
| Zn0 + xLi+ + e− ↔ LixZn | (3) |
| Zn0 + Li2O ↔ ZnO + 2Li+ + 2e− | (4) |
| 2Fe0 + 2Li2O ↔ 2FeO + 4Li+ + 4e− | (5) |
| 2FeO + Li2O ↔ Fe2O3 + Li+ + e− | (6) |
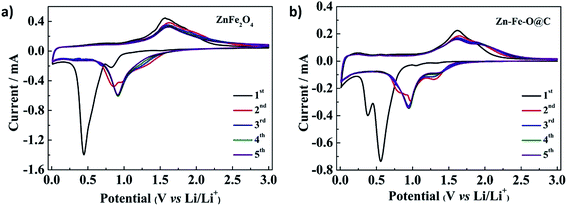 | ||
| Fig. 4 Cyclic voltammograms of (a) ZnFe2O4 hollow microspheres and (b) Zn–Fe–O@C hollow microspheres at a scan rate of 0.1 mV s−1 in the voltage range of 0.01–3.0 V vs. Li/Li+. | ||
In Fig. 4b, there are four cathodic peaks at 1.32 V, 1.05 V, 0.56 V and 0.39 V. The peak at 0.39 V is attributed to the reduction reaction of ZnO to Zn0 and LixZn. And the peak at 0.56 V is assigned to the reduction reaction of iron oxides with Li into Fe0. As for others, it is because that carbon reduces the ZnFe2O4 and produces iron oxides. Compared with Fig. 4a, the cathodic peak at 0.82 V disappears in the initial cycle, which is associated with the crystal structure destruction of ZnFe2O4 after the reaction of ZnFe2O4 with carbon. There are also two anodic peaks at 1.62 V and 1.84 V in the initial cycle matched with the oxidation of Zn0 and Fe0. And some weak anodic peaks can be observed at 0.1–0.6 V, which is caused by the de-alloying process of LixZn. The cathodic and anodic peaks move positively in the following cycles, similar to ZnFe2O4 hollow microspheres. In the second cycle, three cathodic peaks are observed. The peaks at 1.30 V and 0.97 V are correlated with the reduction of Fe(II) and Fe(III) to Fe0. The peak at 0.83 V is related to the reaction of ZnO with Li+ and the lithiation of Zn0 to LixZn. Since Fe(II) is produced during the CVD process, the reduction peak of Fe(II) to Fe0 in Fig. 4b is much more obvious than that in Fig. 4a. Additionally, the anodic peaks at 1.64 V and 1.90 V are almost unchanged. For the same reason of nano-structure rearrangement which has been referred above, there are two cathodic peaks and two anodic peaks in the later cycles.
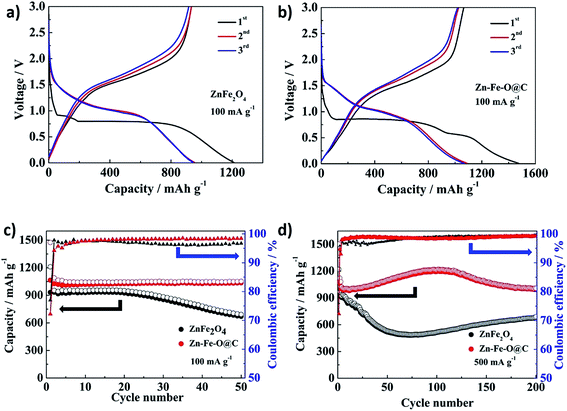
The charge/discharge curves of the ZnFe2O4 hollow microspheres and Zn–Fe–O@C hollow microspheres for the first three cycles obtained at a current density of 100 mA g−1 in the voltage range of 0.01–3 V (vs. Li/Li+) are presented in Fig. 5. The initial discharge and charge specific capacities of Zn–Fe–O@C hollow microspheres are as high as 1474.8 mA h g−1 and 1064.6 mA h g−1, respectively, showing the initial Coulombic efficiency of 72.2%. While, ZnFe2O4 hollow microspheres deliver the initial discharge and charge specific capacities of 1210.7 mA h g−1 and 932.7 mA h g−1, respectively, with the initial Coulombic efficiency of 77%. The initial Coulombic efficiency of Zn–Fe–O@C hollow microspheres is lower than that of ZnFe2O4 hollow microspheres cause by iron oxides which have low initial Coulombic efficiency.24 The extra capacity over the theoretical capacity is ascribed to the formation of SEI film.25–27 The cycling performance of the ZnFe2O4 hollow microspheres and Zn–Fe–O@C hollow microspheres at a current density of 100 mA g−1 is presented in Fig. 5c. It can be observed both the ZnFe2O4 hollow microspheres and Zn–Fe–O@C hollow microspheres exhibit high reversible capacities of 670 mA h g−1 and 1035.6 mA h g−1 after 50 cycles, respectively. In Fig. 5d, the reversible capacity of the Zn–Fe–O@C hollow microspheres increases first, then decreases slightly and finally maintains at 1000 mA h g−1 at a current density of 500 mA g−1. It is worth noting that the reversible capacity is over the theoretical capacity of ZnFe2O4, which may be related to the interfacial storage in nanocomposites.28 In contrast, the reversible capacity of the ZnFe2O4 hollow microspheres undergoes rapid capacity fading firstly, then increases and tends to be stable at 680 mA h g−1. The reversible capacity changing of ZnFe2O4 hollow microspheres are associated with the collapse of the hollow microspheres and the exposure of inner particles during cycling.24
The rate capacity of the ZnFe2O4 hollow microspheres and Zn–Fe–O@C hollow microspheres was also studied (Fig. 6). The cycling behavior at different charge–discharge current density, recorded after 5 cycles from 100 to 1600 mA g−1, then reset to 100 mA g−1, is presented. The reversible specific capacity of Zn–Fe–O@C hollow microspheres maintains at about 810 mA h g−1 at a higher current density of 1600 mA g−1 after 25 cycles, which is 38% higher than the ZnFe2O4 hollow microspheres electrode (587 mA h g−1). When the current density returns back to 100 mA g−1, the capacity of Zn–Fe–O@C hollow microspheres recovers to 1028 mA h g−1. However, the capacity of ZnFe2O4 hollow microspheres decreases rapidly when the current density is reverted to 100 mA g−1. This phenomenon is likely as a result of the collapse of ZnFe2O4 hollow microspheres at a high current density.
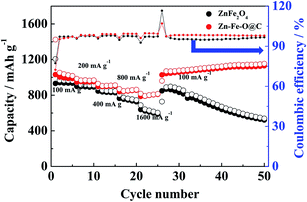 | ||
| Fig. 6 The rate performance of ZnFe2O4 hollow microspheres and Zn–Fe–O@C hollow microspheres (100 to 1600 mA g−1). | ||
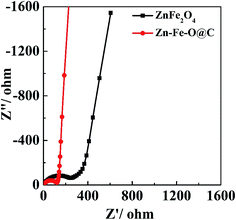
To explore the original reason for the improvement of rate capability and cycling performances, AC impedance measurements were carried out. ZnFe2O4 hollow microspheres and Zn–Fe–O@C hollow microspheres electrodes are tested before the initial cycle, and the fresh cells stand for 24 hours after prepared. Nyquist plots and the equivalent circuit are shown in Fig. 7. Ro indicates the internal resistance. The charge-transfer resistance on electrode/electrolyte interface is represented by R, Wo relates to a Warburg element corresponding to lithium diffusion process within electrodes. The value of R for Zn–Fe–O@C hollow microspheres (109.9 Ω) is significantly lower than that of ZnFe2O4 hollow microspheres (208.5 Ω). This improvement is due to the uniform carbon coating layer on Zn–Fe–O@C hollow microspheres which can increase the electronic conductivity. Therefore, the electronic transportation in conversion reaction can be accelerated and the electrochemical performances of the electrodes have been improved.
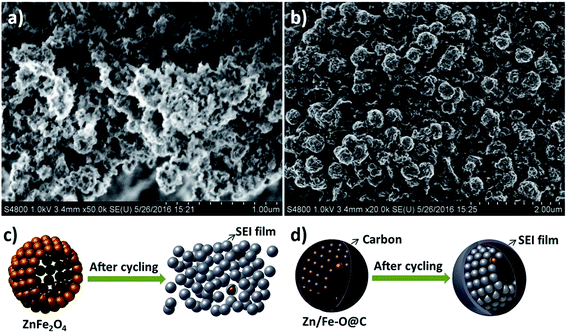
To further understand how the coating carbon improves the electrochemical performances, we carefully investigated the electrode after cycling. Fig. 8 demonstrates the SEM images of the ZnFe2O4 hollow microspheres and Zn–Fe–O@C hollow microspheres electrodes after 50 cycles under the current of 500 mA g−1. It can be seen that ZnFe2O4 hollow microspheres collapse. Whereas, the morphology of Zn–Fe–O@C hollow microspheres still remains. During the CVD process, toluene seeps into ZnFe2O4 hollow microspheres and carbon can be deposited between primary ZnFe2O4 nanoparticles which can enhance the connection between primary nanoparticles as a structural scaffold. Therefore, the carbon coating can improve the structural stability of the active materials and prevent the collapse of hollow microspheres caused by huge volume change as the electrode cycles. In addition, more SEI film forms on ZnFe2O4 hollow microspheres electrode. Without the carbon coating, the SEI film can be broken due to its volume expansion and contraction during cycles. The fresh surface of ZnFe2O4 hollow microspheres exposes to the electrolyte repetitively, which leads to the SEI forming again and again. This is consistent with the Coulombic efficiency of ZnFe2O4 hollow microspheres and Zn–Fe–O@C hollow microspheres.
4. Conclusions
In summary, we prepared ZnFe2O4 hollow microspheres with solvothermal method and synthesized Zn–Fe–O@C by chemical vapor deposition (CVD) method at 800 °C using toluene as the carbon precursor. Although a fraction of Fe(III) reduced to Fe(II), the hollow microspheres maintained during CVD process and Zn–Fe–O@C hollow microspheres showed significantly improved electrochemical performance in terms of cycle stability and rate capability. Zn–Fe–O@C hollow microspheres electrode exhibited initial charge–discharge capacities of 1064.6 and 1474.8 mA h g−1 with an initial Coulombic efficiency of 72.2%. A specific reversible capacity of 1035.6 mA h g−1 was still obtained after 50 cycles at the current density of 100 mA g−1. Even at a large specific current density of 500 mA g−1, reversible capacity as high as 1000 mA h g−1 was still retained after 200 cycles. When the current was gradually increased from 100 to 1600 mA g−1, then reverted to 100 mA g−1, the capacity recovered to 1028 mA h g−1, almost the same as the initial capacity. The hollow microspheres could shorten the diffusion path of Li+ and provide hollow cavities that can reduce the volume change. Most importantly, the carbon coating not only elevates electrical conductivity but also improve the structural stability of the active materials, which leads to the significant improvements in electrochemical properties of Zn–Fe–O@C hollow microspheres compared to that of ZnFe2O4 hollow microspheres. Zn–Fe–O@C hollow microspheres will offer a good model for exploration of the anode materials of LIBs.Acknowledgements
This work was supported by 973 Program (2013CB934103) and Science & Technology Commission of Shanghai Municipality (08DZ2270500), China.References
- J. M. Tarascon and M. Armand, Nature, 2001, 414, 359–367 CrossRef CAS PubMed.
- P. G. Bruce, B. Scrosati and J.-M. Tarascon, Angew. Chem., Int. Ed., 2008, 47, 2930–2946 CrossRef CAS PubMed.
- Y. Idota, T. Kubota, A. Matsufuji, Y. Maekawa and T. Miyasaka, Science, 1997, 276, 1395–1397 CrossRef CAS.
- H. Xia, Y. Qian, Y. Fu and X. Wang, Solid State Sci., 2013, 17, 67–71 CrossRef CAS.
- X. Tang, X. Hou, L. Yao, S. Hu, X. Liu and L. Xiang, Mater. Res. Bull., 2014, 57, 127–134 CrossRef CAS.
- Y. N. NuLi, Y. Q. Chu and Q. Z. Qin, J. Electrochem. Soc., 2004, 151, A1077–A1083 CrossRef CAS.
- Z. Xing, Z. Ju, J. Yang, H. Xu and Y. Qian, Nano Res., 2012, 5, 477–485 CrossRef CAS.
- X.-B. Zhong, Z.-Z. Yang, H.-Y. Wang, L. Lu, B. Jin, M. Zha and Q.-C. Jiang, J. Power Sources, 2016, 306, 718–723 CrossRef CAS.
- P. F. Teh, Y. Sharma, S. S. Pramana and M. Srinivasan, J. Mater. Chem., 2011, 21, 14999–15008 RSC.
- X. Xiao, L. Yang, H. Zhao, Z. Hu and Y. Li, Nano Res., 2012, 5, 27–32 CrossRef CAS.
- D. Wang, X. Ma, Y. Wang, L. Wang, Z. Wang, W. Zheng, X. He, J. Li, Q. Peng and Y. Li, Nano Res., 2010, 3, 1–7 CrossRef CAS.
- J.-M. Jeong, B. G. Choi, S. C. Lee, K. G. Lee, S.-J. Chang, Y.-K. Han, Y. B. Lee, H. U. Lee, S. Kwon, G. Lee, C.-S. Lee and Y. S. Huh, Adv. Mater., 2013, 25, 6250–6255 CrossRef CAS PubMed.
- Y. Ma, G. Ji and J. Y. Lee, J. Mater. Chem., 2011, 21, 13009–13014 RSC.
- Y. Dong, Y. Xia, Y.-S. Chui, C. Cao and J. A. Zapien, J. Power Sources, 2015, 275, 769–776 CrossRef CAS.
- G.-L. Xu, Y.-F. Xu, J.-C. Fang, F. Fu, H. Sun, L. Huang, S. Yang and S.-G. Sun, ACS Appl. Mater. Interfaces, 2013, 5, 6316–6323 CAS.
- X. Gu, L. Chen, S. Liu, H. Xu, J. Yang and Y. Qian, J. Mater. Chem. A, 2014, 2, 3439–3444 CAS.
- X. Feng, J. Yang, Y. Bie, J. Wang, Y. Nuli and W. Lu, Nanoscale, 2014, 6, 12532–12539 RSC.
- X. Guo, X. Lu, X. Fang, Y. Mao, Z. Wang, L. Chen, X. Xu, H. Yang and Y. Liu, Electrochem. Commun., 2010, 12, 847–850 CrossRef CAS.
- L. Fan, Y. Zhang, Q. Zhang, X. Wu, J. Cheng, N. Zhang, Y. Feng and K. Sun, Small, 2016, 12, 5208–5216 CrossRef CAS PubMed.
- H. Li, X. J. Huang and L. Q. Chen, Solid State Ionics, 1999, 123, 189–197 CrossRef CAS.
- Q. Zhang, Z. Shi, Y. Deng, J. Zheng, G. Liu and G. Chen, J. Power Sources, 2012, 197, 305–309 CrossRef CAS.
- J. Zhang, Y. Yao, T. Huang and A. Yu, Electrochim. Acta, 2012, 78, 502–507 CrossRef CAS.
- L. Fan, B. Li, D. W. Rooney, N. Zhang and K. Sun, Chem. Commun., 2015, 51, 1597–1600 RSC.
- J. Zhang, Y. Sun, Y. Yao, T. Huang and A. Yu, J. Power Sources, 2013, 222, 59–65 CrossRef CAS.
- S.-L. Chou, J.-Z. Wang, D. Wexler, K. Konstantinov, C. Zhong, H.-K. Liu and S.-X. Dou, J. Mater. Chem., 2010, 20, 2092–2098 RSC.
- L. Su, Z. Zhou, X. Qin, Q. Tang, D. Wu and P. Shen, Nano Energy, 2013, 2, 276–282 CrossRef CAS.
- A. Ponrouch, P.-L. Taberna, P. Simon and M. Rosa Palacin, Electrochim. Acta, 2012, 61, 13–18 CrossRef CAS.
- Y. F. Zhukovskii, P. Balaya, E. A. Kotomin and J. Maier, Phys. Rev. Lett., 2006, 96, 058302 CrossRef PubMed.
| This journal is © The Royal Society of Chemistry 2017 |

