 Open Access Article
Creative Commons Attribution 3.0 Unported Licence
Performance assessment of activated carbon supported catalyst during catalytic wet oxidation of simulated pulping effluents generated from wood and bagasse based pulp and paper mills
Bholu Ram Yadav and
Anurag Garg *
*
Centre for Environmental Science and Engineering, Indian Institute of Technology Bombay, Powai, Mumbai, 400076, India. E-mail: a.garg@iitb.ac.in; Fax: +91-22-2576-4650; Tel: +91-22-2576-7861
First published on 3rd February 2017
Abstract
In the present study, the performance of catalytic wet oxidation (CWO) was investigated for the treatment of two simulated pulping effluents (with chemical oxygen demand (COD) = 15![[thin space (1/6-em)]](https://www.rsc.org/images/entities/char_2009.gif) 000 and 17
000 and 17![[thin space (1/6-em)]](https://www.rsc.org/images/entities/char_2009.gif) 000 mg L−1, respectively) from large and small scale pulp and paper mills. CWO was performed in a 0.7 L capacity high pressure reactor at 190 °C temperature and 0.9 MPa oxygen partial pressure for 3 h duration with activated carbon (AC) supported Cu–Ce catalyst. More than 70% reduction in chemical oxygen demand (COD) and 90% color removal from the wastewaters were achieved during CWO. The biodegradability ratio of wastewater samples was improved to 0.52 from the initial values of 0.26 and 0.31, respectively. The conversion of lignin after CWO was confirmed by nuclear magnetic resonance analysis. Homo-catalytic oxidation equally contributed to organics degradation during the hetero-catalytic reaction. The detailed results on metal leaching, hydrothermal treatment without oxygen and catalyst reuse are also presented.
000 mg L−1, respectively) from large and small scale pulp and paper mills. CWO was performed in a 0.7 L capacity high pressure reactor at 190 °C temperature and 0.9 MPa oxygen partial pressure for 3 h duration with activated carbon (AC) supported Cu–Ce catalyst. More than 70% reduction in chemical oxygen demand (COD) and 90% color removal from the wastewaters were achieved during CWO. The biodegradability ratio of wastewater samples was improved to 0.52 from the initial values of 0.26 and 0.31, respectively. The conversion of lignin after CWO was confirmed by nuclear magnetic resonance analysis. Homo-catalytic oxidation equally contributed to organics degradation during the hetero-catalytic reaction. The detailed results on metal leaching, hydrothermal treatment without oxygen and catalyst reuse are also presented.
1. Introduction
Pulp and paper mills are categorized under one of the major water intensive industrial sectors. Consequently, a large volume of wastewater is generated from a pulp and paper unit which contains intense color and low biodegradability. Among various unit operations, raw material digestion followed by digested pulp washing produce highly contaminated and colored wastewater due to the solubilization of lignin which is separated from raw material. Though pulp and paper mills should recover lignin for use in boilers, several small and medium scale paper mills do not have proper lignin recovery facilities. Hence, the pulping effluent is sent to an effluent treatment plant with other wastewater streams generated from various unit operations.1 Besides, the spilled black liquor from the digesters is also diverted to the wastewater treatment plant. The presence of lignin makes the wastewater unsuitable for conventional biological treatment.Hence, the present study explores the hydrothermal oxidation to treat simulated pulping effluents which are generated from large and small scale pulp and paper mills. The nature of compounds (such as lignin) may differ in the effluents due to different raw materials.2–4 Moreover, the composition of various constituents such as cellulose and hemicellulose is also changed in the wastewater.5
Generally, large scale paper mills utilize wood as a main raw material while small paper manufacturing units depend on the seasonal availability of several agri-residue based waste materials like sugarcane bagasse, rice husk etc. In large scale pulp and paper mills, kraft pulping is employed whereas small scale units produce pulp using soda process.
Wet oxidation (WO) is a potential hydrothermal treatment for the partial or complete oxidative degradation of recalcitrant organic and inorganic pollutants present in industrial effluents at elevated temperature (125–320 °C) and pressures (0.5–20 MPa).6 Air or molecular oxygen can be used as oxidant. For commercially viable process, the capital and running costs of the treatment may be reduced by the addition of non-noble metal based catalyst.7–9 The catalyst should be robust, recyclable and widely acceptable. Catalytic hydrothermal oxidation (termed as catalytic wet oxidation (CWO)) would reduce intense temperature and pressure requirements and is expected to produce biodegradable aqueous stream rich in low molecular carboxylic acid (such as acetic acid) which can be utilized by microbes as carbon source in post-treatment biological oxidation process.
In our research group, several studies have been performed on the treatment of synthetic as well as simulated pulping effluent using CWO process.10–15 In these studies, the performance of mono and bimetallic supported catalysts was explored. Copper and manganese have been used as active metal species while activated carbon (AC), alumina (Al2O3) and ceria were used as the catalyst support. In few bimetallic supported catalysts, ceria was also used either with Cu or Mn as active metal while AC and Al2O3 were used as support material. Among various solid catalysts, Cu/Ce/AC exhibited promising results for the degradation of ferulic acid. However, its performance on the simulated pulping effluent was yet to be ascertained. Metal leaching and contribution of homo-catalytic reaction and/or adsorption processes on organics removal is also not well studied for pulping effluent. Up to the best of our knowledge, only few researchers studied the contribution of leached metal ion for phenolic wastewaters.16,17 Some studies have looked into the metal leaching during CWO of model compounds has been reported.18–21 However, the role of leached metal on hetero-catalytic CWO performance has not been covered in most of the studies.
Therefore, the present study was aimed to evaluate the performance of Cu/Ce/AC catalyst on two simulated wastewater samples from different pulping processes, namely, kraft and soda processes with the prediction of the extent of adsorption and homo-catalytic oxidation reactions. The changes in wastewater characteristics were determined qualitatively by Fourier transform infrared (FTIR) spectroscopy and 13C NMR (nuclear magnetic resonance) analyses. Apart from this, catalyst reusability studies were also conducted.
2. Materials and methods
2.1. Chemicals and wastewater samples
The chemicals used in this study such as NaOH, Cu(NO3)2·3H2O, CeCl3·7H2O and AC were of analytical grade and purchased from Merck Chemicals Mumbai, India.The wastewater samples (termed as WW1 and WW2) subjected to CWO were representative of pulping effluents generated in large and small scale industries using kraft and soda pulping processes, respectively. For the preparation of simulated pulping wastewater from a large scale industry, the concentrated black liquor was collected from a wood based pulp and paper industry using kraft pulping process. To obtain the representative wastewater from small scale pulp and paper mill, the sugarcane bagasse was digested in our laboratory by soda pulping process. The schematic of sugarcane bagasse digestion process is presented in Fig. 1. Washed and oven-dried sugarcane bagasse was depithed manually and chopped into small pieces (∼2 cm length). Subsequently, sugar was removed from the resulting material after soaking in tap water. The oven-dried material was added to 15% Na2O solution (solid to liquid ratio (w/v) = 1![[thin space (1/6-em)]](https://www.rsc.org/images/entities/char_2009.gif) :
:![[thin space (1/6-em)]](https://www.rsc.org/images/entities/char_2009.gif) 6) and digested in a high pressure vessel (capacity = 2 L) at 170 °C temperature for 90 min duration. The digested material was then washed twice with tap water and filtered through a sieve (pore size = 1 mm). The filtrate (i.e., concentrated black liquor) was collected for the experimental study.
6) and digested in a high pressure vessel (capacity = 2 L) at 170 °C temperature for 90 min duration. The digested material was then washed twice with tap water and filtered through a sieve (pore size = 1 mm). The filtrate (i.e., concentrated black liquor) was collected for the experimental study.
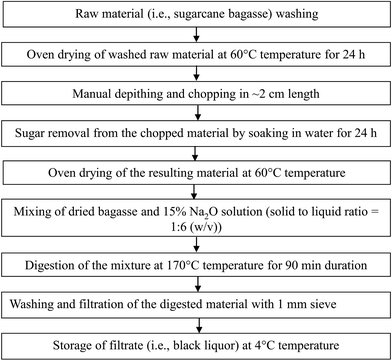 | ||
| Fig. 1 Step-wise procedure for the preparation of concentrated pulping effluent simulating to that generated from small scale pulp and paper mills using bagasse as raw material. | ||
To simulate the characteristics of wastewater generated from the pulping section of large and small scale pulp and paper mills, the concentrated wastewater samples obtained from the industry and prepared in the laboratory were diluted 10 times and 2.5 times, respectively using tap water and stored at 4 °C temperature.
2.2. CWO experimentation and wastewater analysis
The heterogeneous catalyst was synthesized by impregnation method in two compositions (on mass basis): 30Cu/30Ce/40AC and 15Cu/15Ce/70AC. Commercial AC was also modified by heating at 300 °C temperature in absence of oxygen for 2 h in a muffle furnace before using for experimental study. The catalyst preparation method and its characteristics such as Brunauer, Emmett and Teller (BET) surface area and pore analysis, X-ray diffraction pattern (XRD), scanning electron microscopy (SEM), temperature programmed reduction (TPR), Fourier transform infrared (FTIR) imaging and thermo-gravimetric analysis (TGA) have already been discussed elsewhere.13,15The heterogeneous AC supported catalyst was tested for CWO of diluted pulping effluents (WW1 and WW2) at 190 °C temperatures (T) and 0.9 MPa initial O2 pressures (PO2) (total system pressure = 2.15 MPa). In addition, the untreated as well as modified AC were also used as catalysts for CWO process. Generally, a catalyst concentration of 3 g L−1 was used for majority of CWO runs. The enhanced catalyst concentration of 6 g L−1 was added only in few runs. The duration of a typical oxidative run was 3 h. The diluted wastewater samples from large and small scale pulp and paper units are represented as WW1 and WW2, respectively. The wastewater pH was adjusted to 8.5 before introducing it in 700 mL capacity high pressure stainless steel (SS) reactor. The experimental setup details have been furnished in another place.12 For CWO runs, typically 250 mL wastewater was taken in the reactor. Pre-determined concentration of catalyst was directly added into the reactor. Approximately 5 mL of wastewater sample was withdrawn from the reactor once the preset reaction temperature was achieved (termed as ‘zero time’ sample). Then the desired oxygen pressure level was introduced into the reactor by means of oxygen cylinder and mixing of reactor contents was started using mechanical stirrer (rotating speed = 1000 rpm). The small aliquots of liquid (∼5 mL) were withdrawn during the reaction and analyzed for pH, lignin, total organic carbon (TOC), and chemical oxygen demand (COD) while the selected samples were subjected to 5 day biochemical oxygen demand (BOD5) and color determination. All WO/CWO runs were conducted in duplicate.
pH of the wastewater samples was measured with a digital pH meter (Model and Make: Polmon, LP-139S, India). Shimadzu TOC analyzer (Model and Make: TOC-VCSH, Japan) was used to determine TOC of untreated and treated wastewater samples, while COD and BOD5 were determined according to the prescribed closed reflux and modified Winkler's methods, respectively.22 Solids in the effluent were determined by drying the wastewater sample (before and after filtration with 1.2 μm filter) in a hot air oven (Aditi Associates, Mumbai, India) at 105–110 °C temperature till a constant mass was reached.22 Ammonium nitrogen (NH4+–N) and nitrate nitrogen (NO3−–N) in the wastewater samples were measured by ammonium and nitrate–nitrogen probes (HACH, USA) using a multi-parameter analyzer (HQ30d, HACH, USA). Alkalinity of the wastewater was measured by titrimetric method.22 The change in color was determined by recording absorbance of the samples at 465 nm on the spectrophotometer (Model and Make: UV-1800, Shimadzu, Japan).23,24 Copper and cerium in CWO treated wastewater samples were measured with Inductively Coupled Plasma-Atomic Emission Spectroscopy (ICP-AES) (Model and Make: HORIBA Jobin Yvon-Ultima 2000, France). The functional groups in the untreated and treated wastewater were determined by FTIR analysis (Model and Make: FTIR-6100 type A, Jasco, Netherland) having resolution of 0.964233 cm−1. 13C NMR analysis was performed using NMR spectrometer (Model and Make: Mercury Plus 300 MHz NMR spectrometer, Varian, USA).
For lignin estimation, the simulated pulping effluents (WW1 and WW2) were precipitated by lowering the pH to 2.5 using concentrated H2SO4. The precipitate was then filtered and dried in a hot air oven at 100 °C temperature for 24 h. The filtered residue was assumed to be available lignin in wastewater. Different concentrations of the precipitated residue were prepared after dissolving the certain quantity of the solid in alkali solution (1 M NaOH). To obtain calibration curve, the absorbance of liquid samples with different concentration of the precipitated residue was measured at 280 nm wavelength on a UV spectrophotometer (Model and Make: UV-1800, Shimadzu, Japan). The similar procedure has been adopted by several researchers in the past.25,26
The adsorbed quantity of carbonaceous compounds on the surface of the catalyst after CWO runs was also determined. To determine this, no wastewater sample was withdrawn during the reaction. The solids were recovered from the treated wastewater using 0.2 μm filter paper and dried in a hot air oven at 103 °C temperature for 24 h. The dried material was dissolved in aqua-regia to quantify the adsorbed organics (in terms of TOC value) on the catalyst surface.20
3. Results and discussion
3.1. Characteristics of wastewater samples (WW1 and WW2)
Detailed characteristics of the diluted wastewater samples (analyzed in triplicate) are given in Table 1. Both the wastewater samples were highly colored and alkaline (pH = 10.5 and ∼12) in nature. The diluted wastewater samples have a COD of 15![[thin space (1/6-em)]](https://www.rsc.org/images/entities/char_2009.gif) 000 and 17
000 and 17![[thin space (1/6-em)]](https://www.rsc.org/images/entities/char_2009.gif) 000 mg L−1, respectively while biodegradability ratio (i.e., BOD5
000 mg L−1, respectively while biodegradability ratio (i.e., BOD5![[thin space (1/6-em)]](https://www.rsc.org/images/entities/char_2009.gif) :
:![[thin space (1/6-em)]](https://www.rsc.org/images/entities/char_2009.gif) COD) was 0.26 and 0.31, respectively, which is much lower than the recommended biodegradability limit of 0.5.27 Hence, some non-biological pretreatment can be justified to enhance the biodegradability of pulping wastewaters. Apart from this, the wastewater samples contained high total dissolved solids (TDS) and low nitrogen levels.
COD) was 0.26 and 0.31, respectively, which is much lower than the recommended biodegradability limit of 0.5.27 Hence, some non-biological pretreatment can be justified to enhance the biodegradability of pulping wastewaters. Apart from this, the wastewater samples contained high total dissolved solids (TDS) and low nitrogen levels.
| S. no. | Parameter | WW1 | WW2 |
|---|---|---|---|
| 1 | pH | 10.5 | 11.9 |
| 2 | Color | Dark brown | Dark brown |
| 3 | Total organic carbon (TOC) (mg L−1) | 4700 ± 32 | 5000 ± 55 |
| 4 | COD (mg L−1) | 15![[thin space (1/6-em)]](https://www.rsc.org/images/entities/char_2009.gif) 000 ± 213 000 ± 213 |
17![[thin space (1/6-em)]](https://www.rsc.org/images/entities/char_2009.gif) 000 ± 319 000 ± 319 |
| 5 | BOD5 (mg L−1) | 3840 ± 82 | 5230 ± 168 |
| 6 | Lignin (g L−1) | 6.5 | 5.7 |
| 7 | Total solids (g L−1) | 15.4 | 18.6 |
| 8 | Total dissolved solids (g L−1) | 14.6 | 17.2 |
| 9 | Total suspended solids (g L−1) | 0.80 | 1.4 |
| 10 | Alkalinity (mg L−1 as CaCO3) | 3200 ± 102 | 4650 ± 128 |
| 11 | NH4+–N (mg L−1) | 3.2 | 9.7 |
| 12 | NO3−–N (mg L−1) | 17.2 | 18.1 |
3.2. CWO results
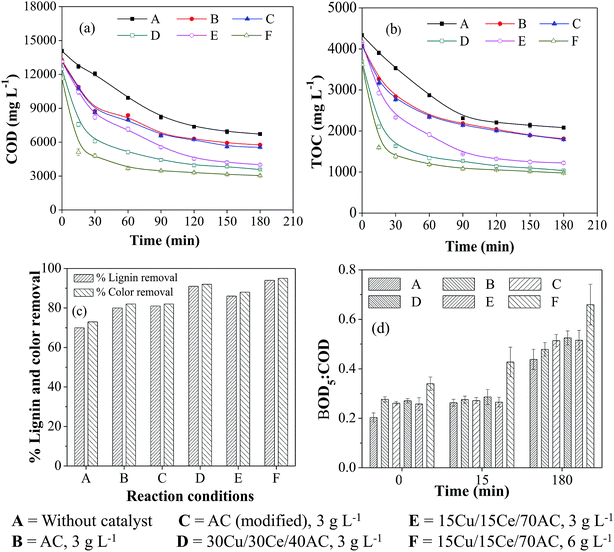
The performance of Cu/Ce/AC catalyst was studied during the oxidative treatment of WW1 and WW2 and the results were compared to those obtained after non-catalytic and AC (untreated and modified) catalyzed WO. Furthermore, an effort was made to predict the contribution of homo-catalytic and hetero-catalytic reactions for COD removal from wastewater. The effect of the composition and concentration of the heterogeneous catalyst on the performance of CWO was also determined.It was noted that the overall organics removal during WO/CWO was occurred in two steps: fast degradation up to 30–60 min followed by the slower reaction for the remaining period. With 3 g L−1 of catalyst concentration (Ccat), the maximum COD and TOC removals of ∼76% and 77%, respectively, were achieved in the presence of 30Cu/30Ce/40AC catalyst which was much higher than 55% and 53%, respectively, obtained after non-catalytic WO (duration = 3 h) (Fig. 2a and b). The reduction in metal content in the catalyst (i.e., with 15Cu/15Ce/70AC) caused slightly inferior COD and TOC removals (∼73%) from the wastewater. In the presence of untreated and modified AC, the overall COD and TOC removals were further reduced to ∼63% and ∼60%, respectively. The results clearly showed the favorable effect of the metals on the degradation of pollutants present in aqueous medium. By increasing 15Cu/15Ce/70AC catalyst concentration to 6 g L−1, the COD removal was enhanced to ∼79% almost similar to that obtained with 30Cu/30Ce/40AC catalyst. The order of the activity of various catalysts for COD and TOC removals during CWO reaction was as follows (in decreasing order):
15Cu/15Ce/70AC (6 g L−1) > 30Cu/30Ce/40AC (3 g L−1) > 15Cu/15Ce/70AC (3 g L−1) > modified AC (3 g L−1) > untreated AC (3 g L−1).
After 3 h reaction, the color removal from WW1 was 92% and 88% in the presence of 30Cu/30Ce/40AC and 15Cu/15Ce/70AC catalysts (Ccat = 3 g L−1), respectively, under the same reaction conditions (Fig. 2c). Like COD results, marginally better color removal from WW1 was observed with 6 g L−1 of 15Cu/15Ce/70AC catalyst. In comparison, the color removal after 3 h duration non-catalytic WO was only 73%. Similar results were observed for lignin removal from WW1 (Fig. 2c).
During WO/CWO reaction, the biodegradability ratio of WW1 was determined for the samples collected at zero time, 15 min and 180 min (Fig. 2d). No substantial improvement was observed in the first 15 min of reaction (except for the run with 6 g L−1 of 15Cu/15Ce/70AC catalyst). However, biodegradability of the treated wastewater was enhanced to 0.48–0.52 after all catalytic runs with 3 g L−1 catalyst concentration whereas the ratio was increased to 0.44 after non-catalytic WO reaction.
At the end of reaction, pH of the treated wastewater was reduced to 6.6–7.4 from an initial value of 8.5. The drop in pH was attributed to the formation of low molecular weight acids in aqueous phase during the reaction.
The removal of contaminants is caused by a combination of multiple reactions which include adsorption, oxidation, homo-catalysis and thermal hydrolysis. To confirm the contribution of adsorption, the catalyst samples were recovered and subjected to TOC analysis after dissolving in aqua-regia. After 3 h of CWO reaction, only 1–2% of the initial wastewater TOC was found adsorbed on the surface of various catalysts (i.e., 80–100 mg L−1). The contribution of homo-catalytic reaction and thermal hydrolysis are discussed later.
It can be suggested that both non-catalytic as well as catalytic oxidation were capable of increasing the biodegradability of WW1 significantly. The color in the WO treated wastewater was much intense compared to that observed after treatment with supported bimetallic catalyst. In addition, the COD of WO treated wastewater was still on higher side which would demand more oxygen for the post aerobic biological treatment process. Hence, the catalytic oxidation can be suggested as suitable method for the treatment of pulping effluent from wood based pulp and paper mill.
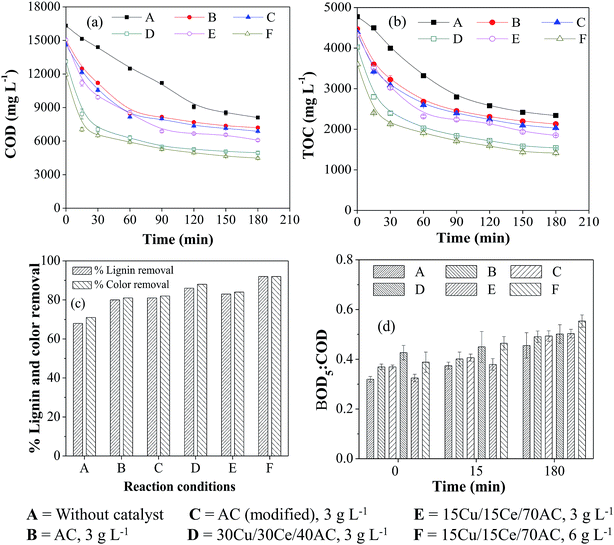
The COD, TOC, color and lignin reduction patterns were found identical with those obtained with WW1 though the overall percent removal from all these parameters was slightly lower. For example, the maximum COD and TOC removals of 71% and 67%, respectively, could be achieved in the presence of 30Cu/30Ce/40AC catalyst (Ccat = 3 g L−1) compared to ∼76% and 77% reductions obtained for WW1 (Fig. 3a and b). After non-catalytic WO reaction, the removal in both parameters was only 52% and 50%, respectively. Doubling 15Cu/15Ce/70AC catalyst concentration from 3 g L−1 to 6 g L−1 improved organics removal slightly which was comparable to that found in the presence of 30Cu/30Ce/40AC catalyst (Ccat = 3 g L−1). It was observed that only 1–2% of the initial wastewater TOC was adsorbed on the surface of various catalysts after 3 h of CWO reaction. It can be observed from Fig. 3c that the presence of 30Cu/30Ce/40AC catalyst (Ccat = 3 g L−1) caused the maximum lignin and color removals of 86% and 88%, respectively after CWO run.
The change in biodegradability of wastewater with time is illustrated in Fig. 3d. Final biodegradability of the wastewater was increased to 0.55 after reaction in the presence of 15Cu/15Ce/70AC catalyst (Ccat = 6 g L−1) from an initial wastewater biodegradability of 0.31. After 3 h of WO/CWO reaction, final pH of the wastewater (i.e., WW2) was reduced to 6.2–7.7 from the initial value of 8.5.
In summary, the organics removal from WW2 was slightly lower than that obtained with WW1 which clearly indicates the different nature of compounds in two wastewater streams. For example, lignin content in WW2 was lower than WW1 but there would be other compounds (like sugar from bagasse) contributing to COD of the wastewater WW2.
3.3. Hydrothermal studies on WW1 and WW2 in absence of oxygen at room temperature (RT) and 190 °C temperature
The hydrothermal studies on both the wastewaters (i.e., WW1 and WW2) were performed in absence of external oxygen at RT (∼30 °C) and reaction temperature (i.e. 190 °C) in the presence of 30Cu/30Ce/40AC and 15Cu/15Ce/70AC catalysts (Ccat = 3 g L−1). The COD and TOC removals achieved after the hydrothermal study are shown in Fig. 4a and b.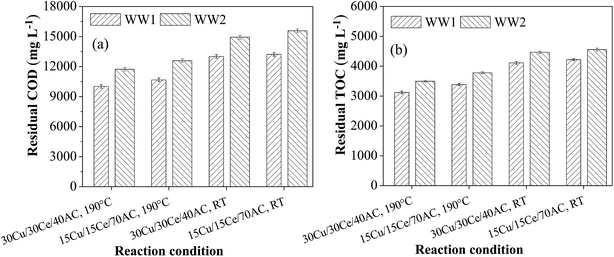 | ||
| Fig. 4 (a) Residual COD and (b) residual TOC after hydrothermal treatment of WW1 and WW2 at room temperature and 190 °C temperature (Ccat = 3 g L−1 and initial reaction pH = 8.5). | ||
The maximum removals in COD and TOC were 34% and 33%, respectively, with 30Cu/30Ce/40AC catalyst during thermal treatment of WW1 at elevated temperature (=190 °C) in oxygen-starved condition whereas the reductions in these lumped parameters were only 13% and 12%, respectively when the reaction was performed at room temperature. Similarly, for WW2, the maximum removals of 31% and 30% in COD and TOC, respectively, were found at elevated temperature with the same catalyst compared to only 12% and 10% reduction in corresponding parameters achieved at room temperature.
The enhancement in organics removal at elevated temperature conditions may be attributed to the hydrolysis, decarboxylation and oxidation (due to the presence of O2 in the reactor head space and catalyst lattice) reactions in addition to the adsorption. A slight reduction in the treated wastewater pH also confirmed the change in nature of parent organic compounds during the hydrothermal treatment. However, no considerable improvement in biodegradability of WW1 and WW2 was observed.
3.4. Leaching of metals from the catalysts during CWO of WW1 and WW2
Leaching of the metal species from the solid catalysts was determined in the treated wastewater samples withdrawn periodically from the reactor during 3 h of CWO reaction. For both the wastewaters (i.e., WW1 and WW2), copper leaching was significant in the beginning of reaction (Fig. 5). It can be seen that the copper leaching at ‘zero time’ during CWO of WW1 and WW2 was 300–311 ppm and 31–56 ppm, respectively. In case of CWO of WW1, the dissolved copper concentration continued to decrease till 90 min of reaction and then remained almost unchanged (final copper concentration in treated WW1 = 7–27 ppm). During CWO of WW2, the dissolved copper concentration was increased to ∼300 ppm within first 15 min of reaction and then reduced to 9–40 ppm by the end of reaction.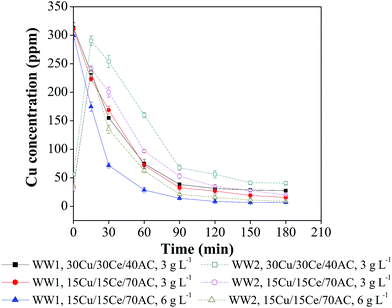 | ||
| Fig. 5 Copper leaching profiles during CWO of WW1 and WW2 (T = 190 °C, PO2 = 0.9 MPa and initial reaction pH = 8.5). | ||
Based on the above observations, it can be suggested that the catalyst should be washed with hot water before using for CWO reaction to remove any loose metal content from its matrix. The decrease in copper leaching with reaction time can be explained using the previous studies according to which the dissolved copper may form complex compounds after reacting with organic intermediates which are eventually removed with the heterogeneous catalyst.28,29 The other reason may be the conversion of dissolved copper in insoluble form at a pH ranging from 6–8.30
For confirmation, a few runs were conducted at ambient temperature in a beaker containing distilled water mixed with homogeneous copper salt to find the extent of copper precipitation at the wastewater pH observed after CWO runs. For these runs, 100 mL distilled water was taken in a glass beaker and its pH was adjusted to 8.5 which was the same as of initial wastewater pH used in the present CWO study. In distilled water, 300 mg L−1 copper (in the form of copper sulfate) was added and the mixture was stirred for 3 h duration. The pH of final solution was measured as 6.7 which is in the range of pH observed after CWO treatment. The solution was filtered and the filtrate was subjected to copper determination. It was found that the solution had insignificant copper in dissolved form which means that almost entire copper was precipitated out at this pH of the aqueous solution. However, the presence of other compounds in the actual wastewater and elevated reaction conditions may also influence the copper precipitation. On the basis of the above experiment, it can be inferred that the leached copper would have transferred to solid phase during the reaction.
3.5. Effect of homogeneous copper during CWO of WW1 and WW2
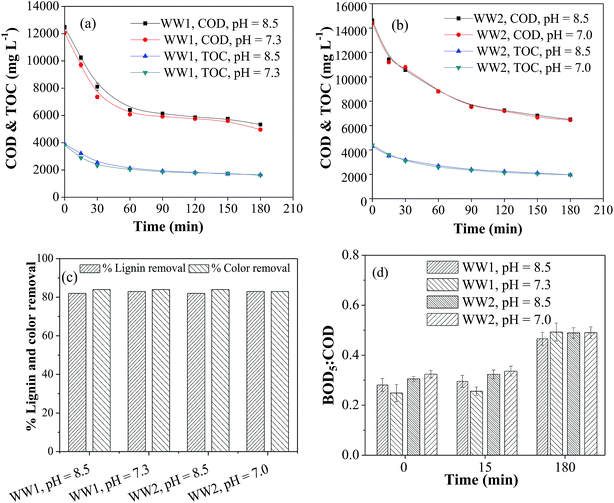
As discussed in the previous section, significant copper leaching was observed in the initial phase of CWO reaction. Hence, the contribution of homogeneous copper ion on overall COD and TOC removals from the wastewater was also investigated. The copper ion concentration of 300 ppm (the maximum leached amount) was used at the same reaction conditions (T = 190 °C and PO2 = 0.9 MPa). Two runs at different initial pH were carried out in duplicate. In the first run, the initial pH was adjusted to 8.5 before adding copper ions in the solution while in other run, the pH was adjusted to 8.5 after adding copper ions. In first case, the starting reaction pH was 7.3 and 7.0 for WW1 and WW2, respectively. The results shown in Fig. 6a and b suggest that the initial reaction pH has no effect on the reductions of COD and TOC from both the wastewaters. For WW1, the removals in COD, TOC, lignin and color were about 67%, 64%, 82% and 81%, respectively, after 3 h of CWO reaction whereas the removals in corresponding parameter were ∼61%, 58%, 82% and 82% for WW2 (Fig. 6a–c). After the homo-catalytic treatment, biodegradability ratio of WW1 and WW2 was enhanced to ∼0.50 after the reaction (Fig. 6d). Like earlier observations, the reduction in dissolved copper concentration was also observed with time (final copper concentration = 37–55 ppm).From the above results for WW1, the contribution of homo-catalytic and hetero-catalytic reactions can be explained. In absence of catalyst, the COD removal was 55% (Section 3.2.1) whereas in the presence of heterogeneous 30Cu/30Ce/40AC catalyst and homogeneous copper catalyst, the removal was 76% and 67%, respectively. It can be stated that hetero-catalytic oxidation caused 21% additional COD removal compared to non-catalytic WO. Out of additional 21% COD removal with heterogeneous catalyst, ∼10% can be attributed to the homo-catalytic reaction which is expected to occur due to dissolved copper. So it can be stated that ∼48% of the total additional COD removal (obtained after CWO with heterogeneous catalyst) may be the contribution of homo-catalytic reaction mediated by dissolved copper. Similar inference can be drawn for WW2.
3.6. FTIR and 13C NMR analyses of WW1 and WW2 samples before and after CWO treatment
FTIR and 13C NMR techniques were used for untreated and treated WW1 and WW2 samples to detect change in the nature of compounds (Fig. 7 and 8). The final samples obtained after treatment at 190 °C temperature and 0.9 MPa oxygen pressure with 3 g L−1 concentration of 30Cu/30Ce/40AC catalyst were used for the analyses.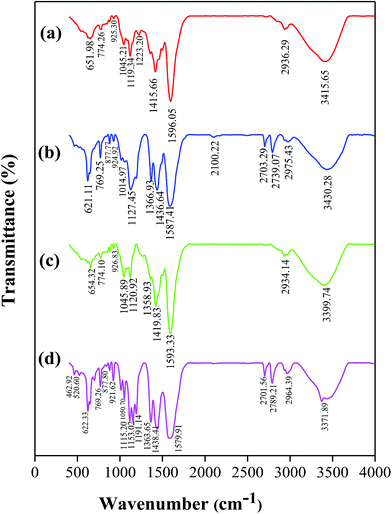 | ||
| Fig. 7 FTIR spectra of (a) WW1 before treatment, (b) WW1 after CWO treatment, (c) WW2 before treatment, (d) WW2 after CWO treatment (catalyst: 30Cu/30Ce/40AC). | ||
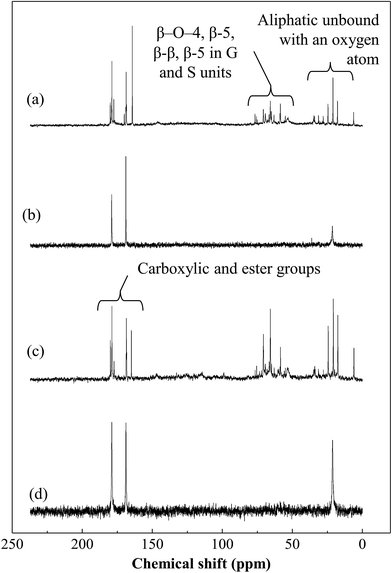 | ||
| Fig. 8 13C NMR spectra of (a) WW1 before treatment, (b) WW1 after CWO treatment, (c) WW2 before treatment and (d) WW2 after CWO treatment (T = 190 °C, PO2 = 0.9 MPa). | ||
The peaks obtained in FTIR spectra (Fig. 7 and Table 2) were assigned to specific functional groups found in lignin as reported in the previous studies.31–37
| Wavenumber (cm−1) | Functional group assignment | |||
|---|---|---|---|---|
| WW1 before treatment | WW1 after treatment | WW2 before treatment | WW2 after treatment | |
| 3415.65 | 3430.28 | 3399.74 | 3371.89 | –OH stretching of alcohol/phenol |
| 2936.29 | 2975.43 | 2934.14 | 2964.39 | –CH asymmetric stretching |
| — | 2739.07, 2701.56 | — | 2789.21, 2703.29 | –CH symmetric stretching |
| 1596.05 | 1587.41 | 1593.33 | 1579.91 | Aromatic skeletal vibrations |
| 1415.66 | 1436.64 | 1419.83 | 1438.44 | C–H in-plane deformation with aromatic ring stretching |
| — | 1366.93 | 1358.93 | 1363.65 | C–O of syringyl ring (S unit) |
| 1223.20 | — | — | — | Combined C–C and C–O stretch |
| 1119.34 | 1127.45 | 1120.92 | 1153.02 | C–O deformation in ester bond |
| 1045.21 | 1014.97 | 1045.89 | 1050.20 | Aromatic C–H in-plane deformation plus C–O deformation in primary alcohols |
| 925.30 | 924.92 | 926.83 | 921.62 | Out-of-plane C–H bending in G units |
| — | 877.77 | — | 877.80 | C–H out-of-plane in position 2,5 and 6 of G units |
From the figure, it can be seen that some additional peaks were formed at 880 cm−1 and 2700–2800 cm−1, which indicates the C–H out-of-plane in the carbon position 2, 5 and 6 of G units and CH symmetric stretching, respectively. Moreover, strength of the few peaks was changed in FTIR spectra of the treated wastewater samples (e.g., 621–650 cm−1 and 1127–1153 cm−1).
13C NMR spectra for both wastewater samples (WW1 and WW2) show the peak locations (Fig. 8). Their assignments to the relevant chemical groups were predicted (Table 3) from the information available on lignin.31–33,38–41 The major lignin linkages such as β-O-4, β-5 and β–β could be located in the spectra of untreated wastewaters which were disappeared after treatment. Furthermore, the intensity of peak at ∼168 ppm was found to increase for both wastewaters after the treatment which may be due to the formation of low molecular weight compounds having carboxylic groups. At lower chemical shifts (i.e., ∼6–35 ppm), the peaks generally indicate the presence of aliphatic carbon which were also disappeared after CWO treatment. In summary, NMR analysis confirms the degradation or conversion of lignin during oxidative treatment process.
| S. no. | Chemical shift range (ppm) | Assignment |
|---|---|---|
| 1 | 168.7, 169.98, 178.85, 180.01 | CO(O)–(H, R) carboxylic and ester |
| 2 | 164.28 | C4 in H unit |
| 3 | 70.72, 75.53 and 76.64 | C-α in G type β-O-4 units |
| 4 | 64.97 and 65.75 | Cγ in β-5 and β-O-4 with Cα![[double bond, length as m-dash]](https://www.rsc.org/images/entities/char_e001.gif) O in G and S units O in G and S units |
| 5 | 58.49 | Cγ in β-O-4 without Cα![[double bond, length as m-dash]](https://www.rsc.org/images/entities/char_e001.gif) O O |
| 6 | 55 | Ar-OCH3 |
| 7 | 53.41 | Cβ in β–β and Cβ in β-5 |
| 8 | 6.27, 17.28, 21.03, 24.58, 31.35, 34.16 and 34.68 | CH, CH2, CH3 aliphatic unbound with an oxygen atom |
3.7. Reuse of the regenerated catalysts
After CWO treatment of WW1 with supported 30Cu/30Ce/40AC catalyst, the wet solid mass was recovered and regenerated by calcination at the same conditions which were used for the synthesis of fresh catalyst (i.e., 300 °C temperature for 2 h). The catalyst was reused twice for the oxidation of WW1 under the following operating conditions: T = 190 °C, PO2 = 0.9 MPa, Ccat = 3 g L−1 and initial reaction pH = 8.5. The reduction in COD and TOC values after second reuse of catalyst was substantially lower than those obtained with fresh catalyst (Fig. 9). Around 70% and 69% reductions in COD and TOC were obtained after 3 h reaction after second reuse of the catalyst, compared to 77% and 76%, respectively, obtained with fresh catalyst. The corresponding lignin and color removals were 88% and 85%, respectively. Nevertheless, biodegradability ratio of the treated wastewater was above 0.5 even after second reuse of the catalyst. pH of the treated wastewater was reduced to 6.8 after the second reuse of the catalyst.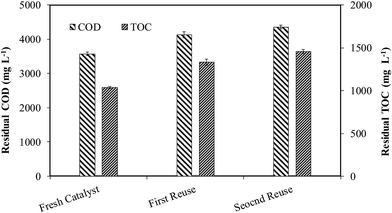 | ||
| Fig. 9 Residual COD and TOC after 3 h CWO reaction with the regenerated catalysts at moderate operation conditions. | ||
After the first reuse, the copper leaching was 52 ppm which was further increased to 60 ppm after its second time reuse for CWO reaction, however no cerium leaching was observed during reuse of the catalyst. Based our earlier findings regarding homo-catalytic contribution, it can be predicted that the homo-catalytic oxidation may be dominant mechanism for TOC and COD removals from the wastewater in the CWO runs with regenerated catalysts. After 3 runs (fresh and two times reuse), total copper leaching was found to ∼140 ppm (i.e., ∼16% of initial copper present in the catalyst).
4. Conclusions
The study demonstrated at moderate reaction conditions (i.e., T = 190 °C, PO2 = 0.9 MPa, Ccat = 3 g L−1, and initial reaction pH = 8.5) with 30Cu/30Ce/40AC catalyst showed highest COD, TOD, lignin and color removals from both wastewaters (WW1 and WW2). Biodegradability ratio of the wastewaters after treatment was found to be above 0.5. During the CWO reaction the contributions of homo-catalytic, adsorption and hydrolysis reaction were also confirmed. During CWO with the heterogeneous catalyst (i.e., 30Cu/30Ce/40AC), it was found that both homo-catalytic as well as hetero-catalytic oxidation reactions were equally effective for the removal of COD. The biodegradability of treated WW1 was found unaffected even after second reuse of 30Cu/30Ce/40AC catalyst though TOC and COD removals were dropped by ∼6%. 13C NMR of WW1 and WW2 samples before and after CWO (with 30Cu/30Ce/40AC catalysts) confirmed the breaking of lignin linkage (like β-O-4, β-5 and β–β) after the treatment. Cerium leaching was negligible from the catalyst showing its thermal stability while ∼16% of the total copper was leached out after reusing the catalyst two times.Acknowledgements
The first author acknowledges the financial support of Ministry of Human Resources and Development (MHRD), New Delhi, India for pursuing doctorate degree. We also acknowledge the support of the Sophisticated Analytical Instrumentation Facility (SAIF), IIT Bombay for helping us in 13C NMR and FTIR analysis.References
- P. K. Tewari, V. S. Batra and M. Balakrishnan, J. Environ. Manage., 2009, 90, 265–273 CrossRef CAS PubMed.
- J. C. Rio, A. Lino, J. L. Colodette, C. F. Lima, A. Gutierrez, A. T. Martinez, F. Lu, J. Raph and J. Racoret, Biomass Bioenergy, 2015, 81, 322–338 CrossRef.
- W.-J. Liu, H. Jiang and H.-Q. Yu, Green Chem., 2015, 17, 4888–4907 RSC.
- G. Gellerstedt, Ind. Crops Prod., 2015, 77, 845–854 CrossRef CAS.
- A. H. Hemmasi, A. Samariha, A. Tabei, M. Nemati and S. Khakifirooz, American-Eurasian J. Agric. & Environ. Sci., 2011, 11(4), 478–481 CAS.
- V. S. Mishra, V. V. Mahajani and J. B. Joshi, Ind. Eng. Chem. Res., 1995, 34, 2–48 CrossRef CAS.
- S. Imamura, Ind. Eng. Chem. Res., 1999, 38, 1743–1753 CrossRef CAS.
- S. K. Bhargava, J. Tardio, J. Prasad, K. Foger, D. B. Akolekar and S. C. Grocott, Ind. Eng. Chem. Res., 2006, 45, 1221–1258 CrossRef CAS.
- S. K. Kim and S. K. Ihm, J. Hazard. Mater., 2011, 186, 16–34 CrossRef PubMed.
- A. Garg, I. M. Mishra and S. Chand, Chemosphere, 2007, 66, 1799–1805 CrossRef CAS PubMed.
- A. Garg, I. M. Mishra and S. Chand, Water Environ. Res., 2008, 80(2), 136–141 CrossRef CAS PubMed.
- B. R. Yadav and A. Garg, Ind. Eng. Chem. Res., 2012, 51, 15778–15785 CrossRef CAS.
- B. R. Yadav and A. Garg, Chem. Eng. J., 2014, 252, 185–193 CrossRef CAS.
- B. R. Yadav and A. Garg, Environ. Sci. Pollut. Res., 2016, 23(20), 20081–20086 CrossRef CAS PubMed.
- B. R. Yadav and A. Garg, Environ. Technol., 2016, 7(8), 1018–1025 CrossRef PubMed.
- N. S. Inchaurrondo, P. Massa, R. Fenoglio, J. Font and P. Haure, Chem. Eng. J., 2012, 198–199, 426–434 CrossRef CAS.
- Y. Tu, Y. Xiong, S. Tian, L. Kong and C. Descorme, J. Hazard. Mater., 2014, 276, 88–96 CrossRef CAS PubMed.
- S. Hočevar, U. O. Krašovec, B. Orel, A. S. Arico and H. Kim, Appl. Catal., B, 2000, 28, 113–125 CrossRef.
- D. B. Akolekar, S. K. Bhargava, I. Shirgoankar and J. Prasad, Appl. Catal., A, 2002, 236, 255–262 CrossRef CAS.
- S. Bhargava, H. Jani, J. Tardio, D. Akolekar and M. Hoang, Ind. Eng. Chem. Res., 2007, 46, 8652–8656 CrossRef CAS.
- A. Garg and A. Mishra, J. Hazard., Toxic Radioact. Waste, 2013, 17(2), 89–96 CrossRef CAS.
- American Public Health Association (APHA), Standard methods for the examination of water and wastewater, APHA, Washington, DC, 21st edn, 2005 Search PubMed.
- S. G. Lathia and T. W. Joyce, IPC Technical Paper Series Number, The Institute of Paper Chemistry, Appleton, Wisconsin, 1978, 60, pp. 1–12 Search PubMed.
- P. Singh, J. Environ. Biol., 2007, 28(1), 77–82 CAS.
- K. I. Andersson, M. Eriksson and M. Norgren, Ind. Eng. Chem. Res., 2011, 50, 7722–7732 CrossRef CAS.
- R. A. Lee, C. Bédard, V. Berberi, R. Beauchet and J. M. Lavoie, Bioresour. Technol., 2013, 144, 658–663 CrossRef CAS PubMed.
- Metcalf & Eddy, Wastewater engineering treatment and reuse, Tata McGraw-Hill, New Delhi, India, 2003, ISBN No. 0070418780 Search PubMed.
- K. H. Kim and S. K. Ihm, J. Hazard. Mater., 2007, 146, 610–616 CrossRef CAS PubMed.
- A. Xu and C. Sun, Environ. Technol., 2012, 33(11), 1339–1344 CrossRef CAS PubMed.
- A. Garg, I. M. Mishra and S. Chand, Ind. Eng. Chem. Res., 2005, 44, 2016–2026 CrossRef CAS.
- J. X. Sun, X. F. Sun, R. C. Sun, P. Fowler, M. S. Baird and J. Agr, Food Chem., 2003, 51(23), 6719–6725 CrossRef CAS PubMed.
- S. N. Sun, M. F. Li, T. Q. Yuan, F. Xu and R. C. Sun, Ind. Crops Prod., 2012, 37(1), 51–60 CrossRef CAS.
- B. Joffres, C. Lorentz, M. Vidalie, D. Laurenti, A. A. Quoineaud, N. Charon, A. Daudin, A. Quignard and C. Geantet, Appl. Catal., B, 2014, 145, 167–176 CrossRef CAS.
- L. P. Xiao, Y. Y. Bai, Z. J. Shi, Q. Lu and R. C. Sun, Biomass Bioenergy, 2014, 68, 82–94 CrossRef CAS.
- H. Li and A. G. McDonald, Ind. Crops Prod., 2014, 62, 67–76 CrossRef CAS.
- X.-F. Zhou, Bioresour. Technol., 2014, 170, 583–586 CrossRef CAS PubMed.
- P. Yan, Z. Xu, C. Zhang, X. Liu, W. Xu and Z. C. Zhang, Green Chem., 2015, 17, 4913–4920 RSC.
- M. Hernández, J. Rodríguez, M. I. Pérez, A. S. Ball and M. E. Arias, Appl. Microbiol. Biotechnol., 1997, 47, 272–278 CrossRef.
- R. C. Sun and J. Tomkinson, Ultrason. Sonochem., 2002, 9(2), 85–93 CrossRef CAS PubMed.
- R. Samuel, Y. Pu, B. Raman and A. J. Ragauskas, Appl. Biochem. Biotechnol., 2010, 162, 62–74 CrossRef CAS PubMed.
- J. W. Choi and O. Faix, J. Ind. Eng. Chem., 2011, 17, 25–28 CrossRef CAS.
| This journal is © The Royal Society of Chemistry 2017 |

