 Open Access Article
Creative Commons Attribution 3.0 Unported Licence
Visible sequestration of Cu2+ ions using amino-functionalized cotton fiber
Changkun Liu *,
Xiaobin Lei,
Xiaoyan Liang,
Jizhen Jia and
Lin Wang
Shenzhen Key Laboratory of Environmental Chemistry and Ecological Remediation, College of Chemistry and Environmental Engineering, Shenzhen University, 3688 Nanhai Ave., Shenzhen, 518060, Guangdong Prov., P. R. China. E-mail: liuck@szu.edu.cn
First published on 2nd February 2017
Abstract
In this study, an amino functionalized cotton fiber, which was used to adsorb Cu2+ ions via visible sequestration, was prepared and investigated. The amino-functionalized cotton fiber (named as ACF) exhibited enhanced adsorption, selectivity and distinct color response to Cu2+ ions in aqueous solutions. The absorbance responses of ACF to Cu2+ ions (named as ACF–Cu), obtained from the a fiber optic spectrometer, were monitored with different pH values and initial Cu2+ ion concentrations. A linear relationship between the absorbance response and the initial concentrations of Cu2+ ions was established and can be used for the determination of Cu2+ ion concentrations in aqueous solutions. Furthermore, in the interference study, ACF showed great selectivity to Cu2+ ions when other ions (e.g., Pb2+ or Zn2+ ions) coexisted with the Cu2+ ions in solution. The ability of ACF to effectively detect Cu2+ ions with the presence of other interfering ions in solution was of great significance.
1. Introduction
The rapid industrial development of petroleum refining, metallurgical mining, electro-plating and chemical manufacturing has led to large quantities of discharged wastewater containing heavy metal ions.1 Heavy metal ions are not only toxic and non-degradable, but also able to be accumulated in human body and natural environment. Excessive intake of heavy metal ions, such as copper ions, may cause serious damage to nervous and urinary systems.2 Therefore, many methods have been used for the removal of copper ions from wastewaters, including chemical precipitation, chemical reduction, electrochemical treatment, ion exchange and adsorption.3 Among these methods, adsorption has become an advantageous technique due to its low cost, great adsorption capacity, good selectivity and reusability. Yantasee et al. prepared nitro groups modified active carbon and then reduced them to amino groups for adsorbing Cu2+ ions with 0.86 mmol g−1 adsorption capacity.4The adsorbents usually adsorb heavy metal ions through the interactions of the functional groups on the adsorbents' surface with the heavy metal ions.5 Therefore, the functional groups of the adsorbents are important for the adsorption performances. Currently, the amine group is regarded as one of the most effective groups for heavy metal ions adsorption due to the high affinity of the formed amine–metal complex on the adsorbent surface.6–8 For instance, Yang et al. synthesized cyclic diamine-grafted chitosan-crown ether, which showed great selectivity for Cu2+ ion adsorption when Pb2+, Cu2+ and Cd2+ ions co-existed in the solution.9
Copper ion can hardly be observed in aqueous solutions due to its colorless and odorless nature when its concentration is relatively low. Traditional copper ion concentration determination methods include visible spectrophotometry, atomic absorption, electrochemical analysis, fluorescence spectrometry and inductively coupled plasma mass spectrometry, etc. However, most of these methods need complicated sample preparation process, large instruments and high expenses,10,11 which are not suitable for on-site detection. Besides, it is favorable and imperative to accomplish both the on-site convenient detection and efficient removal of copper ions in a simultaneous manner. Therefore, a low-cost, easy-to-use, and small-size device is extremely needed for monitoring and removing copper ions. In recent years, the stable colorimetric strategies have attracted more and more attention for easy detection of a certain heavy metal ion via the color changes. For example, Liu et al. had prepared a porphyrin-functionalized polyacrylonitrile fiber as the highly selective and sensitive colorimetric mercury sensor for mercury ions detection.12 However, it is of great value if both functions of detection and adsorption towards the target heavy metal ion be combined onto one material, so as to provide the early warning and efficient removal of the heavy metal ions.
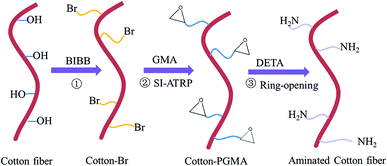
In recent years, cotton fiber as one of the cheap and abundant biomaterials, which are mainly composed of cellulose, has attracted much research attention. Cotton fiber can be surface modified due to the hydroxyl groups present on the cellulose.13–15 For example, Monier et al. reported a modified cotton fiber prepared via the graft polymerization and surface modification methods, which was used to adsorb Au3+, Pd2+ and Ag+ ions in aqueous solutions and showed the highest adsorption capacity for Au3+ ion.16 Although cotton fiber can be modified for various applications, the multi-functions of copper ion adsorption and detection with the aminated cotton fiber (named as ACF) through chromogenic reaction have seldom been reported before. The ACF samples would reflect the environment-friendly significance through the monitoring and control of copper ions in the solution. In addition, the use of the modified cotton fiber materials demonstrates the great strategic awareness favorable to both economy and environment. In this study, the cotton fiber was used as the substrate, and the glycidyl methacrylate (GMA) was polymerized and grafted onto the cotton fiber (as PGMA polymer brush) via the surface-initiated atom transfer radical polymerization (SI-ATRP) technology. Then, diethylenetriamine (DETA) was immobilized onto PGMA polymer brushes through the ring-opening reaction. The prepared multi-functional cotton fiber was examined for its color change properties in response to copper ions, as well as the adsorption performances towards the copper ions in aqueous solutions.
2. Experimental
2.1 Materials
Cotton fibers were provided by Qingbai Plastic Products Factory. 2-Bromoisobutyryl bromide (BIBB, AR, 98%), cobalt nitrate hexahydrate (AR, 99%), iron(II) chloride tetrahydrate (AR, 99%), nickel nitrate hexahydrate (AR, 98%), copper nitrate tetrahydrate (AR, 99%), copper(II) bromide (CuBr2, 99%), glycidyl methacrylate (GMA, AR, >97%), N,N-dimethylformamide (DMF, AR, 99.5%), tetrahydrofuran (THF, AR, 99%), copper(I) bromide (CuBr, AR, 99%), 2,2′-bipyridyl (Bpy, AR, >99%) and EDTA (disodium salt-ethylene diamine tetraacetic acid, 0.1 mol L−1) were purchased from Shanghai Aladdin Reagent Co., Ltd. Dichloromethane (DCM, AR), sodium hydroxide (NaOH, AR), acetone (AR) and methanol (AR, 99.9%) were purchased from Tianjin Baishi Chemical Company.2.2 Preparation of the aminated cotton fiber
Firstly, 1 g pristine cotton fiber and 30 mL DCM were added into the test tube, in which 10 mL BIBB and 1 mL pyridine were added slowly. The mixtures in the test tube were stirred at the stirring speed of 150 rpm on a magnetic stirrer for 24 h in an ice-water bath to prepare the brominated cotton fiber. After the reaction, the brominated cotton fiber (denoted as cotton-Br) was taken out, repeatedly rinsed with acetone and deionized water, and then dried in a dry box. Secondly, SI-ATRP technology was used to graft PGMA polymer brushes on the surface of the cotton-Br. 0.5 g cotton-Br was placed in a test tube, in which 5 mL deionized water, 10 mL DMF, 15 mL GMA, 0.5 g Bpy, 0.1 g CuBr and 0.05 g CuBr2 were added. The reaction was carried out for 2 h at 45 °C under argon atmosphere to produce PGMA-grafted cotton fiber (denoted as cotton-PGMA). The obtained cotton-PGMA was then washed with THF, acetone, 0.1 M EDTA and deionized water, in that sequence, and dried in a dry box. Thirdly, 0.1 g of the prepared cotton-PGMA was put in a test tube, in which 5 mL THF and 5 mL diethylenetriamine (DETA) were added for the amination reaction at room temperature at the stirring speed of 150 rpm for 24 h to prepare the aminated cotton fiber (ACF). Finally, the ACF was washed with acetone and deionized water, and dried in a dry box for future use.2.3 Characterization
The functional group characterization of the cotton fiber samples was examined using Fourier Transform Infrared Spectrometer (FTIR-8300PCS, Shimadzu, Japan). The surface morphologies of the cotton fiber samples were observed with Scanning Electron Microscope (SEM) (S-3400N, Hitachi, Japan). The surface element recognition of the cotton fiber samples was examined with X-ray Photoelectron Spectroscopy (XPS, Thermo ESCALAB 250Xi, USA).2.4 Adsorption and detection performances
The copper ion adsorption experiments were carried out with the ACF as the adsorbents. All the experiments were conducted in beakers at 25 °C at the stirring speed of 150 rpm for 12 h. The copper ion concentrations before and after the adsorption process were measured by the Inductively Coupled Plasma Optical Emission Spectrometer (ICP-OES, Optima 2100DV, PerkinElmer). The copper ion adsorption capacity was calculated according to eqn (1):
 | (1) |
For the pH effect on copper ion adsorption, each of the 50 mg ACF were placed in a series of 4 mmol L−1 copper nitrate solutions (50 mL each, pH adjusted to 1–5). Copper ions (in Cu2+ form) are the predominant species under such adsorption conditions, as determined by the MINEQL+ software.17 Finally, the copper ion-adsorbed ACF (ACF–Cu) were taken out, rinsed with deionized water and measured by the fiber optic spectrometer (MAX2000-Pro, Wenyi, Shanghai) for absorbance determination. The derived absorbance responses of ACF–Cu were monitored and recorded.
For the adsorption kinetics experiments, 500 mg ACF was decanted into 500 mL of 4 mmol L−1 copper nitrate solution at pH 5. Samples were taken at the designated time intervals in the adsorption process and the concentration of the samples was measured by ICP-OES.
For the adsorption isotherm experiments, 50 mg ACF each were decanted into a series of 50 mL copper nitrate solutions at pH 5 with concentrations ranging from 0.1 to 4 mmol L−1. After the adsorption equilibrium was reached, the ACF–Cu were taken out, rinsed with deionized water and examined for the absorbance with the fiber optic spectrometer.
To examine the effect of the interfering ions, the adsorption was conducted with ACF in the solutions at pH 5 containing 1 mmol L−1 copper ions and 1 or 4 mmol L−1 other ions, including Na+, Zn2+, Fe2+, Co2+, Ni2+ and Pb2+ ions. After the adsorption process, the cotton fiber samples were taken out, rinsed with deionized water and examined for the absorbance with the fiber optic spectrometer.
2.5 Desorption and repeated use studies
In the desorption study, the ACF–Cu sample (derived from the adsorption process: 50 mg ACF, 50 mL of 4 mmol L−1 copper nitrate solution, pH 5) each were placed into 50 mL HNO3 with the concentration range of 0.01–2.00 mol L−1 for the desorption of copper ions. The desorption efficiency was calculated using the following equation:18
 | (2) |
In the repeated use study, 200 mg ACF was first put into 200 mL of 4 mmol L−1 copper nitrate solution at pH 5 for copper ion adsorption. Then, the derived ACF–Cu was put into 200 mL of 0.5 mol L−1 HNO3 solution for the desorption of copper ions, followed by 0.5 mol L−1 NaOH solution wash for 30 min for regeneration and repeated water wash until the pH of the washing water became neutral. After that, the regenerated ACF was again used for copper ion adsorption and the adsorption–desorption–regeneration process was repeated for 6 cycles. The desorption efficiency and adsorption capacity of the ACF during the 6 cycles were recorded.
3. Results and discussion
3.1 Functionalization of the cotton fiber
The synthesis route of the ACF sample was shown in Fig. 1. BIBB reacted with the hydroxyl groups of the cotton fiber to produce the cotton-Br, which acted as the macro initiator for the subsequent PGMA polymerization via the SI-ATRP technique. The subsequently derived cotton-PGMA was further reacted with DETA via the ring-opening reaction for the immobilization of DETA, and the ACF sample was derived.3.2 Characterization of cotton fibers
The surface morphologies of the cotton fiber in different preparation stages were observed using SEM. As shown in Fig. 2(a), the surface of the pristine cotton was relatively smooth. After the bromination, the surface of cotton-Br in Fig. 2(b) showed almost no obvious changes. The surface morphologies of cotton-PGMA and ACF were shown in Fig. 2(c) and (d), respectively. It can be observed that significant changes occurred as the surface was much rougher, indicating that the surface grafting of PGMA and the subsequent immobilization of DETA were prone to change the surface morphologies of the cotton fibers.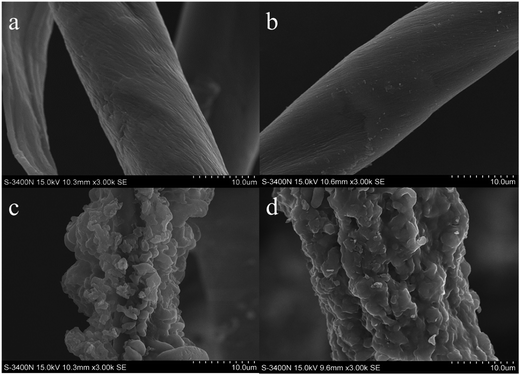 | ||
| Fig. 2 SEM images of the cotton fibers before and after modification: (a) pristine cotton fiber; (b) cotton-Br; (c) cotton-PGMA; (d) aminated cotton fiber (ACF). | ||
The polymeric loading capacity of PGMA of the cotton fiber was determined by the examination of the grafting yield (GY), which was defined as , where Wa and Wb were the weights of the brominated cotton fiber (cotton-Br) before and after surface grafting of PGMA polymers, respectively. The derived GY value was 5.55%. The amine loading yield (AY) in the amination process was similarly defined as
  , where ma and mb were the weights of the PGMA-grafted cotton fiber (cotton-PGMA) before and after amination reaction with DETA, respectively. The derived AY value was 3.67%.
Fig. 3 showed the FTIR spectra of the cotton fiber samples during the preparation procedures. The broad peak at 3325 cm−1 was characteristic for the hydroxyl groups of the pristine cotton.19 After the bromination, the C![[double bond, length as m-dash]](https://www.rsc.org/images/entities/char_e001.gif) O stretching vibration peak appeared at 1730 cm−1 in Fig. 3(b), indicating the successful introduction of BIBB onto the pristine cotton.20 For the spectrum of cotton-PGMA in Fig. 3(c), new peaks appeared at 1147 cm−1 and 1260 cm−1 for the symmetric and asymmetric vibration of the C–O group in GMA molecules, respectively, and at 906 cm−1 and 845 cm−1 for the vibration absorption of the epoxy group, indicating that PGMA polymer brush was successfully immobilized on cotton-Br.21 For the spectrum of the ACF sample in Fig. 3(d), a broad peak appeared in the range of 3100–3700 cm−1, which was contributed by the stretching vibration of both the hydroxyl and amine groups. The new peak at 1160 cm−1 for C–N stretching vibration and at 967 cm−1 for N–H wag vibration, together with the disappearance of the epoxy group characteristic peaks all indicated the successful amination of the cotton fiber to produce the ACF.22
O stretching vibration peak appeared at 1730 cm−1 in Fig. 3(b), indicating the successful introduction of BIBB onto the pristine cotton.20 For the spectrum of cotton-PGMA in Fig. 3(c), new peaks appeared at 1147 cm−1 and 1260 cm−1 for the symmetric and asymmetric vibration of the C–O group in GMA molecules, respectively, and at 906 cm−1 and 845 cm−1 for the vibration absorption of the epoxy group, indicating that PGMA polymer brush was successfully immobilized on cotton-Br.21 For the spectrum of the ACF sample in Fig. 3(d), a broad peak appeared in the range of 3100–3700 cm−1, which was contributed by the stretching vibration of both the hydroxyl and amine groups. The new peak at 1160 cm−1 for C–N stretching vibration and at 967 cm−1 for N–H wag vibration, together with the disappearance of the epoxy group characteristic peaks all indicated the successful amination of the cotton fiber to produce the ACF.22
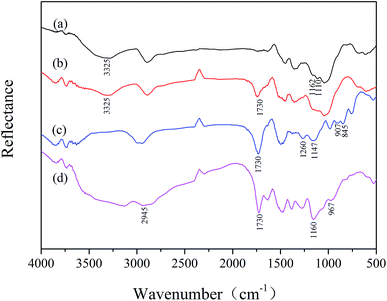 | ||
| Fig. 3 FTIR spectra of the (a) pristine cotton; (b) cotton-Br; (c) cotton-PGMA and (d) aminated cotton fiber. | ||
XPS was used to examine the surface chemical composition of the cotton fiber samples, as shown in Fig. 4. The peaks of C 1s and O 1s appeared in the pristine cotton wide scan spectrum in Fig. 4(a). The C 1s core-level spectrum of the pristine cotton was further sub-divided into three peaks at the binding energies of 284.6, 286.2 and 287.7 eV, attributing to the C oxidation states in C–C/C–H, C–O and O–C–O, respectively, indicating the presence of the cellulose in pristine cotton.23 In Fig. 4(c), new peaks were observed (for Br 3d and Br 3p), indicating the successful introduction of BIBB to form cotton-Br. Likewise, four peaks were sub-divided for the C 1s core-level spectrum in Fig. 4(d) at the binding energies of 284.6, 286.2, 287.7 and 288.8 eV, and the new peak at 288.8 eV indicated the presence of the O–C![[double bond, length as m-dash]](https://www.rsc.org/images/entities/char_e001.gif) O groups in the immobilized BIBB groups on cotton-Br.24 After the amination reaction, N 1s peak appeared in the XPS wide scan spectrum of ACF in Fig. 4(e). The N 1s core-level spectrum was subsequently sub-divided into two peaks in Fig. 4(f) at the binding energies of 398.9 and 400.9 eV, corresponding to the nitrogen in neutral amine and protonated amine groups, respectively.25 After copper ion adsorption with the ACF, the C 1s, O 1s, N 1s and a new peak Cu 2p appeared in the wide scan spectrum of ACF–Cu (Fig. 4(g)). The N 1s core-level spectrum of ACF–Cu was sub-divided into four peaks at the binding energies of 399, 399.7, 401.2 and 406.5 eV. Compared with Fig. 4(f), the new peak at 399.7 eV was attributed to the N element of the copper ion-coordinated amine, due to the electron-donating nature of the N element in the ACF–Cu coordination.26 The peak at 406.5 eV was attributed to the N element of the NO3− groups, which was present on the surface of ACF–Cu to balance the positive charges of the adsorbed copper ions and make the ACF–Cu in a neutral state.
O groups in the immobilized BIBB groups on cotton-Br.24 After the amination reaction, N 1s peak appeared in the XPS wide scan spectrum of ACF in Fig. 4(e). The N 1s core-level spectrum was subsequently sub-divided into two peaks in Fig. 4(f) at the binding energies of 398.9 and 400.9 eV, corresponding to the nitrogen in neutral amine and protonated amine groups, respectively.25 After copper ion adsorption with the ACF, the C 1s, O 1s, N 1s and a new peak Cu 2p appeared in the wide scan spectrum of ACF–Cu (Fig. 4(g)). The N 1s core-level spectrum of ACF–Cu was sub-divided into four peaks at the binding energies of 399, 399.7, 401.2 and 406.5 eV. Compared with Fig. 4(f), the new peak at 399.7 eV was attributed to the N element of the copper ion-coordinated amine, due to the electron-donating nature of the N element in the ACF–Cu coordination.26 The peak at 406.5 eV was attributed to the N element of the NO3− groups, which was present on the surface of ACF–Cu to balance the positive charges of the adsorbed copper ions and make the ACF–Cu in a neutral state.
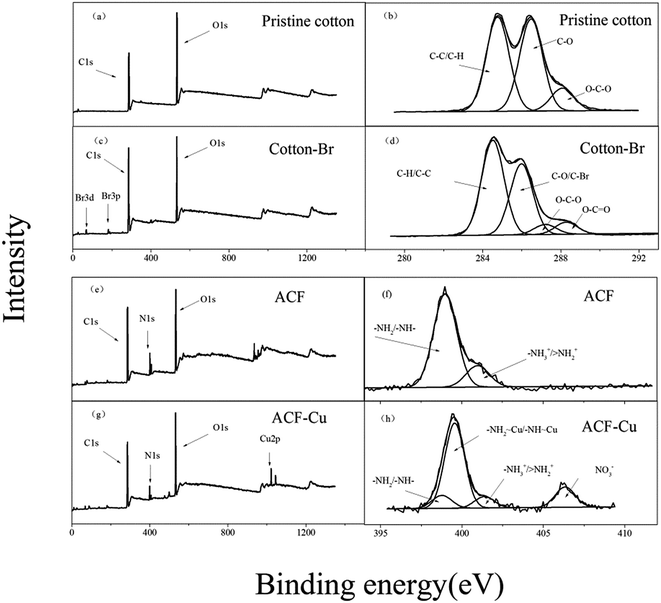 | ||
| Fig. 4 XPS wide scan spectra of (a) pristine cotton; (c) cotton-Br; (e) ACF and (g) ACF–Cu; C 1s spectra of (b) pristine cotton and (d) cotton-Br, and N 1s spectra of (f) ACF and (h) ACF–Cu. | ||
3.3 Visible sequestration of copper ions
The effect of pH values was investigated on the copper ion adsorption and detection performances. The absorbance (at 458 nm), adsorption capacity and the color changes of the ACF samples in response to copper ions with pH values range from 1 to 5 were shown in Fig. 5.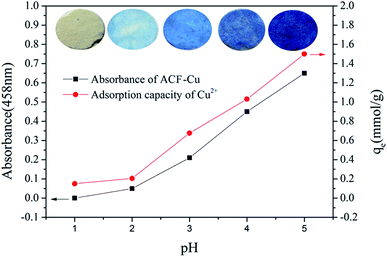 | ||
| Fig. 5 Absorbance (at 458 nm wavelength), adsorption capacity and color change of the ACF samples in response to copper ion solutions at different pH values. | ||
It was shown that both the absorbance of ACF–Cu and the adsorption capacity of ACF sample showed an increase with the increase of the pH value. At low pH value, the H+ with much higher concentration than the copper ions competed for the amine sites on ACF samples in solution, resulting in the protonated amines, which in turn prevented the approaching of copper ions through the strong electrostatic repulsion.27 It was observed from Fig. 5 that the ACF–Cu at pH 1 showed a while color with a small amount of copper ions adsorbed. The small amount of the adsorption capacity achieved at pH 1 was probably due to the physical adsorption of copper ions on the ACF. As the blue color was due to the formation of the amine–Cu complex on ACF–Cu, the white color of ACF–Cu at pH 1 indicated the strong protonation effect of amine sites which prevented the coordination of copper ions with ACF. Therefore, the white color of ACF–Cu at pH 1 was similar with the color of the ACF at 0.1 M HNO3 solution (protonated ACF at pH 1) (data not shown). As the pH increased, the effects of both the amine protonation and the electrostatic repulsion were decreased. As a result, the copper ion adsorption capacity showed an increase, with the formation of the amine–Cu complex, which resulted in the blue color of the ACF–Cu. Therefore, the color of the ACF–Cu turned from white (at pH 1) to blue (at pH > 2), and the reflectance intensity can be detected at 458 nm wavelength. The ACF samples could be used at the solution pH of 5 for better sensitivity and good adsorption capacity.
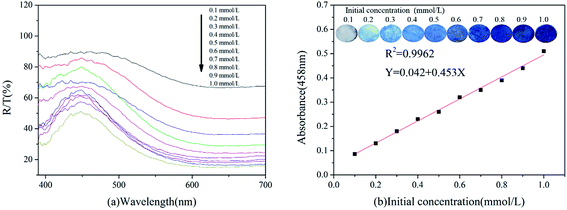
The reflectance spectra of the ACF–Cu after copper ion adsorption with different initial copper ion concentrations ranging from 0.1–1.0 mmol L−1 were shown in Fig. 6(a). It could be seen that the strong reflectance intensity at 458 nm wavelength appeared, which was attributed to the blue color of ACF–Cu. The intensity of the reflectance spectra of the ACF–Cu clearly decreased as the copper ion initial concentration increased. At the meantime, it could be easily observed in the inset figure in Fig. 6(b) that the color of the ACF–Cu changed from light blue to dark blue as the concentration of copper ion increased from 0.1 mmol L−1 to 1.0 mmol L−1. Based on the derived result, a linear relationship was established for the absorbance versus the initial copper ion concentrations, with the linear fitting correlation coefficient R2 of 0.9962. Therefore, a simple and fast method for copper ion concentration determination was established using the derived linear relationship as the detection criterion. Compared with the traditional heavy metal ion concentration determination methods, this method presented much convenience in detection with the ACF sample. Besides, the copper ion concentration determination with the portable fiber optic spectrometer was easy in operation, which had practical application prospect in the field of emergent environmental monitoring and the wastewater treatment.
3.4 Adsorption performances
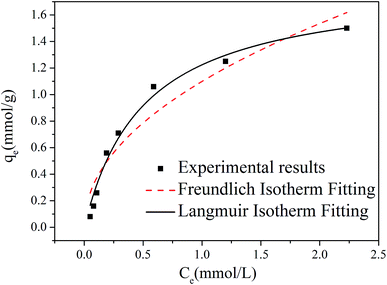
The copper ion adsorption isotherm with ACF samples was shown in Fig. 7. The experimental data were fitted with Langmuir and Freundlich isotherm models. The Langmuir model assumed a homogeneous surface for the adsorption, with a monolayer of the adsorbed substance. The Langmuir isotherm model equation was expressed as follows:
 | (3) |
The Freundlich model assumed a heterogeneous surface for the adsorption with multi-layer adsorbates on the surface. The Freundlich isotherm model equation was expressed as follows:
| qe = bFCe1/n | (4) |
The fitting results to the experimental data with the Langmuir and Freundlich isotherm models were shown in Fig. 7, with the calculated model parameters listed in Table 1. It could be seen that the Langmuir isotherm model fitted the data better with the correlation coefficient (R2) of 0.9815, which indicated a monolayer coverage on the ACF sample surface. The qm was derived to be 1.84 mmol g−1, indicating a good adsorption performance with great potentials for the treatment of heavy metal ions. The high adsorption capacity of copper ions on ACF sample would be attributed to the abundant amine groups on the surface of the ACF.
| Langmuir | Freundlich | ||||
|---|---|---|---|---|---|
| qm (mmol g−1) | bL (L mmol−1) | RL2 | bF (mmol1−1/n L1/n g−1) | n | RF2 |
| 1.84 | 1.9783 | 0.9815 | 1.0989 | 2.0730 | 0.9122 |
The copper ion adsorption kinetic behaviors with the ACF samples at different copper ion initial concentrations were shown in Fig. 8. Generally, the copper ion adsorption showed an initial sharp increase, followed by a steady plateau, with the increase of the adsorption time. In addition, the adsorption capacity of copper ions clearly increased with the increase of the initial copper ion concentrations. The results indicated that the amine binding sites for copper ions were abundant, and stronger driving force for mass transfer and the subsequent surface adsorption occurred at higher copper ion concentrations.28 In order to analyze the adsorption kinetics for copper ions, the pseudo-first-order (PFO) and pseudo-second-order (PSO) kinetic models were applied to fit the experimental data. The two kinetic equations were shown as follows:
ln(qe − qt) = −k1t + ln![[thin space (1/6-em)]](https://www.rsc.org/images/entities/char_2009.gif) qe qe
| (5) |
 | (6) |
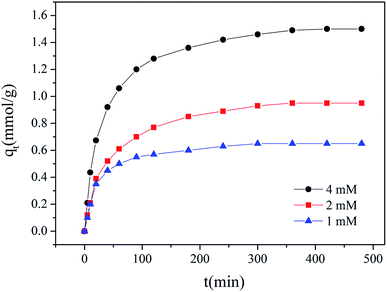 | ||
| Fig. 8 Copper ion adsorption kinetics with the ACF samples at different copper ion initial concentrations at pH 5. | ||
The model parameters derived from the fitting of the experimental data were summarized in Table 2. Experiment results suggested that the PSO model provided the best fitting of the experimental data with the correlation coefficient R2 of 0.9937–0.9996, which was higher than those of the PFO model. Furthermore, the values of qe obtained from the PSO model were in good agreement with the experimental data. Thus, the good fitting of the PSO model to the copper ion adsorption kinetics indicated that the adsorption of copper ion on ACF sample was dominated by chemical adsorption, in which the surface amine groups coordinated with copper ions through sharing the lone pair electrons of the nitrogen element in amine groups.
| Cu2+ | Pseudo-first-order (PFO) model | Pseudo-second-order (PSO) model | |||
|---|---|---|---|---|---|
| C0 (mmol L−1) | k1 (min−1) | R12 | qe (mmol g−1) | k2 (g (mmol−1 min−1)) | R22 |
| 4 | 0.0085 | 0.9736 | 1.5750 | 0.0160 | 0.9937 |
| 2 | 0.0118 | 0.9868 | 1.0380 | 0.0263 | 0.9995 |
| 1 | 0.0135 | 0.9503 | 0.6872 | 0.0401 | 0.9996 |
3.5 Interference experiments
The interference on the adsorption and detection of copper ions with ACF samples was investigated when Na+, Pb2+, Fe2+, Co2+, Ni2+ and Zn2+ ions as the interfering ions coexisted with Cu2+ ions in solution. The distribution constant (Kd), which was used to express the stability of metal–ligand complex, was calculated for both copper ion and other interfering ions.29 A higher Kd value usually indicated a more stable metal–ligand complex.30 The Kd was calculated according to the following eqn (7) and listed in Table 3.
 | (7) |
According to the Irving-Williams sequence,31 the stability of the complex of metal ion and nitrogen-contained ligand was in the order of Mn2+ < Co2+ < Fe2+ < Pb2+ < Ni2+ < Cu2+ > Zn2+, indicating that the complex of the amine group with Cu2+ ions was more stable. Furthermore, the stability constants (in log![[thin space (1/6-em)]](https://www.rsc.org/images/entities/char_2009.gif) K form) of the metal–DETA complex were listed in Table 4. The log
K form) of the metal–DETA complex were listed in Table 4. The log![[thin space (1/6-em)]](https://www.rsc.org/images/entities/char_2009.gif) K of Cu–DETA complex was much higher than that of Pb–DETA, Fe–DETA, Co–DETA, Ni–DETA and Zn–DETA complex, indicating the selective adsorption ability of the DETA immobilized on the ACF surface to Cu2+ ions in the solution when other interfering ions were present.
K of Cu–DETA complex was much higher than that of Pb–DETA, Fe–DETA, Co–DETA, Ni–DETA and Zn–DETA complex, indicating the selective adsorption ability of the DETA immobilized on the ACF surface to Cu2+ ions in the solution when other interfering ions were present.
![[thin space (1/6-em)]](https://www.rsc.org/images/entities/char_2009.gif) K of M–L complex) of heavy metal ions (M) with DETA (L)
K of M–L complex) of heavy metal ions (M) with DETA (L)
| Heavy metal ions | Stability constant (log![[thin space (1/6-em)]](https://www.rsc.org/images/entities/char_2009.gif) K)32 K)32 |
|---|---|
| Cu2+ | 15.9 ± 0.1 |
| Fe2+ | 6.23 |
| Co2+ | 8.0 ± 0.2 |
| Ni2+ | 10.5 |
| Pb2+ | 8.50 |
| Zn2+ | 8.80 |
3.6 Desorption experiments
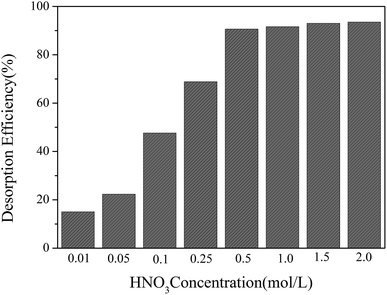
Desorption efficiency was an important parameter in evaluating the reusability of the adsorbents. In this study, HNO3 was used as the desorption agent. Fig. 9 showed the desorption efficiency of ACF–Cu at different concentrations of HNO3. The desorption efficiency increased as the HNO3 concentration gradually increased. When HNO3 concentration was higher than 0.5 mol L−1, the desorption efficiency almost kept constant and reached the maximum value of 93%. Therefore, 0.5 mol L−1 HNO3 was suitable for the desorption of copper ions.3.7 Repeated use experiments
In order to examine the repeated use performance of the ACF prepared in this study, we have carried out the 6-cycle adsorption–desorption–regeneration experiments for the copper ions, and the results were shown in Fig. 10. Both the adsorption capacity and the desorption efficiency were examined in Fig. 10, in an effort to comprehensively evaluate the repeated use performance of the ACF. The results showed that only a slight decrease occurred for both the adsorption capacity and the desorption efficiency during the six cycles, which demonstrated the good repeated use performance of the ACF for the application of copper ion removal.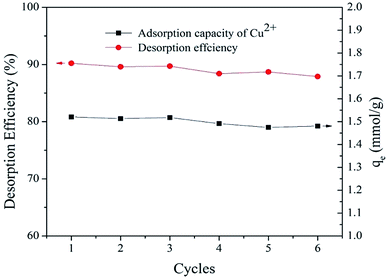 | ||
| Fig. 10 The copper ion desorption efficiency and adsorption capacity of ACF samples in six adsorption–desorption–regeneration cycles. | ||
4. Conclusions
In this paper, the functional cotton fiber (denoted as aminated cotton fiber, ACF), was prepared and used for the detection and adsorption of copper ions in solutions. XPS results indicated that copper ion was mainly complexed with amine groups of the ACF sample. The maximum adsorption capacity for copper ions on ACF sample was 1.84 mmol g−1, as obtained from the Langmuir isotherm model fitting. The copper ion adsorption kinetics with ACF in solutions with different initial copper ion concentrations was best described by the pseudo-second-order (PSO) kinetics model, indicating that chemical adsorption played a dominant role in the adsorption process. A linear relationship, which was used for the determination of copper ion concentrations, was established between the absorbance of ACF–Cu and the copper ion initial concentrations, with a correlation coefficient (R2) of 0.9962. Besides, the ACF sample also showed great adsorption selectivity to copper ions, and the presence of Na+, Pb2+, Zn2+ or Fe2+ showed no significant influence on the absorbance of ACF–Cu and the adsorption capacity of the ACF sample. Therefore, the ACF prepared in this study exhibited great practical potential for the simple detection and enhanced adsorption of copper ions in waters and wastewaters.Acknowledgements
This work was financially supported by Shenzhen Science and Technology Foundations (JCYJ20160308105200725, KQCX20140519103908550, JCYJ20140418095735550, ZDSYS20160606153007978), and the National Natural Science Foundation of China (21307083).References
- V. Desai and S. G. Kaler, Role of copper in human neurological disorders, Am. J. Clin. Nutr., 2008, 88, 855–858 Search PubMed.
- Y. Yu, J. G. Shapter and R. Popelka-Filcoff, Copper removal using bio-inspired polydopamine coated natural zeolites, J. Hazard. Mater., 2014, 273, 174–182 CrossRef CAS PubMed.
- H. D. Ozsoy and H. Kumbur, Absorption of Cu(II) ions on cotton boll, J. Hazard. Mater., 2006, 136, 911–916 CrossRef CAS PubMed.
- W. Yantasee, Y. Lin, G. E. Fryxell, K. L. Alford, B. J. Busche and C. D. Johnson, Selective removal of copper(II) from aqueous solutions using fine-grained activated carbon functionalized with amine, Ind. Eng. Chem. Res., 2004, 43, 2759–2764 CrossRef CAS.
- K. Thirugnanasambandham and V. Sivakumar, An eco-friendly approach for copper(II) ion adsorption onto cotton seedcake and its characterization: simulation and validation, J. Taiwan Inst. Chem. Eng., 2015, 50, 1–7 CrossRef.
- D. W. O'Connell, C. Birkinshaw and T. F. O'Dwyer, Heavy metal adsorbents prepared from the modification of cellulose: a review, Bioresour. Technol., 2008, 99, 6709–6724 CrossRef PubMed.
- J. C. Y. Ng, W. H. Cheung and G. McKay, Equilibrium studies of the sorption of Cu(II) ions onto chitosan, J. Colloid Interface Sci., 2002, 255, 64–74 CrossRef CAS PubMed.
- N. Li, R. Bai and C. Liu, Enhanced and selective adsorption of mercury ions on chitosan beads grafted with polyacrylamide via surface-initiated atom transfer radical polymerization, Langmuir, 2005, 21, 11780–11787 CrossRef CAS PubMed.
- J. Yang, Y. Wang and T. Tang, Synthesis and adsorption properties for metal ions of mesocyclic diamine grafted chitosan-crown ether, J. Appl. Polym. Sci., 2000, 75, 1255–1260 CrossRef.
- Y. Zhu, A. Iton, T. Umemura, H. haraguchi, K. Inagaki and K. Chiba, Determination of REEs in natural water by ICP-MS with the aid of an automatic column changing system, J. Anal. At. Spectrom., 2010, 25, 1253–1258 RSC.
- P. Li, X. Duan, Z. Chen and Y. Liu, A near-infrared fluorescent probe for detecting copper(II) with high selectivity and sensitivity and its biological imaging applications, Chem. Commun., 2011, 47, 7755–7757 RSC.
- X. X. Liu, X. J. Liu, M. L. Tao and W. Q. Zhang, A highly selective and sensitive recyclable colorimetric Hg2+ sensor based on the porphyrin functionalized polyacrylonitrile fiber, J. Mater. Chem. A, 2015, 3, 13254–13262 CAS.
- C. Liu, X. Liang, J. Liu, Y. Liu, J. Luo and H. Zhu, Efficient removal of Cd(II) ions from aqueous solution via visible capturing, RSC Adv., 2016, 6, 38430–38436 RSC.
- T. Hajeeth, K. Vijayalakshmi, T. Gomathi, P. N. Sudha and S. Anbalagan, Adsorption of copper(II) and nickel(II) ions from aqueous solution using graft copolymer of cellulose extracted from the sisal fiber with acrylic acid monomer, Compos. Interfaces, 2014, 21, 75–86 CrossRef CAS.
- C. Liu, X. Liang, J. Liu, X. Lei and X. Zhao, Preparation of the porphyrin-functionalized cotton fiber for the chromogenic detection and efficient adsorption of Cd2+ ions, J. Colloid Interface Sci., 2017, 488, 294–302 CrossRef CAS PubMed.
- M. Monier, M. A. Akl and W. M. Ali, Modification and characterization of cellulose cotton fibers for fast extraction of some precious metal ions, Int. J. Biol. Macromol., 2014, 66, 125–134 CrossRef CAS PubMed.
- W. D. Schecher and D. C. Mcavoy, MINEQL+: Chemical Equilibrium Modeling System, Version 4.5 for Windows, Environmental Research Software, Hallowell, ME, 2003 Search PubMed.
- C. Liu, X. Liang, J. Liu and W. Yuan, Desorption of copper ions from the polyamine-functionalized adsorbents: behaviors and mechanisms, Adsorpt. Sci. Technol., 2016, 34, 455–468 CrossRef CAS.
- C. Yuan, M. Cui and L. Feng, Efficient removal of Cu(II) using amino-functionalized superparamagnetic nanoparticles prepared via SI-ATRP, J. Appl. Polym. Sci., 2015, 1, 42859 Search PubMed.
- E. Yavuz, G. Bayramoglu, B. F. Şenkal and M. Yakup Arıca, Poly(glycidylmethacrylate) brushes generated on poly(VBC) beads by SI-ATRP technique: hydrazine and amino groups functionalized for invertase adsorption and purification, J. Chromatogr. B: Anal. Technol. Biomed. Life Sci., 2009, 877, 1479–1486 CrossRef CAS PubMed.
- F. Tang, L. Zhang and Z. Zhang, Cellulose filter paper with antibacterial activity from surface-initiated ATRP, J. Macromol. Sci., Part A: Pure Appl. Chem., 2009, 26, 989–996 CrossRef.
- S. Deng, Y. Zheng, F. Xu, B. Wang, J. Huang and G. Yu, Highly efficient sorption of perfluorooctane sulfonate and perfluorooctanoateon a quaternized cotton prepared by atom transfer radical polymerization, Chem. Eng. J., 2012, 193, 154–160 CrossRef.
- B. Debora, M. Giancarlo, D. L. Piero, M. Luisa, C. Donatella and V. Crescenzi, Versatile grafting of polysaccharides in homogeneous mild conditions by using atom transfer radical polymerization, Biomacromolecules, 2006, 7, 2154–2161 CrossRef PubMed.
- A. Friebe and M. Ulbricht, Controlled pore functionalization of poly(ethylene terephthalate) track-etched membranes via surface-initiated atom transfer radical polymerization, Langmuir, 2007, 23, 10316–10322 CrossRef CAS PubMed.
- C. Liu, R. Bai and L. Hong, Diethylenetriamine-grafted poly(glycidyl methacrylate) adsorbent for effective copper ion adsorption, J. Colloid Interface Sci., 2006, 303, 99–108 CrossRef CAS PubMed.
- Y. Zheng, S. Deng, L. Niu, F. Xu, M. Chai and G. Yu, Functionalized cotton via surface-initiated atom transfer radical polymerization for enhanced sorption of Cu(II) and Pb(II), J. Hazard. Mater., 2011, 192, 1401–1408 CrossRef CAS PubMed.
- Y. Tang, Q. Ma, Y. Luo, L. Zhai, Y. Che and F. Meng, Improved synthesis of a branched poly(ethylene imine)-modified cellulose-based adsorbent for removal and recovery of Cu(II) from aqueous solution, J. Appl. Polym. Sci., 2013, 129, 1799–1805 CrossRef CAS.
- Y. Yu, B. N. Murthy, J. G. Shapter, K. T. Constantopoulos, N. H. Voelcker and A. V. Ellis, Benzene carboxylic acid derivatized graphene oxide nanosheets on natural zeolites as effective adsorbents for cationic dye removal, J. Hazard. Mater., 2013, 260, 330–338 CrossRef CAS PubMed.
- W. Chouyyok, Y. Shin, J. Davidson, W. D. Samuels, N. H. Lafemina, R. D. Rutledge and G. E. Fryxell, Selective removal of copper(II) from natural waters by nanoporous sorbents functionalized with chelating diamines, Environ. Sci. Technol., 2010, 44, 6390–6395 CrossRef CAS PubMed.
- J. Kim, A. J. Leong, L. F. Lindoy, J. Kim, J. Nachbaur, A. Nezhadali, G. Rounaghi and G. Wei, Metal–ion recognition. Competitive bulk membrane transport of transition and post transition metal ions using oxygen–nitrogen donor macrocycles as ionophores, J. Chem. Soc., Dalton Trans., 2000, 19, 3453–3459 RSC.
- C. V. Diniz, V. S. T. Ciminelli and F. M. Doyle, The use of the chelating resin Dowex M-4195 in the adsorption of selected heavy metal ions from manganese solutions, Hydrometallurgy, 2005, 78, 147–155 CrossRef CAS.
- R. M. Smith and A. E. Martell, Critical Stability Constants, Springer, Amines, 1975, vol. 2 Search PubMed.
| This journal is © The Royal Society of Chemistry 2017 |

