 Open Access Article
Ammonium level induces high purity propionate production in mixed culture glucose fermentation
Yun Chena,
Nan Shenb,
Ting Wanga,
Fang Zhangc and
Raymond J. Zeng*a
aCAS Key Laboratory of Urban Pollutant Conversion, Department of Chemistry, University of Science and Technology of China, Hefei, Anhui 230026, People's Republic of China. E-mail: rzeng@ustc.edu.cn; Fax: +86-551-63600203
bSchool of Environmental Engineering and Science, Yangzhou University, 196 West Huayang Road, Yangzhou, Jiangsu 225127, People's Republic of China
cHebei Key Laboratory of Applied Chemistry, School of Environmental and Chemical Engineering, Yanshan University, Qinhuangdao, Hebei 066004, People's Republic of China
First published on 3rd January 2017
Abstract
Propionate is an important chemical widely applied in industry and its production via fermentation is economic. Many literature studies have reported propionate was produced with pure culture fermentation. However, the following by-products production in pure culture fermentation limits its application. In this work, a high purity of propionate production from glucose in mixed culture fermentation (MCF) under the condition of high ammonium concentration was first investigated. The bottle tests showed that up to 1.4 g L−1 of ammonium severely inhibited propionate degradation but had little effect on acetate degradation. In fed-batch experiments, propionate was produced with more than 16 g L−1 concentration and the purity reached more than 90% of liquid metabolites. Under the sequential batch operation, the propionate yield was 0.37–0.47 g COD per g COD and propionate accounted for 98% of liquid metabolites. The microbial community analysis revealed that Betaproteobacteria and Deltaproteobacteria, the propionate-utilizing microbes, were decreased from 7.94% to 3.72% at high ammonium levels, while Methanosaeta that mainly appeared at high ammonium concentration in the literature was the dominating aceticlastic methanogen. Hence, this work demonstrates a great potential application of MCF to effectively produce high purity propionate.
1. Introduction
Propionic acid is an important chemical intermediate and its calcium-, sodium-, ammonium-salts are widely used as preservatives in feedstock, food and pharmaceuticals. It is also incorporated into cellulose plastics, herbicides, perfume bases and a range of other products. In addition, according to the US Department of Energy, propionic acid is one of the top 30 candidate platform chemicals employed as building blocks for products, and the capacity of propionic acid in 2006 was 770 million pounds with an annual growth of 2.5%.1–3 Current industrial production of propionic acid is via chemical synthesis from petrochemical raw materials, such as the oxo-synthesis route from ethylene and carbon monoxide followed by liquid-phase oxidation of the resulting aldehyde, oxidation of propane gas or from propionitrile.4,5 However, with the depletion of petroleum, rising oil price, environmental burden of fossil fuel production and public's preference for biobased chemicals, propionic acid production from renewable biomass via fermentation is an alternatively renewable route and has attracted increasing attention in recent years.4,6,7 Propionic acid could be efficiently produced through pure culture fermentation, such as Zhang et al.8 reported the highest propionic acid production reached 100 g L−1 in a fibrous-bed bioreactor with an engineered Propionibacterium acidipropionici and Zhu et al.9 showed the maximum propionic acid production was 47.28 ± 0.12 g L−1 at 240 h in a 10 m3 bioreactor. However, pure culture fermentation has a lot of disadvantages compared to mixed culture fermentation (MCF), such as strict sterilization requirements, more by-products, limiting substrates.10 All these aspects significantly increase the costs of pure culture fermentation compared to mixed culture based industrial fermentation.11,12 So, propionic acid production in MCF becomes an attractive route.10Anaerobic digestion (AD) consists of multiple steps including hydrolysis, acidogenesis, acetogenesis, and methanogenesis in MCF.13 Normally, volatile fatty acids (VFAs), such as propionic acid, acetic acid, and butyric acid, produced by acidogens and acetogens, can be immediately utilized by some syntrophic fatty acid oxidizing bacteria and methanogens for methane production, leaving a low VFA concentration in the effluent.14,15 However, these VFAs, especially propionate and acetate, would be accumulated when suffering from any shock, e.g., increasing of organic loading rate, temperature fluctuation, pH variation and high ammonium level.16,17 Therefore, the operating conditions must be controlled carefully in order to produce a higher yield and purity of special VFAs (e.g., acetate and propionate) in MCF which could reduce the cost of separation and purification processes.18
So far there is only one report about the production of high purity propionate and methane via MCF.19 As reported by this study, the optimal ammonium concentration (>0.5 and <2.9 g L−1) could efficiently inhibit propionate oxidizing bacteria (POB) but not aceticlastic methanogens in MCF. Furthermore, several studies implicated that other ammonium concentration could be utilized to inhibit POB. For example, Zamanzadeh et al.20 reported accumulation of propionate and detection of little acetate when 2.2 g L−1 ammonium was employed. Zhao et al.21 found that ammonium concentration (>1.17 and <2.35 g L−1) had more serious impact on propionate oxidation than on acetate oxidation. Until now, no reports on high-purity propionate production from glucose via MCF have been reported. Therefore, the goal of this study was to investigate efficient propionate production from glucose in MCF with ammonium inhibition. The objectives of this work were achieved via (i) the bottle tests to find the optimal ammonium concentration; (ii) evaluating the metabolite distribution and the maximum propionate concentration in a fed-batch reactor; (iii) determining the stoichiometry of metabolites and the propionate purity in bulk solution of sequential batch mode; and (iv) analyzing the microorganism communities of bacteria and archaea in fed-batch. It is expected that this study will contribute to the development of valuable chemicals production from glucose in MCF.
2. Materials and methods
2.1 Batch experiments in serum bottles
Three groups of experiments were conducted in 165 mL serum bottles, which contained 50 mL medium and 1 g L−1 carbon source (sodium acetate, sodium propionate and glucose, respectively). The composition of medium was 50 mM phosphate buffered saline (PBS) with major and trace elements described in Zhang's study.11 The composition of PBS solution (in 1.0 L distilled water) was K2HPO4·3H2O 6.58 g, and KH2PO4 2.88 g, the pH was at 7. The serum bottles were inoculated with 10 mL of anaerobic sludge from a local mesophilic expanded granular sludge bed reactor treating starch wastewater located in Zhouping, Shandong Province, China.22 The inoculum was sieved to break granular sludge and remove sand, and the initial biomass concentration in the experiments was about 0.4 g L−1. After being purged with N2 (99.99%) to ensure anaerobic conditions, the serum bottles were sealed with butyl rubber stoppers and aluminum caps. All the experiments were conducted at 35 °C in a shaker with the speed of 100 rpm. The effect of ammonium concentration was investigated with five gradients: (1) 0.14 g L−1 (2) 0.28 g L−1 (3) 0.7 g L−1 (4) 1.4 g L−1 (5) 2.8 g L−1. All the tests above were carried out in duplicate. The removal efficiency of glucose, acetate and propionate at 0.14 g L−1 was supposed to 100%. The removal efficiency under other conditions was calculated based on the condition of 0.14 g L−1.2.2 Fed-batch and sequential batch fermentation in the bioreactor
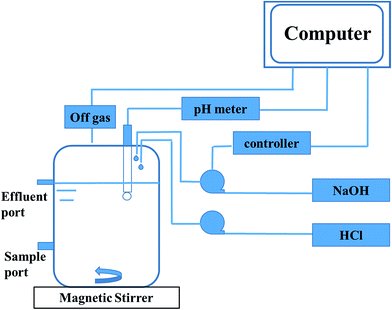
Anaerobic sludge used in the reactor was the same to the ones in the serum bottles. The inoculum was sieved to break granular sludge and remove sands. Then it was stripped with nitrogen (99.99%) for 20 min before inoculation. The total volume of the reactor was 2.0 L and the working volume was 1.25 L (Fig. 1). The stirring velocity was 360 rpm and the pH was controlled at 7.0 with automatic dosage of 2 M HCl or 2 M NaOH. 3.0 g and 5.0 g glucose were fed during 0–17 days and 18–45 days, respectively. 1 g ammonium chloride was added every day until the concentration was equal to 1.5 g L−1. The concentrations of metabolites and glucose in liquid solution were monitored every day, while the gas content was measured at least every two days.The sequential batch reactor was the same to fed-batch. The working volume was 1.5 L. The reactor was firstly operated in a batch mode, when the propionate concentration was up to 8 g L−1, then the sequential batch was applied. Before the new phase began, the stirrer was turned off for 30 min to collect the biomass by precipitation and 0.5 L of liquid supernatant was withdrawn by replacing with an equal volume of fresh medium that contained 13 g glucose and 1.5 g ammonium chloride. The stirring velocity was 360 rpm and the pH was controlled at 7.0. The concentrations of metabolites and glucose in liquid solution were determined at least every 10 hours.
2.3 Chemical analysis
The concentrations of VFAs and ethanol were measured by a Gas Chromatograph (Agilent 7890, CA) with a flame ionization detector and a 30 m × 0.25 mm × 0.5 μm DB-FFAP fused-silica capillary column. The column operating temperature profile was 70 °C for 3 min, then 10 °C min−1 to 180 °C, hold for 4.5 min. The injector and detector temperatures were 250 °C and 300 °C, respectively. The samples were filtered with 0.45 μm microfilter membrane and then acidified with 3 w/v% formic acid before analysis. The sample injection volume was 1.0 μL. The calculation of propionate purity in the liquid phase was the propionate concentration divided by the total VFA concentrations.Glucose, lactic and formic acids, succinic acid were analyzed with a high performance liquid chromatograph (HPLC, Agilent 1260 Infinity, CA) with a refractive index detector and an Aminex HPX-87 chromatographic column. The chromatographic column temperature was 45 °C. The mobile phase was 5% sulfuric acid (HPLC grade) and the flow velocity was controlled at 0.5 mL min−1. Ammonium was analyzed using a water quality autoanalyzer (ThermoFisher, Aquakem 200, Finland) based on the hydrazine reduction method, which was described in Fu's study.23
The produced biogas was recorded daily by a gas meter.24 The content of hydrogen in the headspace was determined with a Gas Chromatograph (Lunan model SP7890, China) equipped with a thermal conductivity detector and a 1.5 m stainless steel column packed with 5 Å molecular sieve. The temperatures of the injector, detector, and column were kept at 100, 100, and 50 °C, respectively. Nitrogen was used as the carrier gas. The contents of methane and carbon dioxide in the headspace were analyzed with the same gas chromatograph, but the temperatures of the injector, detector, and column were kept at 130, 130, and 120 °C, respectively. Hydrogen was used as the carrier gas.
Mixed liquor volatile suspended solid was determined as the biomass concentration by the standard method.25 The COD balance calculation was based on the COD of each metabolite concentration. Each metabolite of COD was calculated based on the following coefficients: 382.25 mL CH4 per g COD at 25 °C, 1.07 g COD per g acetate, 1.51 g COD per g propionate, 1.81 g COD per g butyrate, 1.06 g COD per g glucose.
2.4 DNA extraction and illumina high-throughput sequencing
At the end of the fed-batch operation, the biomass was collected from the effluent and washed with the PBS solution at pH 7.4. The DNA was isolated from raw sludge (R1) and collected biomass (R2) using the DNA extraction Kit according to the manufacturer's instructions (Biocolor, Shanghai, China). The isolated DNA was stored at −20 °C. Bacterial universal primers Nobar 341F (CCTACGGGNGGCWGCAG) and Nobar 805R (GACTACHVGGGTATCTAATCC) were used to amplify the V3–V4 regions of bacterial 16S rDNA. Double amplifications were conducted in order to reduce the negative effect of the bacteria on archaeal amplification, the first primer: 340F (CCCTAYGGGGYGCASCAG) and 1000R (GGCCATGCACYWCYTCTC), and the second primer: 349F (GYGCASCAGKCGMGAAW) and 806R (GGACTACVSGGGTATCTAAT), were used.26 High-throughput sequencing of the DNA samples for bacterial and archaeal communities was performed on an Illumina Miseq platform by Sangon (Shanghai, China). The sequencing data of the two samples were archived in NCBI Sequence Read Archive (SRA) with the accession numbers of SRS1346018 (R1) and SRS1346019 (R2).3. Results and discussion
3.1 Degradation of glucose, acetate, propionate under different ammonium concentrations
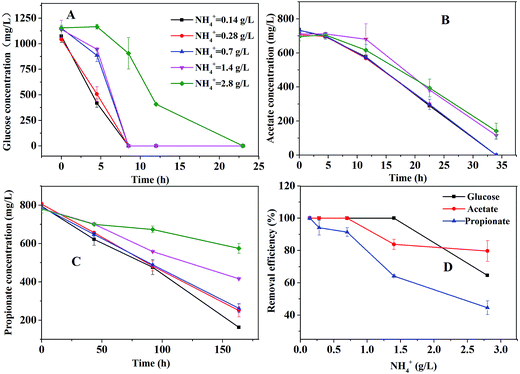
The bottle tests were performed in order to investigate the effect of ammonium concentration on the degradation of glucose, acetate, or propionate. The consumption profiles of glucose, acetate, or propionate are shown in Fig. 2. As depicted in Fig. 2A, glucose was totally consumed in 25 hours. The ammonium concentration had no effect on glucose degradation below 1.4 g L−1 but had partial inhibitory to glucose degradation at 2.8 g L−1. As Fig. 2B shown, the ammonium concentration below 0.7 g L−1 caused no failure of acetate degradation but 1.4 g L−1 slowed down the degradation rate distinctly. Nevertheless, acetate was almost consumed within 35 hours under all the conditions. Propionate could be still detected in the bottle tests after 160 hours even under the condition of 0.14 g L−1 ammonium (Fig. 2C). The higher ammonium concentration resulted in the slower propionate degradation rate. Compared to glucose and acetate degradation, propionate degradation was much more sensitive for ammonium inhibition. The removal efficiency of glucose, acetate and propionate under different ammonium conditions is shown in Fig. 2D. The propionate removal efficiency was seriously affected by ammonium concentrations. Glucose and acetate were partly inhibited when the ammonium concentration increased to 1.4 g L−1. Apparently, 1.4 g L−1 ammonium could severely inhibit the degradation of propionate but had slight effect on the degradation of acetate.Thermodynamically, aceticlastic methanogen can get much more energy for the growth than POB, resulting in lower propionate degradation.19 Furthermore, many researchers have stated that propionate degradation depends on the activities of POB, which are slow-growth microorganisms27 and sensitive to reactor operating conditions.16 Hence, the propionate degradation rate was slower than the acetate degradation rate at the low ammonium concentration (<1.5 g L−1) in this study. However, at a high ammonium concentration (>1.5 g L−1), compared to the low ammonium concentration, the degradation rates of acetate and propionate were both slower and the propionate degradation rate was still slower than the acetate degradation rate. It indicated that POB and methanogenic archaea were more sensitive to higher ammonium level. The similar result was obtained by Calli et al.28 and Rajagopal et al.29 at the higher ammonium concentration (>3 g L−1). Hence, it should be noted that the ammonium concentration must be controlled appropriately to inhibit the activity of POB but not aceticlastic methanogens.
3.2 Fed-batch experiments for high fraction propionate production
To evaluate the maximum potential concentration of high purity propionate production in MCF, the experiments in the fed-batch reactor was conducted, in which propionate dominated the metabolites (Fig. 3). Meanwhile, other common metabolites like acetate, formate, and butyrate were not detected before day 35.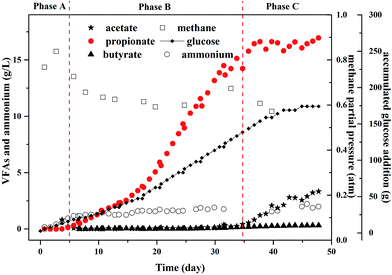 | ||
| Fig. 3 Profiles of propionate and other metabolites under glucose fermentation in a fed-batch reactor. | ||
In phase A, there was no propionate and acetate in the effluent and the gas production rate was 1.04–1.24 L per day and the methane yield was equal to 0.88 g COD per g COD glucose (Table 1). The methane partial pressure (PCH4) increased to 0.83 atm and H2 was not detected at the end of phase A. The ammonium concentration ranged from 0.16 to 0.6 g L−1 during phase A that did not inhibit the propionate and acetate degradation, thus glucose was totally converted to methane.
| Phase | COD balance | Consumed glucose (COD) | The yields of metabolites (g COD per g COD glucose consumed) | |||
|---|---|---|---|---|---|---|
| Acetate | Propionate | Butyrate | Methane | |||
| A | 88.33% | 7.59 | 0 | 0 | 0 | 0.88 |
| B | 93.97% | 121.85 | 0 | 0.22 | 0 | 0.72 |
| C | 88.59% | 37.07 | 0.1 | 0.14 | 0.01 | 0.63 |
In phase B, the ammonium concentration increased from 0.94 g L−1 to 1.5 g L−1 gradually and maintained at 1.5 g L−1 for days 5–35. This ammonium concentration was recommended in the bottle tests. The PCH4 decreased obviously to 0.63 atm and H2 was not detected as ever, which indicated the high ammonium concentration affected the activity of archaea that used acetate to produce methane, i.e., aceticlastic methanogens. At the end of this period propionate accumulated to 16 g L−1 and the purity reached more than 99% in liquid solution. In addition, there was no acetate detected in the reactor. The propionate production rate was 0.45 g (L−1 d−1).
In phase C, the ammonium concentration maintained at 1.5 g L−1 and the PCH4 decreased below 0.6 atm and H2 was still not detected. The further glucose addition did not increase the propionate concentration anymore. However, acetate began to accumulate in this period, which indicated the high propionate concentration could inhibit the growth of methanogens.30 According to the results reported by Calli et al.,28 more than 50% inhibition of methane production occurred when propionate was more than 3.5 g L−1. Moreover, another study found that significant inhibition appeared and the methanogenic activity would not be recovered when the propionate concentration increased to 0.9 g L−1,31 in which the propionate production yield was 0.1 g COD per g COD glucose that was far less of the ones in this study.
Table 1 demonstrates the COD balance under different phases in fed-batch experiments. The COD balance ranged from 88 to 94%. Usually, 10% of consumed glucose was converted into biomass in MCF.32 Hence it indicated that main metabolites of glucose were included and detected accurately. The yields of propionate were 0, 0.22, and 0.14 g COD per g COD glucose in phase A, B and C, respectively. Acetate and butyrate production could be ignored. The influent COD was converted to methane mostly, i.e., 88, 72, and 63% in phase A, B and C, respectively.
3.3 Sequential batch fermentation in the bioreactor
In order to improve the propionate yield from glucose in MCF, the sequential batch mode was conducted and four consecutive phases were investigated. As shown in Fig. 4, propionate dominated the metabolites and the glucose concentration was less than 0.1 g L−1 at the end of every cycle. Meanwhile, no other VFAs (except acetate, propionate and butyrate) were detected during the whole operational period.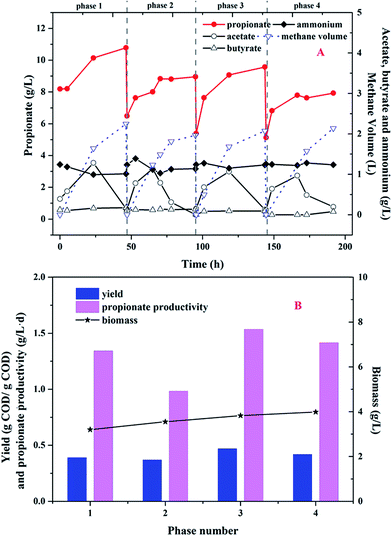 | ||
| Fig. 4 (A) Metabolite profiles of glucose fermentation in sequential batch mode; (B) the propionate yield and productivity. | ||
As shown in Fig. 4A, the ammonium concentration maintained at 1.2 g L−1 in the first cycle. Acetate as the intermediate metabolite was accumulated to a maximum value of 1.3 g L−1 at 23.5 h. After 23.5 h, acetate began to degrade and converted to methane and carbon dioxide. So, the methane volume was increased to 2.2 L at the end of the cycle. Propionate production was continued to increase and kept to 10.8 g L−1 during the cycle. In the following 3 sequential cycles, the similar tendency about acetate and propionate production was found. Therefore, there was little acetate detected in the effluent and the purity of propionate in the liquid solution was up to 98% during the whole period. As shown in Fig. 4B, the propionate yield was 0.37–0.47 g COD per g COD glucose and the propionate productivity was between 0.98 and 1.54 g (L−1 d). Although the biomass density continued to increase from 3.2 g L−1 to 4.0 g L−1, the propionate yield and productivity were not improved obviously.
3.4 Microbial community of fed-batch experiments
Fig. 5 presents the bacterial community analysis of R1 and R2. At the phylum level (Fig. 5A), the raw sludge bacterial community was more diverse as treating starch wastewater, and Proteobacteria was the most abundant phyla (46% of relative abundance). While, Bacteroidetes dominated the microbial community of R2 (41%), followed by Firmicutes (17%) and Synergistetes (15%). In agreement with the Tang's study, it revealed that Bacteroidetes, Firmicutes, and Spirochaetes were among the most abundant phyla treating glucose at the dilution rate of 0.05 d−1.33 Besides, Bacteroidetes and Firmicutes are responsible for polysaccharide hydrolysis and fermentation. At the class level shown in Fig. 5B, Betaproteobacteria and Deltaproteobacteria that are the propionate-utilizing microbial communities34 were decreased from 7.94% to 3.72%. It indicated that the higher ammonium concentration led to the slower propionate consumption.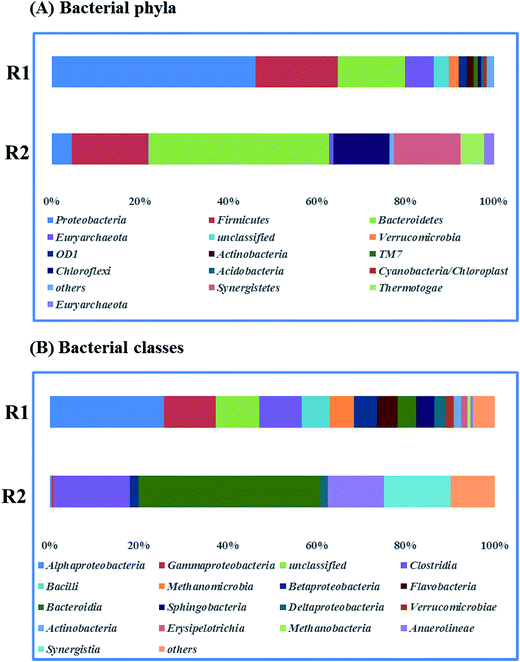 | ||
| Fig. 5 Taxonomic compositions of bacterial communities (raw sludge (R1) and propionate-producing sludge (R2)) at two levels (A) phyla, (B) classes. | ||
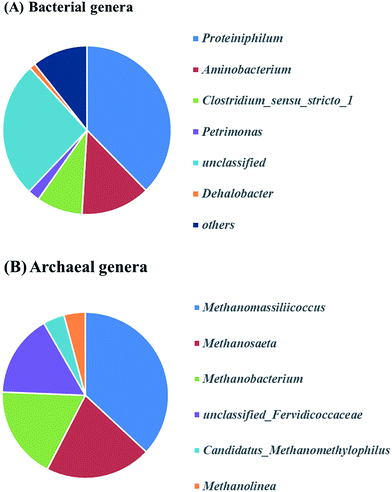
Fig. 6A describes the bacteria of propionate-producing sludge at the genus level. There were five genera (Proteiniphilum, Aminobacterium, Clostridium_sensu_stricto_1, Petrimonas, Dehalobacter) with high relative abundance. Proteiniphilum and Aminobacterium reported to be capable to degrade protein were dominated. This may be due to the high ammonium concentration in our study which needs further investigation. Clostridium_sensu_stricto_1, particularly producing acetate, propionate and butyrate from glucose fermentation, was found to have 9% relative abundance that matched with the reactor performance. The relative abundance of methanogens was identified at the genus level (Fig. 6B). Methanomassiliicoccus, Methanosaeta and Methanobacterium were dominated in the archaeal community (75%). Genera (e.g. Methanobacterium and Methanomassiliicoccus) were hydrogenotrophic methanogens, which can reduce CO2 to CH4 with H2 as the primary electron donor. Methanosaeta which belong to aceticlastic methanogens can only covert acetate to methane and carbon dioxide.35 Whereas another aceticlastic methanogen Methanosarcina, which can also utilize acetate, as well as hydrogen and carbon dioxide for methane production, was not found in the reactor.
In this study, the community analysis of archaea showed that Methanosaeta was the major aceticlastic methanogen. The similar result was obtained in Schnürer's study,36 which reported that Methanosaeta was the main aceticlastic methanogen with the ammonium concentration below 1.5 g L−1. Furthermore, the lower Ks value and higher affinity of Methanosaeta to acetate lead to little acetate accumulation in MCF.37–40
3.5 High-purity propionate production in fermentation
Compared to the propionate purity in this study (98%), pure culture fermentation generated lots of by-products (e.g., acetate and succinate) and the propionate purity was below 80%. For example, Zhang et al.8 reported a propionate purity of 75.4% and Wang et al.41 showed a propionate purity of 78.2% in pure culture fermentation. Obviously, lower propionate purity (<40%) was also obtained in other MCF systems except our previous report (Table 2). Therefore, it would be an attractive way to produce propionate from carbohydrate in our study as the withdrawn liquid could be easily subjected to downstream processing.| Strain | Operational mode | PA yield (g COD per g COD) | Purity (%) |
|---|---|---|---|
| Engineered Propionibacterium acidipropionici8 | Batch | 0.74 | 75.4 |
| Propionibacterium acidipropionici41 | Sequential batch | 0.87 | 78.2 |
| Propionibacterium acidipropionici46 | Batch | 0.45 | 70.4 |
| Propionibacterium acidipropionici3 | Fed-batch | 0.60 | 71.1 |
| Mixed cultures44 | CSTR | 0.31 | 37.3 |
| Mixed cultures47 | CSTR | 0.15 | 15.2 |
| Mixed cultures19 | Sequential batch | 0.30–0.34 | 91–100 |
| Mixed cultures (this study) | Sequential batch | 0.37–0.47 | 98–100 |
In this study, the propionate yield was 0.22 g COD per g COD glucose and the maximum concentration was 16 g L−1 in fed-batch tests. Unlike the fed-batch mode, the sequential batch mode presented a higher propionate yield (i.e., 0.37–0.47 g COD per g COD glucose). It indicates that replacing 0.5 L of the fermentation broth with an equal volume of fresh medium is advantageous for removing most of the inhibitory products (such as high propionate concentration), it may improve the propionate yield.6,41 However, a relatively low propionate yield was obtained in MCF compared to pure culture fermentation (Table 2). It was reported that using the more reduced substrate (i.e., glycerol) could improve the propionate yield in pure fermentation.42 However, higher propionate yield using glucose in this study was obtained comparing to our previous study using glycerol (Table 2). It might indicate the difference between MCF and pure culture fermentation.
Usually, the theoretical value of propionic acid (PA) yield in MCF is between 0.19 and 0.77 g COD per g COD glucose (Table 3) and the maximum theoretical value of PA yield from glucose is 0.77 g COD per g COD if propionate as intermediate product is not degraded. However, 0.37–0.47 g COD per g COD was achieved in sequential batch mode, which was still far less than the maximum theoretical value. It indicates that propionate degradation was not totally inhibited by ammonium alone, resulting in some propionate converted to methane. Furthermore, the different PA yields (0.37–0.47 g COD per g COD) were achieved in sequential batch mode, indicating that the different pathways were occurred in the reactor (Table 3). Hence, more efforts on metabolic regulation are needed to improve the propionate yield in MCF such as applying protein as substrate,43 changing the temperature, maintaining pH at 8 (ref. 44) and controlling the ORP between −200 and 100 mV.45
| Reaction | PA yield (g COD per g COD) | CH4 yield (g COD per g COD) |
|---|---|---|
| 3C6H12O6 = C3H6O2 + 7.75CH4 + 7.25CO2 + 0.5H2O | 0.19 | 0.81 |
| 3C6H12O6 = 2C3H6O2 + 5.5CH4 + 6.5CO2 + H2O | 0.39 | 0.61 |
| 3C6H12O6 = 3C3H6O2 + 3.75CH4 + 5.25CO2 + 1.5H2O | 0.58 | 0.42 |
| 3C6H12O6 = 4C3H6O2 + 2CH4 + 4CO2 + 2H2O | 0.77 | 0.23 |
4. Conclusions
Simultaneous production of high purity propionate and methane from glucose in MCF was studied in this work for the first time. The addition of 1.4 g L−1 ammonium could inhibit the activity of propionate oxidation bacteria but had little or no effect on archaeal activity in the bottle tests. It was also found that the propionate yield was 0.22 and 0.37–0.47 g COD per g COD glucose in the fed-batch and sequential batch modes, respectively. Microbial analysis showed that the change of POB matched the change of the propionate yield well. Furthermore, very high purity of propionate (i.e., >98%) was obtained.Acknowledgements
The authors would like to acknowledge the financial support from National Hi-Technology Development 863 Program of China (2011AA060901), the Hundred-Talent Program of Chinese Academy of Sciences, Natural Science Foundation of China (51478447, 51408530), the Program for Changjiang Scholars and Innovative Research Team in University, and the Fundamental Research Funds for the Central Universities.References
- M. Sauer, D. Porro, D. Mattanovich and P. Branduardi, Trends Biotechnol., 2008, 26, 100–108 CrossRef CAS PubMed.
- C. C. Stowers, B. M. Cox and B. A. Rodriguez, J. Ind. Microbiol. Biotechnol., 2014, 41, 837–852 CrossRef CAS PubMed.
- L. Zhu, P. Wei, J. Cai, X. Zhu, Z. Wang, L. Huang and Z. Xu, Bioresour. Technol., 2012, 112, 248–253 CrossRef CAS PubMed.
- T. Dishisha, M. T. Alvarez and R. Hatti-Kaul, Bioresour. Technol., 2012, 118, 553–562 CrossRef CAS PubMed.
- L. Liu, Y. Zhu, J. Li, M. Wang, P. Lee, G. Du and J. Chen, Crit. Rev. Biotechnol., 2012, 32, 374–381 CrossRef CAS PubMed.
- T. Dishisha, M. H. A. Ibrahim, V. H. Cavero, M. T. Alvarez and R. Hatti-Kaul, Bioresour. Technol., 2015, 176, 80–87 CrossRef CAS PubMed.
- A. Ghimire, L. Frunzo, F. Pirozzi, E. Trably, R. Escudie, P. N. L. Lens and G. Esposito, Appl. Energy, 2015, 144, 73–95 CrossRef CAS.
- A. Zhang and S. T. Yang, Biotechnol. Bioeng., 2009, 104, 766–773 CAS.
- Y. Zhu, J. Li, M. Tan, L. Liu, L. Jiang, J. Sun, P. Lee, G. Du and J. Chen, Bioresour. Technol., 2010, 101, 8902–8906 CrossRef CAS PubMed.
- R. Kleerebezem and M. C. van Loosdrecht, Curr. Opin. Biotechnol., 2007, 18, 207–212 CrossRef CAS PubMed.
- F. Zhang, Y. Zhang, J. Ding, K. Dai, M. C. van Loosdrecht and R. J. Zeng, Sci. Rep., 2014, 4, 5268 CAS.
- M. F. Temudo, R. Kleerebezem and M. van Loosdrecht, Biotechnol. Bioeng., 2007, 98, 69–79 CrossRef CAS PubMed.
- M. Lübken, K. Koch, T. Gehring, H. Horn and M. Wichern, Appl. Energy, 2015, 142, 352–360 CrossRef.
- F. Dong, Q.-B. Zhao, W.-W. Li, G.-P. Sheng, J.-B. Zhao, Y. Tang, H.-Q. Yu, K. Kubota, Y.-Y. Li and H. Harada, Environ. Sci. Technol., 2011, 45, 9093–9100 CrossRef CAS PubMed.
- D. I. Massé, R. Rajagopal and G. Singh, Appl. Energy, 2014, 120, 49–55 CrossRef.
- K. Boe, J.-P. Steyer and I. Angelidaki, Water Sci. Technol., 2008, 57, 661–666 CrossRef CAS PubMed.
- H. Nielsen, H. Uellendahl and B. Ahring, Biomass Bioenergy, 2007, 31, 820–830 CrossRef CAS.
- T. I. M. Grootscholten, D. P. B. T. B. Strik, K. J. J. Steinbusch, C. J. N. Buisman and H. V. M. Hamelers, Appl. Energy, 2014, 116, 223–229 CrossRef CAS.
- Y. Chen, T. Wang, N. Shen, F. Zhang and R. J. Zeng, Bioresour. Technol., 2016, 219, 659–667 CrossRef CAS PubMed.
- M. Zamanzadeh, L. H. Hagen, K. Svensson, R. Linjordet and S. J. Horn, Water Res., 2016, 96, 246–254 CrossRef CAS PubMed.
- B.-H. Zhao, PhD thesis, University of Science and Technology of China, 2010.
- Y. Chen, J. He, Y. Mu, Y. C. Huo, Z. Zhang, T. A. Kotsopoulos and R. J. Zeng, Chem. Eng. Sci., 2015, 137, 677–684 CrossRef CAS.
- L. Fu, Z. W. Ding, J. Ding, F. Zhang and R. J. Zeng, Appl. Microbiol. Biotechnol., 2015, 99, 7925–7936 CrossRef CAS PubMed.
- F. Zhang, Y. Chen, K. Dai and R. J. Zeng, Appl. Microbiol. Biotechnol., 2014, 98, 10267–10273 CrossRef CAS PubMed.
- W. E. Federation and A. P. H. Association, American Public Health Association (APHA), Standard methods for the examination of water and wastewater, Washington, DC, USA, 2005 Search PubMed.
- J. Ding, L. Fu, Z. W. Ding, Y. Z. Lu, S. H. Cheng and R. J. Zeng, Appl. Microbiol. Biotechnol., 2016, 100, 439–446 CrossRef CAS PubMed.
- Q. Ban, J. Li, L. Zhang, A. K. Jha and Y. Zhang, Appl. Biochem. Biotechnol., 2013, 171, 2129–2141 CrossRef CAS PubMed.
- B. Calli, B. Mertoglu, B. Inanc and O. Yenigun, Process Biochem., 2005, 40, 1285–1292 CrossRef CAS.
- R. Rajagopal, D. I. Massé and G. Singh, Bioresour. Technol., 2013, 143, 632–641 CrossRef CAS PubMed.
- M. Barredo and L. Evison, Appl. Environ. Microbiol., 1991, 57, 1764–1769 CAS.
- Y. Wang, Y. Zhang, J. Wang and L. Meng, Biomass Bioenergy, 2009, 33, 848–853 CrossRef CAS.
- Y. Lu, F. Slater, Z. Mohd-Zaki, S. Pratt and D. Batstone, Water Sci. Technol., 2011, 64, 760 CrossRef CAS PubMed.
- Y. Q. Tang, T. Shigematsu, S. Morimura and K. Kida, J. Biosci. Bioeng., 2015, 119, 375–383 CrossRef CAS PubMed.
- H. D. Ariesyady, T. Ito and S. Okabe, Water Res., 2007, 41, 1554–1568 CrossRef CAS PubMed.
- B. Demirel and P. Scherer, Rev. Environ. Sci. Bio/Technol., 2008, 7, 173–190 CrossRef CAS.
- A. Schnürer and Å. Nordberg, Water Sci. Technol., 2008, 57, 735–740 CrossRef PubMed.
- J. De Vrieze, T. Hennebel, N. Boon and W. Verstraete, Bioresour. Technol., 2012, 112, 1–9 CrossRef CAS PubMed.
- M. C. Gagliano, C. M. Braguglia, A. Gianico, G. Mininni, K. Nakamura and S. Rossetti, Water Res., 2015, 68, 498–509 CrossRef CAS PubMed.
- D. J. Batstone, J. Keller, I. Angelidaki, S. Kalyuzhny, S. Pavlostathis, A. Rozzi, W. Sanders, H. Siegrist and V. Vavilin, Anaerobic digestion model no. 1 (ADM1), IWA Publishing, 2002 Search PubMed.
- L.-P. Hao, F. Lü, P.-J. He, L. Li and L.-M. Shao, Environ. Sci. Technol., 2010, 45, 508–513 CrossRef PubMed.
- Z. Wang, Y. Jin and S. T. Yang, Biotechnol. Bioeng., 2015, 112, 502–511 CrossRef CAS PubMed.
- A. Zhang and S.-T. Yang, Process Biochem., 2009, 44, 1346–1351 CrossRef CAS.
- D. Arslan, K. Steinbusch, L. Diels, H. Hamelers, D. Strik, C. Buisman and H. De Wever, Crit. Rev. Environ. Sci. Technol., 2016, 46, 592–634 CrossRef CAS.
- J. I. Horiuchi, T. Shimizu, K. Tada, T. Kanno and M. Kobayashi, Bioresour. Technol., 2002, 82, 209–213 CrossRef CAS PubMed.
- L. Wang, Q. Zhou and F. Li, Biomass Bioenergy, 2006, 30, 177–182 CrossRef CAS.
- A. Zhang, J. Sun, Z. Wang, S.-T. Yang and H. Zhou, Bioresour. Technol., 2015, 175, 374–381 CrossRef CAS PubMed.
- F. Zhang, Y. Chen, K. Dai, N. Shen and R. J. Zeng, Int. J. Hydrogen Energy, 2014, 40, 919–926 CrossRef.
| This journal is © The Royal Society of Chemistry 2017 |

