 Open Access Article
Creative Commons Attribution 3.0 Unported Licence
Synthesis, characterization and performance of bifunctional catalysts for the synthesis of menthol from citronellal†
J. ten Dam a,
A. Ramanathanb,
K. Djanashvili
 a,
F. Kapteijn
 c and
U. Hanefeld
 *a
*a
aBiocatalysis and Organic Chemistry, Department of Biotechnology, Delft University of Technology, Van der Maasweg 9, 2629 HZ Delft, The Netherlands. E-mail: U.Hanefeld@tudelft.nl; Tel: +31 (0)15 27 82683
bCenter for Environmentally Beneficial Catalysis (CEBC), The University of Kansas, Lawrence, KS 66047, USA
cCatalysis Engineering, Department of Chemical Engineering, Delft University of Technology, Van der Maasweg 9, 2629 HZ Delft, The Netherlands
First published on 20th February 2017
Abstract
The synthesis of a series of bifunctional catalysts (1 wt% Pt/W-TUD-1 (Technische Universiteit Delft-1) and 1 wt% Pt/WO3/TUD-1) with different tungsten loadings (5–30 wt% WO3) is described. They were characterized using ICP-OES, INAA, N2 physisorption, XRD and TEM. Their catalytic performance (activity and selectivity) was evaluated in the two-step catalytic synthesis of menthol from citronellal using kinetic analysis. Introducing tungsten during the TUD-1 synthesis results in a high WO3 dispersion, essential for the acidity of the catalyst. High tungsten dispersion is also critical for the Pt hydrogenation activity. Therefore, high dispersion combined with optimal tungsten loading resulted in the highest catalytic activity. The best performing catalyst was 1 wt% Pt/W-TUD-1 (silicon to tungsten ratio of 30), with the highest yields of menthol (96%).
Introduction
Citronellal can be obtained from the fractional distillation of natural citronella oil. This monoterpenoid is a versatile building block for a series of organic syntheses.1 One extensively researched process, is the one pot, 2-step synthesis of menthol.2–7 This sequence relies on the acid catalysed Prins cyclisation that converts citronellal into isopulegol.8–12 This olefin is subsequently hydrogenated to form menthol.2–7The process requires both an acid (Brønsted or Lewis acid) and a hydrogenation catalyst functionality. Bifunctional acidic hydrogenation catalysts can be obtained in various ways. They can be prepared by impregnating acidic supports/catalysts like zeolites, acidic carbons, Al-TUD-1, B-TUD-1, SAPOs and acidic resins with a hydrogenation metal precursor (Pt, Pd, Rh, Ru, Ir, Cu, Ni and Co).2–5,13–16 The ratio of Lewis and Brønsted acid were varied to investigate their influence on the Prins cyclisation. Only in the case of Zr and Al in one material some synergy was displayed.13
Another option is to consecutively impregnate an inert carrier with an acid and a hydrogenation metal precursor solution (or vice versa). Ferrari et al. studied the influence of the order of impregnation on the activity of a CoMo catalyst in a hydrodeoxygenation and decarboxylation. They showed that acid impregnation (Mo) followed by hydrogenation metal (Co) produced a more active catalyst.17
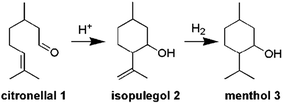
This paper describes the synthesis of two series of bifunctional acidic hydrogenation catalysts. The acidity is derived from tungsten, while platinum is the hydrogenation centre.18–21 The first series is based on the direct synthesis of W-TUD-1, which is subsequently impregnated with a platinum precursor solution. The second series is based on the consecutive impregnation of TUD-1 with WO3 and with platinum precursor solutions. Their catalytic activity is evaluated in the two-step synthesis of menthol from citronellal (Scheme 1).2–7 In this example the selectivity revolves around the acidic sites: they should be acidic enough to catalyse the Prins cyclisation of citronellal, but they should not be able to remove the formed hydroxyl group through elimination.8–12
TUD-1 was chosen as a support because of its amorphous structure and relatively large pore size. These characteristics aid in overcoming diffusion limitations, which is particularly important in liquid phase fine chemical synthesis because of the molecular sizes involved.13,22–24 Previous work showed that direct synthesis of W-TUD-1 resulted in smaller WO3 particles (below XRD detection limit, i.e. 2–3 nm) leading to a more acidic catalyst than the impregnation method (WO3/TUD-1).25 Pt was chosen for its high hydrogenation activity.
The menthol synthesis from citronellal was chosen as model reaction to establish the catalytic activity and selectivity of the synthesized catalysts. The advantage of this model reaction is that both the acid and hydrogenation catalysis can be tested individually: the conversion of citronellal to isopulegol is acid catalysed and hydrogenation of isopulegol yields menthol.2–12
Experimental
Materials
Tetraethoxysilane (TEOS, Aldrich, 98%), triethanolamine (TEA, Acros, 97%), tetraethylammonium hydroxide (TEAOH, Aldrich, 35 wt% aqueous solution), tungstic acid (Aldrich, >99%), ammonium hydroxide (J. T. Baker, 25 wt% aqueous solution), tungsten(VI) ethoxide (Alfa Aesar), dry ethanol (Merck), dry i-propanol (Merck), chloroplatinic acid (H2PtCl6·6H2O, Aldrich, ≥37.50% Pt basis), isopulegol (Acros, technical), (rac)-citronellal (Acros, ≥95%), dry toluene (sure seal, Aldrich), trimethylbenzene (Acros, 99%).Catalyst preparation
![[thin space (1/6-em)]](https://www.rsc.org/images/entities/char_2009.gif) :
:![[thin space (1/6-em)]](https://www.rsc.org/images/entities/char_2009.gif) 1
1![[thin space (1/6-em)]](https://www.rsc.org/images/entities/char_2009.gif) :
:![[thin space (1/6-em)]](https://www.rsc.org/images/entities/char_2009.gif) 11
11![[thin space (1/6-em)]](https://www.rsc.org/images/entities/char_2009.gif) :
:![[thin space (1/6-em)]](https://www.rsc.org/images/entities/char_2009.gif) 0.5. Three samples of WO3/TUD-1 (5, 10 and 20 wt%) were prepared by incipient wetness impregnation of TUD-1 (pore volume = 0.897 cm3 g−1) using solutions of appropriate amounts of tungstic acid (Aldrich) in aqueous ammonium hydroxide (J. T. Baker, 25 wt% aqueous solution). The material was dried overnight at 95 °C and calcined at 600 °C for 10 h with a temperature ramp of 1 °C min−1 in a flow of dry air. These materials are denoted by WO3/TUD-1x, where x (5, 10 or 20) represents the wt% of WO3 on the TUD-1 support.
0.5. Three samples of WO3/TUD-1 (5, 10 and 20 wt%) were prepared by incipient wetness impregnation of TUD-1 (pore volume = 0.897 cm3 g−1) using solutions of appropriate amounts of tungstic acid (Aldrich) in aqueous ammonium hydroxide (J. T. Baker, 25 wt% aqueous solution). The material was dried overnight at 95 °C and calcined at 600 °C for 10 h with a temperature ramp of 1 °C min−1 in a flow of dry air. These materials are denoted by WO3/TUD-1x, where x (5, 10 or 20) represents the wt% of WO3 on the TUD-1 support.![[thin space (1/6-em)]](https://www.rsc.org/images/entities/char_2009.gif) :
:![[thin space (1/6-em)]](https://www.rsc.org/images/entities/char_2009.gif) n
n![[thin space (1/6-em)]](https://www.rsc.org/images/entities/char_2009.gif) :
:![[thin space (1/6-em)]](https://www.rsc.org/images/entities/char_2009.gif) 1 + 2n
1 + 2n![[thin space (1/6-em)]](https://www.rsc.org/images/entities/char_2009.gif) :
:![[thin space (1/6-em)]](https://www.rsc.org/images/entities/char_2009.gif) 11
11![[thin space (1/6-em)]](https://www.rsc.org/images/entities/char_2009.gif) :
:![[thin space (1/6-em)]](https://www.rsc.org/images/entities/char_2009.gif) 0.5. The resulting liquid was poured into a porcelain dish and aged at room temperature for at least 24 h. The resulting thickened gel was dried in an oven at 98 °C for at least 12 h. The dried sample was ground and hydrothermally treated at 180 °C for 5 h in a stainless steel Teflon-lined autoclave. Finally, calcination was performed at 600 °C for 10 h with a heating rate of 1 °C min−1 in a flow of dry air. These materials are denoted by W-TUD-1x, where x (28, 16, 11, 9 or 7) represents the WO3-loading in wt%, which is equivalent to the following Si/W ratios, respectively: 10, 20, 30, 40 or 50.
0.5. The resulting liquid was poured into a porcelain dish and aged at room temperature for at least 24 h. The resulting thickened gel was dried in an oven at 98 °C for at least 12 h. The dried sample was ground and hydrothermally treated at 180 °C for 5 h in a stainless steel Teflon-lined autoclave. Finally, calcination was performed at 600 °C for 10 h with a heating rate of 1 °C min−1 in a flow of dry air. These materials are denoted by W-TUD-1x, where x (28, 16, 11, 9 or 7) represents the WO3-loading in wt%, which is equivalent to the following Si/W ratios, respectively: 10, 20, 30, 40 or 50.Catalyst characterization
X-ray diffraction patterns of the WO3/TUD-1, Pt/W-TUD-1 and Pt/WO3/TUD-1 samples were measured using a Bruker D8 Advance diffractometer with a Lynxeye detector and Cu Kα radiation. Measuring range from 5° to 95° 2θ with a step size of 0.02° and a scan speed of 0.15 s−1.
Catalytic performance testing
The apparent turnover frequency (TOFPt) for hydrogenation is defined as mmol isopulegol converted per mol Pt per hour, based on a rate constant k that is derived from a first order rate approximation (Appendix A).
The apparent turnover frequency (TOFw) for the Prins cyclisation is defined as mmol citronellal converted per mol W per hour, based on a rate constant k that is derived from a first order rate approximation (Appendix A).
For stage 2 the reactor was closed again and the same procedure as described for isopulegol hydrogenation was followed.
Results and discussion
Catalysts characterization
The chemical composition of the samples is determined by a combination of INAA and ICP-OES. It shows a good correlation between the amounts of tungsten and platinum (0.9 ± 0.2 wt%) used for the synthesis of the catalysts and the amounts that were present in the materials (Table 1).| Catalyst | WO3, wt% | Pt (ICP), wt% | SBET, m2 g−1 | Vpore, cm3 g−1 | Dpore, Å |
|---|---|---|---|---|---|
| a INAA.b ICP.c ICP on Pt/WO3/TUD-15. | |||||
| TUD-1 | — | — | 655 | 0.58 | 35 |
| WO3/TUD-120 | 18.2a | — | 210 | 0.33 | 60 |
| WO3/TUD-110 | 8.8a | — | 225 | 0.36 | 65 |
| WO3/TUD-15 | 5.3c | — | 245 | 0.42 | 70 |
| W-TUD-128 | 31.0a | — | 420 | 0.48 | 45 |
| W-TUD-116 | 17.0a | — | 635 | 0.83 | 50 |
| W-TUD-111 | 12.3a | — | 710 | 0.81 | 45 |
| W-TUD-19 | 9.6a | — | 635 | 0.90 | 55 |
| W-TUD-17 | 8.1a | — | 720 | 0.91 | 50 |
| Pt/WO3/TUD-120 | 14.3b | 1.01 | 220 | 0.33 | 60 |
| Pt/WO3/TUD-110 | 10.6b | 1.01 | 200 | 0.33 | 65 |
| Pt/WO3/TUD-15 | 5.3b | 0.84 | 255 | 0.44 | 70 |
| Pt/W-TUD-128 | 17.0b | 1.06 | 415 | 0.49 | 50 |
| Pt/W-TUD-116 | 13.8b | 0.89 | 605 | 0.72 | 45 |
| Pt/W-TUD-111 | 10.6b | 0.72 | 655 | 0.72 | 45 |
| Pt/W-TUD-19 | 9.4b | 0.74 | 590 | 0.84 | 55 |
| Pt/W-TUD-17 | 7.5b | 0.61 | 670 | 0.74 | 45 |
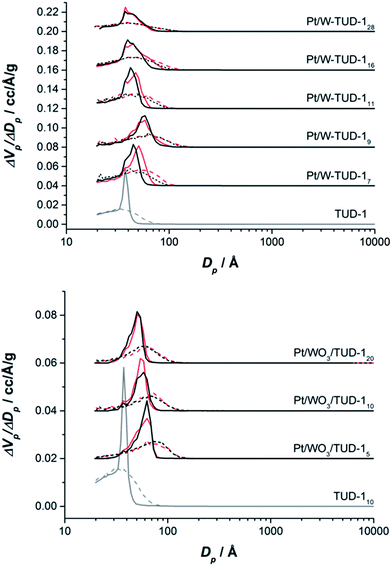
The pore structures of the materials are summarized in Table 1 and the nitrogen isotherms and pore size distributions are presented in Fig. 1. All samples show a type IV isotherm, typical for mesoporous materials where capillary condensation in mesopores occurs in a relative pressure range of 0.4–0.8. All materials show a H2 type hysteresis loop (Fig. 1).28
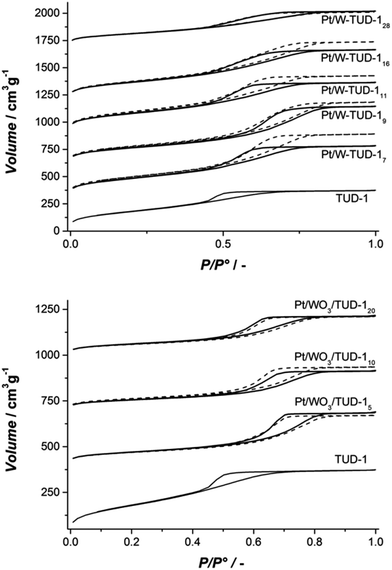 | ||
| Fig. 1 (Top) isotherms of Pt/W-TUD-1 samples (bold) and W-TUD-1 samples (dashed); (bottom) isotherms of Pt/WO3/TUD-1 samples (bold) and WO3/TUD-1 samples (dashed). | ||
The W-TUD-1 samples have a larger pore volume and larger BET area than the WO3/TUD-1 samples. Impregnation of the W-TUD-1 samples with platinum precursor resulted in slightly lower pore volumes and BET areas, while impregnation of the WO3/TUD-1 samples did not affect the physical properties of this material (Table 1; Fig. 2). It is noted that in some cases the adsorption–desorption hysteresis closes at 0.42 relative pressure, which indicates the influence of the tensile strength effect, indicating that the distinct pore size visible for e.g. TUD-1 at ∼3–4 nm is an artefact of this phenomenon.29
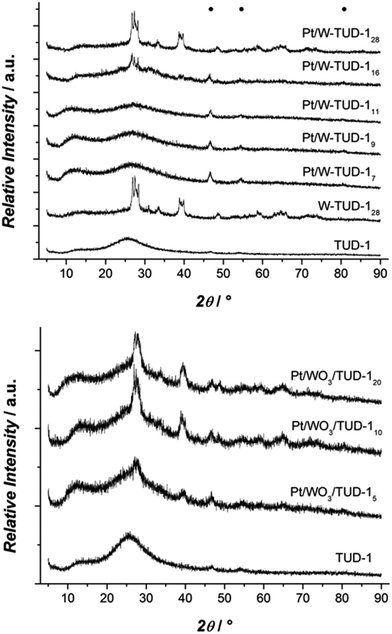
The XRD results show that the tungsten is better dispersed on the Pt/W-TUD-1 samples. WO3 reflections start only appearing at Pt/W-TUD-116, whereas WO3 reflections are already visible in Pt/WO3/TUD-15. Addition of Pt to both the W-TUD-1 and the WO3/TUD-1 materials results in barely visible Pt reflections around 45 and 55°, indicating that the Pt particles on the material are well dispersed and close to the detection limit of XRD (Fig. 3).
The TEM images before and after Pt addition show that the supports are not affected by the impregnation procedure (Fig. 4). Platinum has been well dispersed on the W-TUD-17 support and is present in <25 nm particles. The Pt/WO3/TUD-110 material shows a typical Pt particle size of 10 nm diameter. Fig. 5 shows more detailed TEM images and EDX analyses of Pt loaded WO3/TUD-1 samples, and shows the differences between Pt and WO3 particles. Pt particles are identified by an EDX signal at 2.0 keV and can be recognized by their dark colour and sharp edges.30 The WO3 particles are identified by EDX through the W signal at 1.8 keV and are generally more vague than the sharp outlined Pt particles.
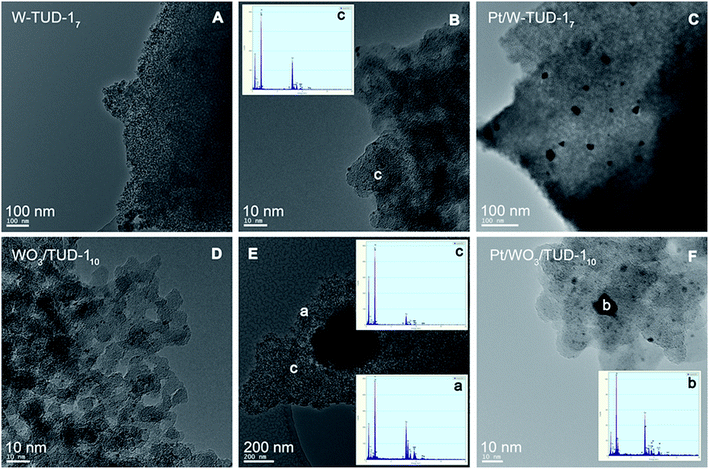 | ||
| Fig. 4 TEM images of W-TUD-17 (A and B) and Pt/W-TUD-17 (C) and WO3/TUD-110 (D and E) and Pt/WO3/TUD-110 (F). | ||
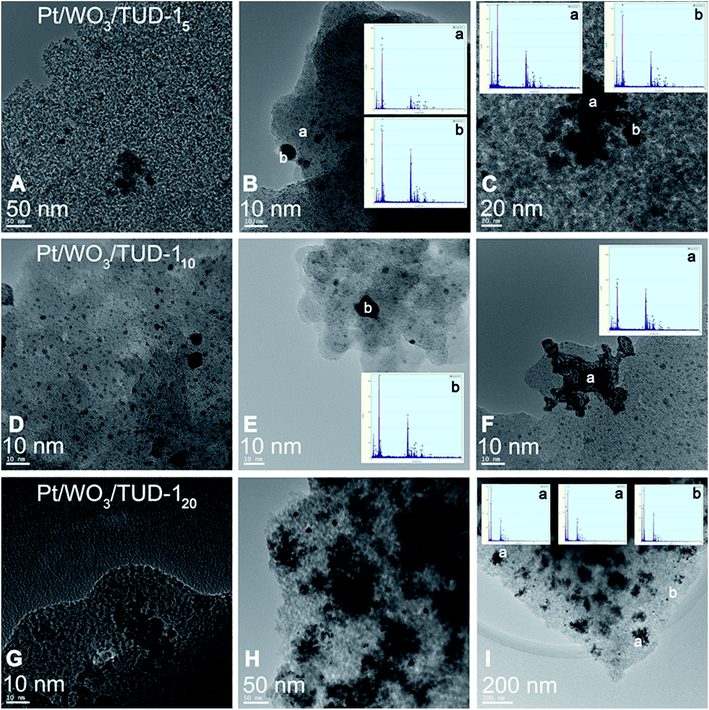 | ||
| Fig. 5 TEM images of Pt impregnated WO3/TUD-1 and corresponding EDX analysis. Pt/WO3/TUD-15 (A–C); Pt/WO3/TUD-110 (D–F); bottom: Pt/WO3/TUD-120 (G–I). | ||
The particles on Pt/WO3/TUD-15 that were assigned with an ‘a’ in the top row of Fig. 5 were identified as WO3 particles by EDX. The Pt particles, which tend to be smaller than the WO3 particles, were tagged with a ‘b’.
The Pt particle in the middle image in the middle row of Fig. 5 can be clearly distinguished from the WO3 particle in the image on the right hand side.
The TEM images of Pt/WO3/TUD-120 show relatively more agglomerations of WO3, as a result of the higher tungsten loading. The irregularly shaped forms (‘a’) were identified as WO3, while the sharp dark dot proved to be a Pt particle (‘b’), which shows that the tungsten loading has no effect on the Pt particle size or shape. All of the Pt/WO3/TUD-1 materials, irrespective of the tungsten loading, show relatively large agglomerates of WO3. The higher the tungsten loading, the larger these agglomerates become.
As a direct result of the high tungsten loading, the Pt/W-TUD-128 material shows the largest WO3 agglomerations (Fig. 6, ‘a’) of all the Pt/W-TUD-1 samples. This is also recognized from the XRD results, which show a clear WO3 reflection for this material. Interestingly, there are not as much Pt particles (Fig. 6, ‘b’) visible on the Pt/W-TUD-128 (Fig. 6, 100 nm scale bar) as in the image of Pt/W-TUD-116 with the same scaling. On the other hand, the observed WO3 agglomerations in this image are much smaller than in the Pt/W-TUD-128 material and become scarce when the tungsten loading is lowered even further (Pt/W-TUD-111, 9 and 7). The Pt particles on these materials do not seem to change much in size and shape over the range of tungsten loadings. Some EDX spectra of the TUD-1 background are added as comparison (Fig. 6, ‘c’).
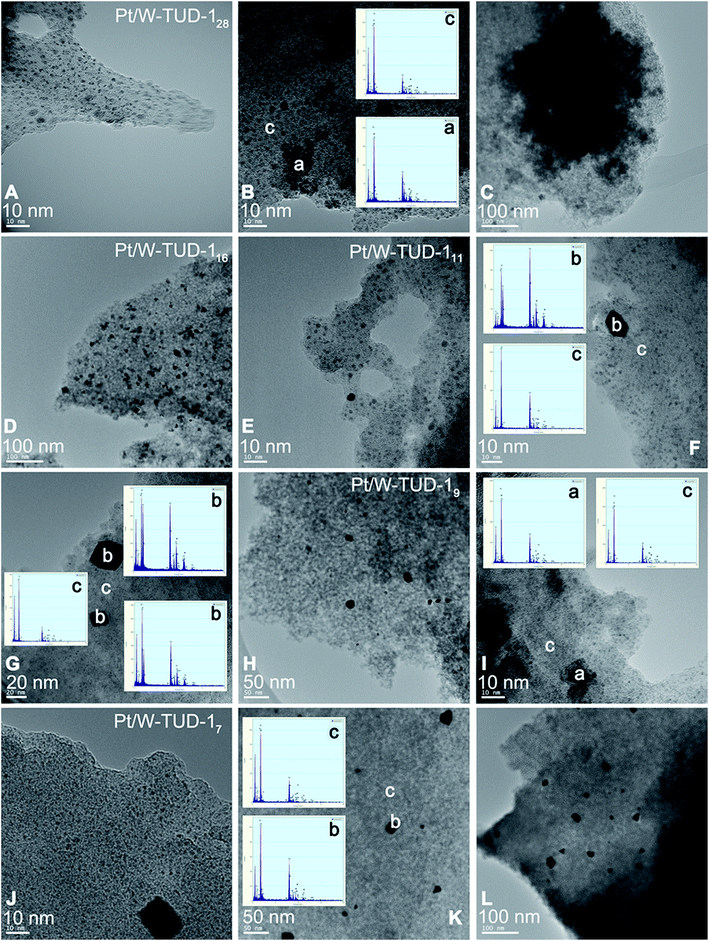 | ||
| Fig. 6 TEM images of Pt impregnated W-TUD-1 and corresponding EDX analysis. Pt/W-TUD-128 (A–C); Pt/W-TUD-116 (D), Pt/W-TUD-111 (E–G); Pt/W-TUD-19 (H and I); Pt/W-TUD-17 (J–L). | ||
Catalyst performance
| Catalyst | Conversion (%) | Pt (wt%) | k (μL gcat−1 s−1) | r0 (μmol gcat−1 s−1) | TOFPt (mmol molPt−1 s−1) |
|---|---|---|---|---|---|
| Pt/W-TUD-128 | 95.1 | 1.06 | 4.1 | 2.1 | 38 |
| Pt/W-TUD-116 | 6.8 | 0.89 | 0.1 | 0.1 | 1.1 |
| Pt/W-TUD-111 | 31.6 | 0.72 | 0.5 | 0.3 | 7.7 |
| Pt/W-TUD-19 | 83.9 | 0.74 | 2.3 | 1.2 | 31 |
| Pt/W-TUD-17 | 47.6 | 0.61 | 0.9 | 0.4 | 14 |
| Pt/WO3/TUD-15 | 16.7 | 0.84 | 0.2 | 0.1 | 2.8 |
| Pt/WO3/TUD-110 | 13.7 | 1.01 | 0.2 | 0.1 | 2.0 |
| Pt/WO3/TUD-120 | 24.8 | 1.01 | 0.4 | 0.2 | 3.4 |
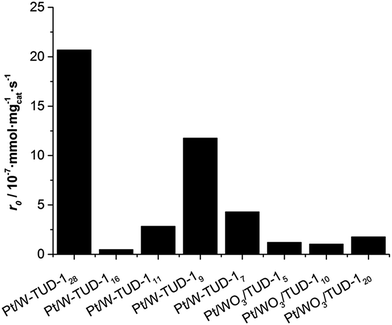 | ||
| Fig. 7 Initial hydrogenation rate r0 of isopulegol over Pt/W-TUD-1 and Pt/WO3/TUD-1 catalysts. Reaction conditions: 2.0 mmol isopulegol, 4.0 mL toluene, 50 mg catalyst, 20 bar H2, 80 °C, 800 rpm. | ||
It is important to note that WO3 by itself is not an active hydrogenation catalyst and the activity of the individual catalysts is likely to be dependent on the Pt metal surface and its environment. This relates to the Pt dispersion on the catalyst, but is difficult to quantify based on the XRD and TEM data. The incipient wetness impregnation of the different catalysts must have led to a varying Pt dispersion, resulting in a wide range of hydrogenation activities.
Interestingly, no deoxygenated products are observed during the reaction, showing that under these reaction conditions the material is not acidic enough to remove the hydroxyl group that is present in both isopulegol and menthol.
Poisoning is not expected by using these clean feeds, and product inhibition was not observed in previous studies of isopulegol hydrogenation.3 Agglomeration of the Pt particles is observed by TEM after reaction, as can be seen in Fig. 9.
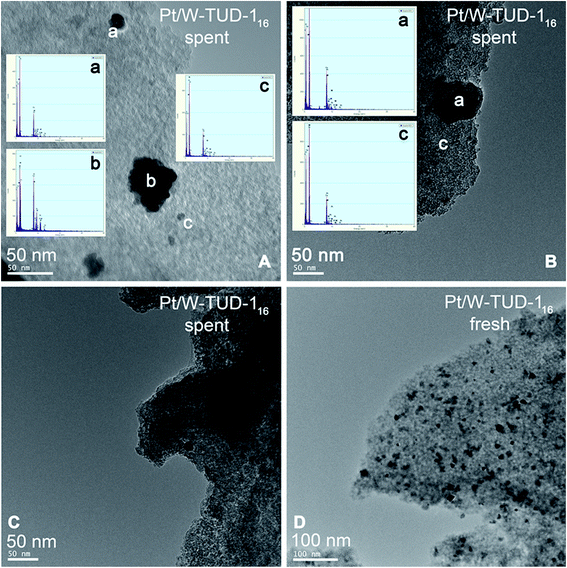 | ||
| Fig. 9 TEM images and EDX analysis of spent (A, B and D) and fresh (D) Pt/W-TUD-116. WO3, Pt and background are labelled as a, b and c, respectively. | ||
Obviously, the observed catalyst deactivation has an effect on the accuracy of our assumption of first order rate dependence. However, this is still the best assumption that we can make.
| Catalyst | Stage 1 | Stage 1 + stage 2 | 5 h Prins cyclisation | 16 h hydrogenation | ||||||
|---|---|---|---|---|---|---|---|---|---|---|
| Yield (%) t = 5 h | Yield (%) t = 21 h | kb (μL gcat−1 s−1) | TOFwc (mmol molW−1 s−1) | kd (μL mgcat−1 s−1) | TOFPte (mmol molPt−1 s−1) | |||||
| 2 | 1 | 2 | 3 | 5 | 4 | |||||
| a Reaction conditions Prins cyclisation: 2.0 mmol citronellal, 4.0 mL toluene, 50 mg catalyst, 80 °C, 20 bar N2, 5 h; reaction conditions hydrogenation: reaction mixture (including catalyst) of Prins cyclisation is used, 80 °C, 20 bar H2, 16 h.b Prins cyclisation rate constant k is calculated from citronellal conversion after 5 h by assuming a first order in citronellal concentration.c Prins cyclisation TOFw is calculated from the initial rate r0, and accounts for the amount of W in the catalyst, defined as mol converted citronellal per mol W per s.d Isopulegol hydrogenation rate constant k is calculated assuming a first order in isopulegol concentration, and assuming no additional isopulegol is formed during hydrogenation (t > 5 h) (therefore rate constants for Pt/WO3/TUD-1 catalysts cannot be calculated).e Isopulegol hydrogenation TOFPt is calculated from the initial rate r0, and accounts for the amount of Pt in the catalyst, defined as mol converted isopulegol per mol Pt per s.f Citronellal double bond hydrogenation rate constant k is calculated for the Pt/WO3/TUD-1 catalysts, assuming a first order in citronellal double bond concentration, and assuming no additional Prins cyclisation occurs during hydrogenation.g Citronellal double bond hydrogenation TOFPt is calculated from the initial rate r0, and accounts for the amount of Pt in the catalyst, defined as mol converted double bond per mol Pt per s. | ||||||||||
| Pt/W-TUD-128 | 85.2 | 0 | 0 | 83.3 | 16.7 | 0 | 8.4 | 3.0 | 5.3 | 38.6 |
| Pt/W-TUD-116 | 90.6 | 0 | 23.2 | 73.8 | 2.0 | 1.0 | 10.1 | 7.1 | 2.2 | 22.9 |
| Pt/W-TUD-111 | 99.5 | 0 | 0 | 96.4 | 3.6 | 0 | 22.8 | 22.6 | 4.6 | 65.2 |
| Pt/W-TUD-19 | 93.6 | 0 | 0 | 90.9 | 9.1 | 0 | 12.0 | 14.3 | 4.9 | 59.3 |
| Pt/W-TUD-17 | 93.4 | 0 | 0 | 91.3 | 8.7 | 0 | 11.5 | 17.0 | 5.0 | 77.2 |
| Pt/WO3/TUD-15 | 30.6 | 30.8 | 19.2 | 22.0 | 20.9 | 7.2 | 1.6 | 3.5 | 0.6f | 4.8g |
| Pt/WO3/TUD-110 | 24.5 | 24.3 | 20.2 | 12.8 | 21.0 | 21.7 | 1.3 | 1.7 | 0.8f | 5.6g |
| Pt/WO3/TUD-120 | 24.0 | 23.7 | 16.2 | 14.9 | 36.4 | 8.7 | 1.2 | 0.8 | 1.0f | 7.6g |
The highest menthol yield was achieved over Pt/W-TUD-111. Overall, 96% citronellal could be converted into menthol by sequential operation. The remaining 4% was identified as 3,7-dimethyloctan-1-ol, resulting from the direct hydrogenation of citronellal. This clearly shows that the acidity of these materials does not lead to unwanted oxygen elimination.
The Prins cyclisation is performed under a nitrogen atmosphere in the first stage, as the hydrogenation of the carbonyl and alkene by the platinum catalyst would reduce the menthol selectivity significantly (converting citronellal into dimethyloctenol and dimethyloctanol (Tables 3 and 5), thereby preventing the formation of menthol). Overall, the Pt/W-TUD-1 catalysts show a higher conversion of citronellal compared to the Pt/WO3/TUD-1 catalysts. In this series, the catalysts with a low tungsten loading (Pt/W-TUD-17, 9 and 11) have a far higher TOFw than catalysts with a higher tungsten loading (Pt/W-TUD-116 and 28). In fact, Pt/W-TUD-128 has a TOFw that is comparable to the TOFw of the Pt/WO3/TUD-1 catalysts. The Pt/WO3/TUD-1 catalysts show an increasing TOFw with decreasing tungsten loading. This is in agreement with earlier work with the W-TUD-1 and WO3/TUD-1 materials without Pt and is the result of the better dispersion of tungsten (Table 4).25 The highest TOFw was observed for the Pt/W-TUD-111 catalyst, because this material contains an optimal amount of small WO3 particles (Table 1), without forming large, relatively non-acidic, WO3 particles. It exhibits the highest number of acid sites per tungsten (Table 4).
| Catalyst | Total aciditya (mmol gcat−1) | Acidity/Wb (molH+ molW−1) | ρWO3 (WO3 units nm−2) |
|---|---|---|---|
| a Total catalyst acidity determined over a temperature range of 100–600 °C.b Acidity derived from WO3 can be considered as Brønsted acid.35 | |||
| TUD-1 | 0.02 | n.a. | n.a. |
| WO3 (ref. 34) | 0.0 | n.a. | n.a. |
| WO3/TUD-110 | 0.34 | 0.90 | 0.38 |
| WO3/TUD-120 | 0.45 | 0.57 | 0.88 |
| W-TUD-17 | 0.38 | 1.09 | 0.29 |
| W-TUD-19 | 0.52 | 1.26 | 0.39 |
| W-TUD-111 | 0.78 | 1.47 | 0.45 |
| W-TUD-116 | 0.99 | 1.35 | 0.70 |
| W-TUD-128 | 0.47 | 0.35 | 1.92 |
| Catalyst | Stage 1 | Yield (%) t = 21 h | 5 h Prins cyclisation | 16 h hydrogenation | ||||||||
|---|---|---|---|---|---|---|---|---|---|---|---|---|
| Yield (%) t = 5 h | kb (μL gcat−1 s−1) | TOFwc (mmol molW−1 s−1) | TOFfresh/TOFspent | kd (μL gcat−1 s−1) | TOFPte (mmol molPt−1 s−1) | TOFfresh/TOFspent | ||||||
| 2 | 1 | 2 | 3 | 5 | 4 | |||||||
| a Reaction conditions Prins cyclisation: 2.0 mmol citronellal, 4.0 mL toluene, 50 mg recycled catalyst, 80 °C, 20 bar N2, 5 h; reaction conditions hydrogenation: reaction mixture (including catalyst) of Prins cyclisation is used, 80 °C, 20 bar H2, 16 h.b Prins cyclisation rate constant k is calculated from citronellal conversion after 5 h by assuming a first order in citronellal concentration.c Prins cyclisation TOF is calculated from the initial rate r0, and accounts for the amount of W in the catalyst, defined as mol converted citronellal per mol W per s.d Citronellal double bond hydrogenation rate constant k is calculated for the Pt/WO3/TUD-1 catalysts, assuming a first order in citronellal double bond concentration, and assuming no additional Prins cyclisation occurs during hydrogenation.e Citronellal double bond hydrogenation TOF is calculated from the initial rate r0, and accounts for the amount of Pt in the catalyst, defined as mol converted double bond per mol Pt per s.f fresh TOFPt is calculated in a differently than spent TOFPt, therefore the two cannot be directly compared. | ||||||||||||
| Pt/W-TUD-128 | 16.5 | 18.1 | 9.0 | 19.1 | 42.6 | 11.2 | 0.6 | 0.3 | 10 | 0.9 | 9.1 | n.a.f |
| Pt/W-TUD-116 | 20.8 | 26.8 | 22.2 | 19.1 | 26.1 | 5.8 | 0.9 | 0.7 | 11 | 0.5 | 5.3 | n.a.f |
| Pt/W-TUD-111 | 16.0 | 19.6 | 11.3 | 17.3 | 45.2 | 6.7 | 0.7 | 0.7 | 32 | 1.0 | 13.0 | n.a.f |
| Pt/W-TUD-19 | ||||||||||||
| Pt/W-TUD-17 | 4.0 | 0 | 0 | 3.2 | 96.8 | 0 | 0.2 | 0.3 | 63 | 45.2 | 701.3 | n.a.f |
| Pt/WO3/TUD-15 | 4.7 | 72.4 | 12.7 | 0 | 4.2 | 10.7 | 0.2 | 0.5 | 8 | 0.1 | 1.6 | 3 |
| Pt/WO3/TUD-110 | 4.1 | 51.1 | 5.4 | −0.7 | 16.0 | 28.3 | 0.2 | 0.3 | 7 | 0.5 | 4.9 | 1 |
| Pt/WO3/TUD-120 | 4.9 | 49.9 | 4.9 | 0.9 | 40.3 | 3.9 | 0.2 | 0.1 | 6 | 0.7 | 7.3 | 1 |
The surface coverage of tungsten on an alumina support was recently reported by García-Fernández et al.32 They evaluated the tungsten surface density (ρW, expressed in W atoms per nm2) according to the Kerkhof–Moulijn model.33 It was found that this model was valid for a tungsten loading up to 9 wt%. At higher tungsten loadings the tungsten starts forming three-dimensional clusters. This is somewhat in agreement with our observation that at higher WO3-loadings our catalysts are becoming less acidic per tungsten atom (Table 4). Obviously, the WO3 surface density (ρWO3, expressed in WO3 molecules per nm2) at which three-dimensional clusters are formed is different for alumina and TUD-1 (a silica material). It is expected that these clusters start to form at lower ρWO3 because of the weaker interaction of a silica surface compared to an alumina surface. A strong indication for this is the decrease in surface area of the WO3/TUD-1 and Pt/WO3/TUD-1 materials and W/TUD-128 and Pt/W-TUD-128 (Table 1).
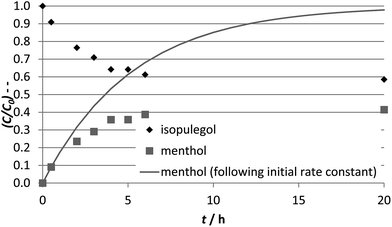
After 5 h the second stage, the hydrogenation of isopulegol to menthol, was started by replacing the nitrogen atmosphere by the reducing hydrogen atmosphere. From this point on, the Prins cyclisation and hydrogenation proceed simultaneously. After 21 h, the citronellal is completely converted over the Pt/W-TUD-1 catalysts (except for Pt/W-TUD-116) into menthol 3 and dimethyloctanol 5. When Pt/W-TUD-116 was used, some isopulegol and 4 remained. This illustrates that hydrogenation over this catalyst is not so efficient, as was also shown for the neat hydrogenation (Table 2). Isopulegol and 4 are also observed when the Pt/WO3/TUD-1 catalyst samples were used, which is in agreement with the low TOFPt for these catalysts that were determined for the hydrogenation (Table 2).
The TOFPt's for the isopulegol conversion experiment (Table 2) are lower than the TOFPt's were observed during the menthol synthesis experiment (Table 3). It was assumed that the PtOx on the catalyst would readily reduce to the active metallic Pt under 20 bar of pure hydrogen at reaction temperature but it seems that this was not the case. The 5 hours under nitrogen atmosphere might have pre-reduced the PtOx on the catalyst, resulting in a higher activity.
In this experiment, a direct comparison of the hydrogenation efficiency of the eight acidic hydrogenation catalysts is difficult, as the different catalysts are subjected to different substrate concentrations, which is a direct result from the preceding Prins cyclisation.
The five Pt/W-TUD-1 catalysts can be compared, as the initial Prins cyclisation over these catalysts was almost complete, which resulted in comparable starting concentrations of isopulegol. Using a first order rate approximation an isopulegol hydrogenation rate constant can then be derived for these catalysts. This is used to calculate initial rates r0 and TOFPt. This shows that the Pt/W-TUD-1 catalysts have TOFPt values that are in the same order of magnitude (2.3–7.7 × 10⁻² mol per molPt per s) and also comparable to those in Table 2, which is to be expected when conversions are close to 100% and Pt concentrations in the different experiments are comparable.
However, this approach cannot be applied to analysis of the Pt/WO3/TUD-1 samples, as after the initial Prins cyclisation stage only 25–30% isopulegol was produced. In order to be able to compare the hydrogenation activity under these conditions, the concentration of double bonds in citronellal that is left after Prins cyclisation was defined. A double bond hydrogenation (both carbon–carbon and carbon–oxygen double bonds) rate constant k was then calculated, assuming a first order rate approximation and similar reactivity. From these k values, initial rates r0 were calculated. These were normalized for Pt content to get TOFPt values.
The recycled Pt/WO3/TUD-1 catalysts all show a one order of magnitude lower Prins cyclisation activity, independent of the tungsten loading. This is likely due to relatively large WO3 particles of similar size that are present in these catalysts that agglomerate at comparable rates. The recycled Pt/WO3/TUD-1 catalysts are again outperformed by the Pt/W-TUD-1 catalysts in this acid catalysed citronellal conversion. However, the TOFw's of the two types of recycled catalyst are now of the same order of magnitude. Interestingly, the recycled Pt/W-TUD-1 catalysts with higher tungsten loadings (Pt/W-TUD-128, 16 and 11) now exhibit higher citronellal conversion than the catalyst with the lowest tungsten loading, which in this recycle experiment only shows minimal Prins cyclisation activity. The TOFw of the Pt/W-TUD-111 and 7 catalysts had decreased by a factor 33 and 63, respectively, while the TOFw of the Pt/W-TUD-128 and 16 only decreased by a factor 10. This indicates that the small WO3 particles that were present on the original Pt/W-TUD-111 and 7 materials are prone to agglomeration, resulting in decreased catalytic activity. So, the decrease in Prins cyclisation activity is attributed to the agglomeration of the finely dispersed small WO3 particles. The agglomeration of small WO3 particles has a relatively larger effect on the acidity of the material, and hence the acidic activity of the catalyst, than agglomeration of larger WO3 particles.
The reduced acidic activity of the bifunctional catalysts impacts the overall menthol synthesis. As less isopulegol is formed, less menthol is produced. The citronellal that is still present after 5 h of Prins cyclisation can continue to be converted into isopulegol during the hydrogenation stage. This is observed for Pt/W-TUD-128, 16 and 11 and Pt/WO3/TUD-15. However, larger amounts of 4 and 5 are now observed as citronellal can also be hydrogenated before it is converted into isopulegol. This shows that all eight catalysts still exhibit hydrogenation activity.
As the hydrogenation TOFPt with regards to menthol cannot be calculated for these recycled catalysts, it is difficult to compare the hydrogenation activities of the Pt/W-TUD-1 catalysts. However, due to the lack of acid activity for these recycled catalysts, the hydrogenation activity can still be evaluated using the same approach that was used to determine the TOFPt in the fresh Pt/WO3/TUD-1 samples in Table 3. The concentration of double bonds in citronellal that is still present after Prins cyclisation was defined and a first order rate approximation was assumed with respect to the hydrogenated products 4 and 5 to calculate a hydrogenation rate constant k for the different catalysts. Initial rates r0 were calculated from these rate constants and normalizing them on Pt content provides TOFPt values.
These TOFPt values can only be compared to the TOFPt values of the fresh Pt/WO3/TUD-1 catalysts, as they are calculated in the same way. This shows that the hydrogenation TOFPt for the Pt/WO3/TUD-1 is maintained after the recycle for Pt/WO3/TUD-120 and Pt/WO3/TUD-110, while the TOFw for Pt/WO3/TUD-15 has slightly decreased, but still has the same order of magnitude.
On the other hand, the TOFw's of Pt/W-TUD-128, 16 and 11 have decreased by a factor of 5. This is in agreement with Fig. 9A, where an increase in Pt particle size can be seen in comparison with the fresh catalyst.
Initially, the higher WO3 dispersion on the fresh Pt/W-TUD-1 catalysts compared to the fresh Pt/WO3/TUD-1 catalysts resulted in increased isopulegol formation and TOFw. However, catalysts that contain small WO3 particles, which are responsible for initial high activity (Pt/W-TUD-1), are more affected by particle agglomeration than the bulk WO3 phase that is present in the Pt/WO3/TUD-1 catalysts. As a result, the TOFw for catalysts that contained these small WO3 particles decreased more than the catalysts that contained more bulk WO3.
The hydrogenation TOFPt is higher for the catalysts containing finely dispersed WO3 particles, i.e. Pt/W-TUD-1, than for the bulk WO3 containing Pt/WO3/TUD-1 catalysts. However, recycling of the catalysts showed that the hydrogenation activity only decreased for the spent Pt/W-TUD-1 catalysts. This indicates that the Pt on the Pt/W-TUD-1 catalysts differs from the Pt on the Pt/WO3/TUD-1 samples and that the Pt on the Pt/WO3/TUD-1 is relatively stable, but less active.
As a hypothesis, this could be due to the Pt being located on the finely dispersed WO3, resulting in a more active Pt phase, but one that is deactivated more readily upon agglomeration of the small WO3 particles during reaction.32,36
Conclusions
A series of bifunctional heterogeneous catalysts was prepared through platinum impregnation of two different types of acidic tungsten oxide containing supports with different tungsten oxide loadings. A kinetic analysis was performed to compare the catalytic activities of the synthesized catalysts. These catalysts have proven to be effective in the acid catalyzed Prins cyclisation of citronellal and the subsequent hydrogenation of isopulegol into menthol. The unwanted acid catalyzed dehydroxylation was not observed for any of these catalysts.Pt/W-TUD-1 materials are more active in the Prins cyclisation of citronellal than their Pt/WO3/TUD-1 counterparts. A good dispersion of WO3 is critical for high acidity and introducing the tungsten during the TUD-1 synthesis results in a higher WO3 dispersion than after impregnation of TUD-1. Unfortunately, these small WO3 particles are more sensitive to agglomeration during the reaction and the spent Pt/W-TUD-1 catalysts have TOFw's that are more resembling the activity of the less active bulk WO3. The highest activity was observed for the fresh Pt/W-TUD-111 catalyst, attributed to an optimum between dispersion and WO3 loading, i.e. higher WO3 loading resulted in a lower dispersion, whereas a lower loading implies less available active tungsten.
The Pt/W-TUD-1 materials are also more active hydrogenation catalysts than the Pt/WO3/TUD-1 materials. No correlation between tungsten loading and hydrogenation activity exists, but there is a correlation between hydrogenation activity and the presence of small WO3 particles. The hydrogenation activity of the catalysts remains after recycling for the Pt/WO3/TUD-1 catalysts, while it decreased for the Pt/W-TUD-1 catalysts. This suggests that initially the Pt is present on the small WO3 particles in the Pt/W-TUD-1 catalysts, but this activity is lost during reaction due to agglomeration of the small WO3 particles.
Acknowledgements
J. t. D. gratefully acknowledges financial support from NWO ASPECT (053.62.020).Notes and references
- E. J. Lenardao, G. V. Botteselle, F. de Azambuja, G. Perin and R. G. Jacob, Tetrahedron, 2007, 63, 6671 CrossRef CAS
.
- C. Barrales Cortés, V. Tamayo Galván, S. Santiago Pedro and T. Viveros García, Catal. Today, 2011, 172, 21 CrossRef
.
- Y. Nie, W. Niah, S. Jaenicke and G.-K. Chuah, J. Catal., 2007, 248, 1 CrossRef CAS
.
- K. A. da Silvia Rocha, P. A. Robles-Dutenhefner, E. M. B. Sousa, E. F. Kozhevnikova, I. V. Kozhevnikov and I. V. Gusevskaya, Appl. Catal., A, 2007, 317, 171 CrossRef
.
- J. Plößer, M. Lucas and P. Claus, J. Catal., 2014, 320, 189 CrossRef
.
- A. Negoi, S. Wuttke, E. Kemnitz, D. Macovei, V. I. Parvulescu, C. M. Teodorescu and S. M. Coman, Angew. Chem., Int. Ed., 2010, 49, 8134 CrossRef CAS PubMed
.
- F. G. Cirujano, F. X. Llabrés I Xamena and A. Corma, Dalton Trans., 2012, 41, 4249 RSC
.
- G.-K. Chuah, S. H. Liu, S. Jaenicke and L. J. Harrison, J. Catal., 2001, 200, 352 CrossRef CAS
.
- Z. Yongzhong, N. Yuntong, S. Jaenicke and G.-K. Chuah, J. Catal., 2005, 229, 404 CrossRef
.
- M. Vandichel, F. Vermoortele, S. Cottenie, D. E. De Vos, M. Waroquier and V. Van Speybroeck, J. Catal., 2013, 305, 118 CrossRef CAS
.
- P. Mäki-Arvela, N. Kumar, V. Nieminen, R. Sjöholm, T. Salmi and D. Y. Murzin, J. Catal., 2004, 225, 155 CrossRef
.
- M. Fuentes, J. Magraner, C. de las Pozas and R. Roque-Malherbe, Appl. Catal., A, 1989, 47, 367 CrossRef CAS
.
- S. Telalović, A. Ramanathan, J. F. Ng, R. Maheswari, C. Kwakernaak, F. Soulimani, H. C. Brouwer, G. K. Chuah, B. M. Weckhuysen and U. Hanefeld, Chem.–Eur. J., 2011, 17, 2077 CrossRef PubMed
.
- A. Ranoux, K. Djanashvili, I. W. C. E. Arends and U. Hanefeld, RSC Adv., 2013, 3, 21524 RSC
.
- R. Nieguth, J. ten Dam, A. Petrenz, A. Ramanathan, U. Hanefeld and M. B. Ansorge-Schumacher, RSC Adv., 2014, 4, 45495 RSC
.
- Y. Chen, Z. Guo, T. Chen and Y. Yang, J. Catal., 2010, 275, 11 CrossRef CAS
.
- M. Ferrari, B. Delmon and P. Grange, Carbon, 2002, 40, 471 CrossRef
.
- D. Liu, X.-Y. Quek, S. Hu, L. Li, H. M. Lim and Y. Yang, Catal. Today, 2009, 147, S51 CrossRef CAS
.
- L. Tang, G. Luo, M. Zhy, L. Kang and B. Dai, J. Ind. Eng. Chem., 2013, 19, 620 CrossRef CAS
.
- S. K. Wilkinson, I. McManus, H. Daly, J. M. Thompson, C. Hardacre, N. Sedaie Bonab, J. ten Dam, M. J. H. Simmons, C. D'Agostino, J. McGregor, L. F. Gladden and E. H. Stitt, J. Catal., 2015, 330, 362 CrossRef CAS
.
- I. McManus, H. Daly, J. M. Thompson, E. Connor, C. Hardacre, S. K. Wilkinson, N. Sedaie Bonab, J. ten Dam, M. J. H. Simmons, E. H. Stitt, C. D'Agostino, J. McGregor, L. F. Gladden and J. J. Delgado, J. Catal., 2015, 330, 344 CrossRef CAS
.
- A. Ramanathan, M. C. C. Villalobos, C. Kwakernaak, S. Telalović and U. Hanefeld, Chem.–Eur. J., 2008, 14, 961 CrossRef CAS PubMed
.
- T. Yang, H. Ling, J.-F. Lamonier, M. Jaroniec, J. Huang, M. J. Monteiro and J. Liu, NPG Asia Mater., 2016, 8, e240 CrossRef CAS
.
- H. Ataee-Esfahani, J. Liu, M. Hu, N. Miyamoto, S. Tominaka, K. C. W. Wu and Y. Yamauchi, Small, 2013, 9, 1047 CrossRef CAS PubMed
.
- J. ten Dam, D. Badloe, A. Ramanatan, K. Djanashvili, F. Kapteijn and U. Hanefeld, Appl. Catal., A, 2013, 468, 150 CrossRef CAS
.
- T. Heikkilä, J. Salonen, J. Tuura, M. S. Hamdy, G. Mul, N. Kumar, T. Salmi, D. Y. Murzin, L. Laitinen, A. M. Kaukonen, J. Hirvonen and V. P. Lehto, Int. J. Pharm., 2007, 331, 133 CrossRef PubMed
.
- M. F. de Lange, T. J. H. Vlugt, J. Gascon and F. Kapteijn, Microporous Mesoporous Mater., 2014, 200, 199 CrossRef CAS
.
- K. S. W. Sing, D. H. Everett, R. A. W. Haul, L. Moscou, R. A. Pierotti, J. Rouquérol and T. Siemieniewska, Pure Appl. Chem., 1985, 57, 603 CrossRef CAS
.
- J. C. Groen and J. Perez-Ramirez, Appl. Catal., A, 2005, 268, 121 CrossRef
.
- NIST Standard Reference Database 20, http://srdata.nist.gov/xps.
- J. A. Moulijn, A. E. van Diepen and F. Kapteijn, Appl. Catal., A, 2001, 212, 3 CrossRef CAS
.
- S. García-Fernández, I. Gandarias, J. Requies, M. B. Güemez, S. Bennici, A. Auroux and P. L. Arias, J. Catal., 2015, 323, 65 CrossRef
.
- F. P. J. M. Kerkhof and J. A. Moulijn, J. Phys. Chem., 1979, 83, 1612 CrossRef CAS
.
- D. Hua, S.-L. Chen, G. Yuan, Y. Wang, Q. Zhao, X. Wang and B. Fu, Microporous Mesoporous Mater., 2011, 143, 320 CrossRef CAS
.
- D. G. Barton, S. L. Soled and E. Iglesia, Top. Catal., 1998, 6, 87 CrossRef CAS
.
- E. V. Ramos-Fernandez, C. J. M. Pieters, B. J. van der Linden, J. Juan Alcaniz, P. Serra Crespo, M. W. G. M. Verhoeven, J. W. Niemantsverdriet, J. Gascon and F. Kapteijn, J. Catal., 2012, 289, 42 CrossRef CAS
.
Footnote |
| † Electronic supplementary information (ESI) available. See DOI: 10.1039/c6ra25931f |
| This journal is © The Royal Society of Chemistry 2017 |

