 Open Access Article
Creative Commons Attribution 3.0 Unported Licence
Novel fungal hyphae/Fe3O4 and N-TiO2/NG composite for adsorption and photocatalysis
Yiren lian ab,
Xueyuan Baic,
Xueqian Lid,
Zhan Gaoe,
Zuowen Hu*b and
Guozhen Hu*b
aGraduate School of CAEP, Mianyang, Sichuan 621900, China
bCAEP Institute of Technology, Miangyang, Sichuan 621900, China. E-mail: ZuowenHu2000@hotmail.com
cLaboratory of Extreme Conditions Matter Properties, Southwest University of Science and Technology, Mianyang, 621010, China
dState Key Laboratory of Clean Energy Utilization, Zhejiang University, Hangzhou, 31000, China
eKey Lab. for Power Machinery and Engineering of M. O. E., Shanghai Jiao Tong University, Shanghai, 200240, China
First published on 20th January 2017
Abstract
Nano TiO2 particles are applied in photocatalysis but are difficult to recycle. Meanwhile, low light transmission and a lack of oxygen in solution also causes a decrease in photocatalytic efficiency. Here, we prepare a mycelium pellet to anchor TiO2 particles, which can float on the surface of aqueous solutions and enrich organic materials. The mycelium pellet is a three-layered sphere, in which the innermost layer is fungal hyphae, the middle layer is fungal hyphae/Fe3O4, and the outer layer is fungal hyphae/N-TiO2/NG. In comparison to TiO2 particles, the mycelium pellet is not only convenient to recycle, but can also easily receive light and oxygen. The results of adsorption and photocatalytic activity tests clearly indicate that the floatable mycelium pellet could be a potential photocatalytic material for practical applications.
1. Introduction
Recently, photocatalysis has received intensive attention as an ideal method to control pollution in organic wastewater by the utilization of light energy. Among various photocatalysts, titanium dioxide (TiO2) has been widely investigated due to its superior properties, such as high chemical stability, high cost-efficiency, exceptional optoelectronic properties, and non-toxicity.1–4 However, while TiO2 is easily dispersed in solution, it is difficult to separate from a solution, causing secondary dust pollution. Therefore, it is essential to search for ways to fabricate macro-scale TiO2 composites to realize its practical application.Fungal hyphae (FH) as a kind of filamentous microorganism, which possesses extremely strong vitality and reproductive capacity, can grow rapidly within several days from single cells to a macro-scale microbe, with a length of a centimetre and a diameter less than 10 μm.5,6 Therefore, it can be easily available in large quantities, facilitating its practical application. Moreover, the advantages of its low cost, environmental friendliness and unique structure have led to a considerable amount of research. The superiority of biomass carriers makes them suitable for use in the fabrication of new biocomposites for application in many fields, such as batteries,7,8 catalysis,9,10 wastewater treatment,11,12 and in the synthesis of various noble metal nanoparticles.13–15 Thus, fungal hyphae, as a template for the loading of TiO2 nanoparticles, may address the above issue. This is feasible because TiO2 can easily anchor on the cell walls of fungal hyphae, building a bridge between the micro and macro worlds due to bonding with large quantities of functional groups, such as phosphonate, hydroxyl, and amine groups.16 Besides, the high adsorption capacity of FH is beneficial to the efficiency of photocatalysis, and the combination of FH and TiO2 may result in a synergistic effect. Nevertheless, only a small quantity of TiO2 can be attached to the surface of fungal hyphae due to the lack of active sites.
Graphene (Gr, two-dimensional planar structure) has a high specific surface area and abundant active sites.17 Therefore, Gr is expected to work as a platform for loading TiO2 and connecting with fungal hyphae. Moreover, the combination of TiO2 and graphene also generates a synergistic effect to improve photocatalytic activity by enhancing the adsorption and charge transfer rate.18,19 In order to enhance the sensitivity of TiO2 to visible light, nitrogen-doping could be adopted to increase the visible-light response of TiO2.20 According to previous reports, a combination of N-doped TiO2 and graphene (NTG) exhibited a higher photocatalytic activity than single nitrogen-doping or the introduction of graphene under visible light.21
Magnetic collection is a simple and efficient approach to separate a catalyst from solution. Fe3O4 nanoparticles have been widely studied for wastewater treatment due to their excellent magnetic behaviour.22–24 For example, a new adsorbent consisting of nano-Fe3O4 and polymer was reported for the removal of Cr(VI), which is easily separated from solution with magnetic nanoparticles.25 Therefore, we introduced nano-Fe3O4 for better recycling of FMT. In this work, FMT was successfully synthesized with FH, nano-Fe3O4, and NTG by a simple co-culture method. After freeze drying and heating at 90 °C, FMT could be suspended on the surface of a solution, and thus easily received light and oxygen compared to membranes or powdered materials, which reacted in solution. Moreover, it could also be easily oriented and separated from the solution under an applied magnetic field due to its magnetic properties. Tannin was selected as a typical organic material to investigate the adsorption ability and photocatalytic activity under simulated solar light irradiation.
2. Experimental section
2.1 Materials
The fungus (penicillium) was purchased from the Microbiology Department of East China Institute of Technology. Graphite powder (≥99.85% purity) was purchased from Shanghai Huayi Group Company. Ti(SO4)2·9H2O (≥96.4% purity) was purchased from Sinopharm Chemical Reagent Co., Ltd. All other chemicals of analytical grade were available from Chengdu Kelong Chemical Co., Ltd. All solutions were prepared using Milli-Q water and analytical grade chemicals.2.2 Synthesis of FMT
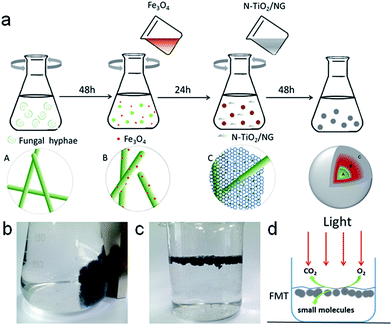
A schematic diagram of the synthesis route is shown in Scheme 1a. First of all, the magnetic nanoparticles were prepared by a co-precipitation method.26 Briefly, 8.11 g FeCl3·6H2O, 2.98 g FeCl2·4H2O, and 5.85 g NaCl were added to 400 mL deionized water. Then, 100 mL of 1 mol L−1 NaOH solution was added gradually to the mixed solution under magnetic stirring and N2 (g) atmosphere. After that, nano-Fe3O4 particles were separated with a strong magnet. Nano-Fe3O4 particles were washed with deionized water and centrifuged at 4000 rpm three times. Finally, the magnetic nanoparticles were freeze-dried for future use.The NTG composite was prepared as follows. First, GO solution (0.6 mg L−1) was prepared from graphite powder by a modified Hummers method.27 The as-prepared GO solution was first sonicated for 0.5 h, and then 65 mL GO solution, 5 mL NH3 (pure 25–28%), and 1 g Ti(SO4)2·9H2O were mixed in a 100 mL Teflon-lined stainless steel autoclave under vigorous stirring at room temperature. After that, the mixture was heated at 160 °C for 20 h in an oven and cooled down to room temperature, and the black precipitate in the autoclave was treated by centrifugation and washing several times. Finally, the sample was further dispersed under ultrasound.
FTM was synthesized with FH, as-prepared Fe3O4, and NTG by a co-culture method. Spores of fungus and 150 mL of medium (containing 2% glucose, 0.25% yeast, 0.25% peptone) were added to a 250 mL flask and grown in a rotary shaker with a shake rate of 130 rpm at 30 °C for 48 h. Then, about 0.2 g nano-Fe3O4 particles were added to the suspensions mentioned above, and the mixed solutions were cultivated in the rotary shaker again for 24 h. Next, excess NTG was added to the mixture and grown for another 48 h. Finally, the obtained composites were washed several times with deionized water to remove superfluous organic material and particles. The magnetic FMT hydrogel can be seen in Scheme 1b. The composite was freeze-dried, and then heated at 90 °C for 24 hours. FMT aerogel is shown floating in aqueous solution in Scheme 1c. This can easily receive light and oxygen on the surface of water, and tannin can be effectively degraded into small molecules, such as CO2 and H2O, under simulated solar light (Scheme 1d).
2.3 Characterization
The surface morphology of samples was characterized by scanning electron microscopy (SEM, Zeiss Ultra 55). The crystalline phases were identified with an X-ray diffractometer (PANalytical, Netherlands) with Cu-Kα radiation (λ = 1.5406 Å). The surface functional groups were identified by Raman spectroscopy and Fourier transform infrared spectroscopy (FTIR, PE Spectrum One), and the elementary compositions and bonding energies were analyzed by X-ray photoelectron spectroscopy (XPS, SSX-100). The band gaps of compound semiconductors were estimated with a UV-visible spectrophotometer (UV-3150, Shimadzu, Japan) with a diffuse reflectance accessory.2.4 Adsorption and photocatalytic measurement
Adsorption experiments were conducted in a 200 mL beaker under magnetic stirring and kept in the dark; 50 mg FMT, 5 mg tannin, and 100 mL deionized water were added to the beaker (room temperature, pH = 6.5 (±0.1), m/V = 0.5 g L−1). The mixed solution was measured hourly with a UV2600A spectrophotometer. Photocatalytic testing was carried out in a 500 mL beaker, to which was added 0.5 g sample, 300 mL deionized water, and 30 mg tannin. The mixture was placed in the dark to reach an equilibrium concentration of tannin. Then, the reaction mixture was irradiated with light (xenon lamp, 500 W) and kept standing. The reaction mixture was collected to be measured half-hourly with the UV2600A spectrophotometer. The concentration of tannin was analysed with the UV2600A spectrophotometer at 215 nm.3. Results and discussion
3.1 Characterization
Photographs of the FH and FMT hydrogels are respectively shown in Fig. 1a and b. These are spherical and the size of the spheres was about 1 cm. The surface colour of FMT is clearly different from that of the FH surface, indicating a possible coating of NTG on FH. An SEM image of the surface morphology of FH is shown in Fig. 1c. FH is composed of numerous micron-sized filamentous biomasses and a handful of biomass mucosa, which are crisscrossed and distributed irregularly in the space. Nevertheless, Fig. 1d shows that the structure of the FMT surface is covered with abundant sheets, which are considered to be NTG, and little fungal hyphae are exposed on the surface. In order to clearly identify the sheets and understand the structure, higher resolution images of the FH and FMT surfaces have been obtained. The higher resolution image of fungal hyphae shown in Fig. 1e indicates that the diameter of the fungal hyphae is about 2.5 μm and that their surface is smooth. On the contrary, Fig. 1f shows that the surface of FMT is filled with different sized sheets whose structure is similar to that of GO sheets.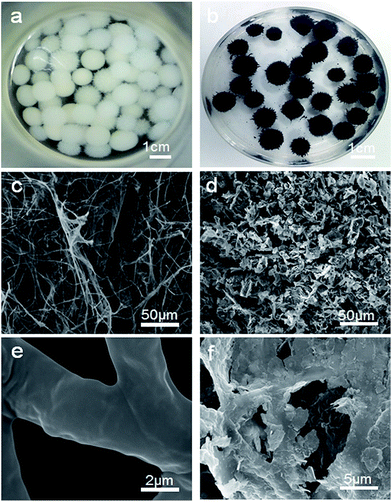 | ||
| Fig. 1 Digital photos of the samples: (a) pure fungus and (b) FMT composite; SEM images of (c and e) pure fungus and (d and f) the surface of FMT composite. | ||
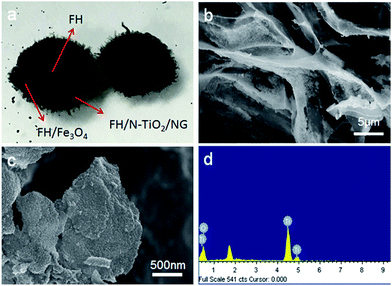
As shown in Fig. 2a, the cross-sectional structure of FTM hydrogel shows the three-layered structure of FMT. The middle layer is believed to consist of Fe3O4 nanoparticles and fungal hyphae, and this can be confirmed with Fig. 2b, which shows that the Fe3O4 nanoparticles adhere to the surface of FH and biomass mucosa. The outer layer is composed of N-TiO2/NG and fungus. As shown in Fig. 2c, a sheet from the surface of FMT is evenly covered with a large number of small particles, which are believed to be TiO2 nanoparticles, and the EDS measurement (Fig. 2d) reveals that the main elements are Ti and O, confirming the coverage of TiO2 nanoparticles on graphene sheets.
Fig. 3a shows a TEM image of NTG in the FMT composite. TiO2 is successfully coated and anchored on GO by chemical bonds, such as Ti–C or Ti–O–C, after the hydrothermal reaction. Meanwhile, the crystallite sizes of TiO2 were also investigated by high-resolution transmission electron microscopy (HRTEM), as shown in Fig. 3b. The sizes of the TiO2 particles are around 10 nm and the interplanar spacings of TiO2 nanoparticles were calculated as 0.343 nm, corresponding to the (101) crystallographic planes of anatase TiO2. Furthermore, a selected area electron diffraction (SAED) pattern of NTG (Fig. 3c) displayed a series of discontinuous Debye–Scherrer rings, which corresponded to the (101), (004), (200), and (105) phases of anatase TiO2. Fig. 3d shows the crystalline phases of TiO2/GO and NTG. It can be seen that the peaks of TiO2/GO and NTG are similar and no crystalline phase related to nitrogen was found. The peaks are exactly consistent with the crystal planes (JCPDS, no. 21-1272). It is noted that the absence of the peak at 10.8° implies that GO was successfully reduced to graphene. Nevertheless, the peak of graphene expected at about 26° is not present. It can be shown that the TiO2 anchored on graphene resulted in a high intensity peak, which covered that of graphene.28 Fig. 3e displays the Raman spectra of TiO2/GO and NTG. Peaks related to the anatase phases,29 148 (Eg), 198 (Eg), 395 (B1g), 510 (A1g), and 628 (Eg) cm−1 are observed in the Raman spectra. In addition, the peaks at 1355 and 1596 cm−1 represent the D and G bands, respectively. The D band indicates the presence of sp3 defects and structural disorder in graphene, while the G band is common to sp2-hybridized C![[double bond, length as m-dash]](https://www.rsc.org/images/entities/char_e001.gif) C.30 The intensity ratios of the D/G bands for TiO2/GO and NTG (1.00 and 1.12, respectively) are higher than that of GO reported in a preview paper, which confirms the presence of graphene sheets in TiO2/GO and NTG composites.31
C.30 The intensity ratios of the D/G bands for TiO2/GO and NTG (1.00 and 1.12, respectively) are higher than that of GO reported in a preview paper, which confirms the presence of graphene sheets in TiO2/GO and NTG composites.31
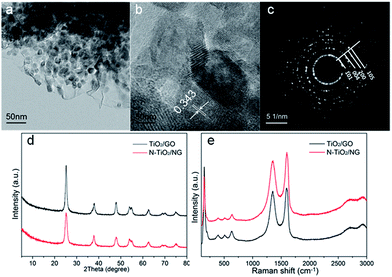 | ||
| Fig. 3 (a) TEM image, (b) HRTEM image and (c) SAED pattern of NTG composites; (d) XRD patterns of TiO2/GO and NTG; (e) Raman spectra of TiO2/GO and NTG. | ||
As shown in Fig. 4a, the XPS survey spectra indicate that the main components of TiO2/GO and NTG are Ti, O, and C. The peak at around 400 eV, corresponding to N 1s, indicates that nitrogen is doped in the TiO2/GO composite and the elementary compositions of NTG, for Ti, O, C, and N, are 20.22 atom%, 29.75 atom%, 47.35 atom%, and 2.68 atom%, respectively. Fig. 4b shows a comparison of TiO2/GO and NTG with Ti 2p high-resolution XPS spectra. Compared with TNTs/GO at 458.9 and 465.1 eV, the bonding energies of NTG show a shift to lower energies. This is because the nitrogen is incorporated into the TiO2 lattice and replaces the oxygen atoms, leading to lower binding energies.32,33 The C 1s high-resolution XPS spectrum of NTG is displayed in Fig. 4c. It should be resolved into four peaks assigned to C![[double bond, length as m-dash]](https://www.rsc.org/images/entities/char_e001.gif) C, C–O, C
C, C–O, C![[double bond, length as m-dash]](https://www.rsc.org/images/entities/char_e001.gif) O and Ti–O–C. However, the positions of the bonding energies can not match with C
O and Ti–O–C. However, the positions of the bonding energies can not match with C![[double bond, length as m-dash]](https://www.rsc.org/images/entities/char_e001.gif) C, C–O, C
C, C–O, C![[double bond, length as m-dash]](https://www.rsc.org/images/entities/char_e001.gif) O and Ti–O–C. This is due to the doping of nitrogen into graphene causing the change of the bonding energies. Therefore, it is resolved into four peaks at 284.7 eV (C
O and Ti–O–C. This is due to the doping of nitrogen into graphene causing the change of the bonding energies. Therefore, it is resolved into four peaks at 284.7 eV (C![[double bond, length as m-dash]](https://www.rsc.org/images/entities/char_e001.gif) C), 285.3 eV (C
C), 285.3 eV (C![[double bond, length as m-dash]](https://www.rsc.org/images/entities/char_e001.gif) N/C–O), 286.7 eV (C–N/C
N/C–O), 286.7 eV (C–N/C![[double bond, length as m-dash]](https://www.rsc.org/images/entities/char_e001.gif) O) and 288.9 eV (N–C
O) and 288.9 eV (N–C![[double bond, length as m-dash]](https://www.rsc.org/images/entities/char_e001.gif) O/Ti–O–C), and no peak appeared at 281 eV which represents Ti–C bond indicating that carbon was not doped into the TiO2 lattice.34–36 Moreover, the N 1s spectrum of NTG (Fig. 4d) is deconvolved into three peaks at 398.5, 400, and 401.6 eV, which are assigned to Ti–N/pyridinic N, pyrrolic N/O–Ti–N, and quaternary N. This further suggests the doping of N into TiO2/GO.
O/Ti–O–C), and no peak appeared at 281 eV which represents Ti–C bond indicating that carbon was not doped into the TiO2 lattice.34–36 Moreover, the N 1s spectrum of NTG (Fig. 4d) is deconvolved into three peaks at 398.5, 400, and 401.6 eV, which are assigned to Ti–N/pyridinic N, pyrrolic N/O–Ti–N, and quaternary N. This further suggests the doping of N into TiO2/GO.
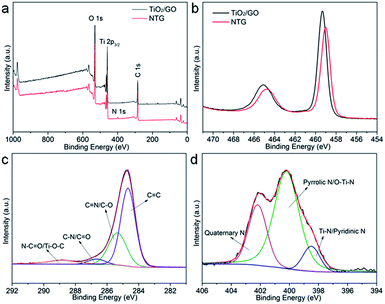 | ||
| Fig. 4 (a) Survey XPS spectra of TiO2/GO and NTG; (b) high-resolution Ti 2p core level XPS spectra of TiO2/GO and NTG; (c and d) high-resolution C 1s and N 1s core level XPS spectra of NTG. | ||
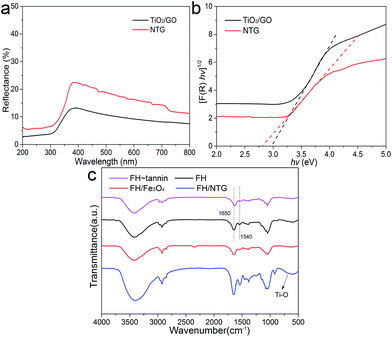
The optical properties of TiO2/GO and NTG were investigated with UV-vis diffuse reflectance spectra. As shown in Fig. 5a, it is observed that TiO2/GO and NTG both show a low reflectance in the ultraviolet and visible light regions. The corresponding plots of [F(R)hν]1/2 vs. hν are displayed in Fig. 5b. The band gap energies are estimated from the extrapolated value from UV-vis diffuse reflectance spectroscopy, and the result indicates that the values for TiO2/GO and NTG are 2.96 and 2.59 eV, respectively. Comparing TiO2/GO and NTG indicates that the introduction of nitrogen causes narrowing of the band gap.
The FTIR spectra of FH, FH–tannin, FH/Fe3O4, and FH/NTG are shown in Fig. 5c. Various functional groups can be found in the FTIR spectrum of fungal hyphae. It can be observed that the characteristic bands correspond to O–H and N–H at 3400 cm−1, –CH, –CH2, and –CH3 at ∼2900 cm−1, C![[double bond, length as m-dash]](https://www.rsc.org/images/entities/char_e001.gif) O stretching (amide I) and –NH2 related to proteins at ∼1650 cm−1, N–H and C–N stretching related to proteins (amide II) at ∼1540 cm−1, and C–OH associated with phosphorylated proteins and alcohols at ∼1050 cm−1.37,38 The similarity of the FTIR spectra of FH and FH/Fe3O4 indicates that the main functional groups remain. Nevertheless, the intensities of characteristic bands in the FH/NTG spectra increased, indicating that the surface functional groups changed. In addition, the bands at 500–700 cm−1 presenting in the FH/NTG FTIR spectrum correspond to the Ti–O–Ti stretching vibration modes in crystalline TiO2.39
O stretching (amide I) and –NH2 related to proteins at ∼1650 cm−1, N–H and C–N stretching related to proteins (amide II) at ∼1540 cm−1, and C–OH associated with phosphorylated proteins and alcohols at ∼1050 cm−1.37,38 The similarity of the FTIR spectra of FH and FH/Fe3O4 indicates that the main functional groups remain. Nevertheless, the intensities of characteristic bands in the FH/NTG spectra increased, indicating that the surface functional groups changed. In addition, the bands at 500–700 cm−1 presenting in the FH/NTG FTIR spectrum correspond to the Ti–O–Ti stretching vibration modes in crystalline TiO2.39
3.2 The analysis of adsorption and photocatalysis
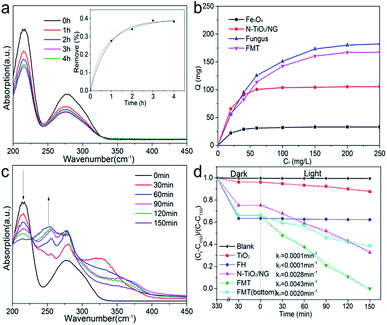
Fig. 6a shows ultraviolet spectra of tannin at different times. Two characteristic peaks of tannin can be seen at 215 and 275 nm. The decrease in the intensities of the peaks confirms the adsorption of tannin. Moreover, the concentration of tannin at different times was measured at 275 nm to determine the sorption kinetics of tannin on FTM. The inset image shows that the data fits well with both the pseudo-first-order and pseudo-second-order kinetics models, indicating that the adsorption of tannin could be a physical and chemical process. The pseudo-first-order and pseudo-second-order equations are as follows:
ln(qe − qt) = ln![[thin space (1/6-em)]](https://www.rsc.org/images/entities/char_2009.gif) qe − k1 qe − k1
| (1) |
| t/qt = 1/k2qe2 + t/qe | (2) |
| Sample | Pseudo-first-order | Pseudo-second-order | ||||
|---|---|---|---|---|---|---|
| qe (mg L−1) | k1 (h−1) | R2 | qe (mg L−1) | k2 (g mg−1 h−1) | R2 | |
| FTM | 38.93 | 1.196 | 0.996 | 45.61 | 0.147 | 0.996 |
Fig. 6b shows the adsorption isotherms of Fe3O4, N-TiO2/NG, fungus, and FMT at room temperature. The adsorption capacity of these samples follow the order: Fe3O4 < N-TiO2/NG < FMT < FH. The adsorption capacity of Fe3O4 is far below that of N-TiO2/NG and FH, suggesting that the compositions of FH and N-TiO2/NG in FMT lead to the adsorption of tannin. FH shows the best adsorption of tannin among these samples and this is because the abundant polysaccharides, proteins, and phosphate groups on the surface of the FH cell walls cause various chemical and physical interactions between FH and tannin. For instance, the FTIR measurements of FH and FH–tannin (after adsorption of tannin), shown in Fig. 5c, indicate that the positions of the peaks at ∼1540 and ∼1650 cm−1, which are assigned to the amine groups, undergo a red shift after the adsorption of tannin, due to the hydrogen-bonding interaction between FH and tannin.40 Furthermore, the significant adsorption by N-TiO2/NG in FMT could be generated because the graphene oxide derivatives, such as carbonyl, epoxy, and hydroxyl groups, enable it to interact with tannin. The aromatic rings of graphene and tannin suggest the formation of π–π stacking.41 In addition, the amine groups on the surface of graphene, originating from the process of N-doping, also contribute to the sorption of tannin.
The high adsorption capacity for tannin means a larger concentration of tannin on the surface of FMT, which is conducive to photocatalysis. Therefore, the tannin can be effectively degraded into small molecules under simulated solar light. Fig. 6c shows the UV/Vis spectra of the reaction mixture within 150 min under simulated sunlight. It can be seen that a continuously decreasing peak at 215 nm confirms the degradation of tannin, while an increasing peak at 255 nm, which is absent at the beginning, illustrates a new compound formed after light irradiation.
Fig. 6d shows the photocatalytic degradation of tannin with TiO2, FH, N-TiO2/NG, FMT, and FMT(bottom) in static solution under simulated sunlight. The ordinate is set as (Ct − C150)/(C − C150) to achieve an intuitive expression. Ct is the concentration of tannin at time t and C is the initial concentration. C150 is the concentration of tannin degraded by FMT at 150 min. No clear decrease in tannin was shown by the blank curve (no catalyst), indicating the stability of tannin under visible light irradiation. It is noted that the quantity of tannin decreased sharply during the first 5 h of the enrichment of tannin on the surface of the samples, and FH absorbed the most tannin, corresponding to the results of the absorption analysis. With simulated sunlight irradiation, the decreased concentrations of tannin confirmed its degradation. For a further study, the data for these samples is analysed by linear fitting, and the parameters (k) that are proportional to the reaction rates are calculated as follows: k1 = 0.0001 min−1 (TiO2), k2 < 0.0001 min−1 (FH), k3 = 0.0028 min−1 (N-TiO2/NG), k4 = 0.0043 min−1 (FMT), and k5 = 0.0020 min−1 (FMT(bottom), FMT was forced to the bottom of the beaker by magnetic attraction). The photocatalytic performance of TiO2 under visible light is poor, but is greatly enhanced after doping of nitrogen and the introduction of graphene. The low reaction rate with FH demonstrates that tannin cannot be degraded by FH, and the high content of FH on FMT(bottom) mainly leads to a lower photocatalytic performance compared to that of N-TiO2/NG. It can be noted that the photocatalytic performance of FMT(bottom) is far more than can be accounted for by the content of N-TiO2/NG in FMT(bottom), which indicates that some synergistic effects resulted from the combination of FH and N-TiO2/NG. Comparing FMT(bottom) and FMT, the significant difference in their performances indicates that the floating state in this work is beneficial for photocatalysis.
4. Conclusions
In summary, functional FMT, which is a three-layered structure, was prepared by a simple, environmentally friendly co-culture method. The magnetic characteristics resulting from the introduction of nano-Fe3O4 are beneficial with respect to recycling FMT without secondary pollution. Moreover, a superior adsorption ability is obtained due to the functional groups from the FH and N-TiO2/NG in FMT. The photocatalytic performance under solar light displays the degradation of tannin with N-TiO2/NG. In addition, its high availability and ease of production make FMT suitable as a potential material for water treatment.Acknowledgements
This work was financially supported by the Graduate School of CAEP, CAEP Institute of Technology, Laboratory for Extreme Conditions Matter Properties, Southwest University of Science and Technology, State Key Laboratory of Clean Energy Utilization of Zhejiang University and the Key Lab. for Power Machinery and Engineering of M. O. E. of Shanghai Jiao Tong University.Notes and references
- O. K. Varghese, M. Paulose, T. J. Latempa and C. A. Grimes, Nano Lett., 2009, 9, 731–737 CrossRef CAS PubMed.
- J. Yu, Y. Wang and W. Xiao, J. Mater. Chem. A, 2013, 1, 10727–10735 CAS.
- J. Yang, X. Zhang, B. Li, H. Liu, P. Sun, C. Wang, L. Wang and Y. Liu, J. Alloys Compd., 2014, 584, 180–184 CrossRef CAS.
- W. A. Velema, W. Szymanski and B. L. Feringa, J. Am. Chem. Soc., 2014, 136, 2178–2191 CrossRef CAS PubMed.
- R. R. Lew, Nat. Rev. Microbiol., 2011, 9, 509–518 CrossRef CAS PubMed.
- A. Sugunan, P. Melin, J. Schnürer, J. G. Hilborn and J. Dutta, Adv. Mater., 2007, 19, 77–81 CrossRef CAS.
- L. Zhang, Y. Wang, B. Peng, W. Yu, H. Wang, T. Wang, B. Deng, L. Chai, K. Zhang and J. Wang, Green Chem., 2014, 16, 3926–3934 RSC.
- L. Zhang, Nano Energy, 2015, 17, 224–232 CrossRef.
- N. C. Bigall, M. Reitzig, W. Naumann, P. Simon, K. H. van Pée and A. Eychmüller, Angew. Chem., Int. Ed., 2008, 47, 7876–7879 CrossRef CAS PubMed.
- L. Du, Q. Xu, M. Huang, L. Xian and J. X. Feng, Mater. Chem. Phys., 2015, 160, 40–47 CrossRef CAS.
- W. Cheng, C. Ding, Y. Sun and X. Wang, Chem. Eng. J., 2015, 269, 1–8 CrossRef CAS.
- X. Xu, L. Xia, Q. Huang, J. D. Gu and W. Chen, Environ. Technol., 2012, 33, 1661–1670 CrossRef CAS PubMed.
- A. Ahmad, P. Mukherjee, S. Senapati, D. Mandal, M. I. Khan, R. Kumar and M. Sastry, Colloids Surf., B, 2003, 28, 313–318 CrossRef CAS.
- A. M. Fontes, R. Geris, A. V. D. Santos, M. G. Pereira, J. G. S. Ramalho, A. F. D. Silva and M. Malta, Biomater. Sci., 2014, 7, 956–960 RSC.
- K. B. Narayanan and N. Sakthivel, Adv. Colloid Interface Sci., 2010, 156, 1–13 CrossRef CAS PubMed.
- B. Volesky, Water Res., 2007, 41, 4017–4029 CrossRef CAS PubMed.
- Y. Sun, Q. Wang, C. Chen, X. Tan and X. Wang, Environ. Sci. Technol., 2012, 46, 6020–6027 CrossRef CAS PubMed.
- T. D. Nguyen-Phan, V. H. Pham, E. W. Shin, H. D. Pham, S. Kim, S. C. Jin, E. J. Kim and S. H. Hur, Chem. Eng. J., 2011, 170, 226–232 CrossRef CAS.
- L. Liu, Z. Liu, A. Liu, X. Gu, C. Ge, F. Gao and L. Dong, ChemSusChem, 2014, 7, 618–626 CrossRef CAS PubMed.
- Y. Zhao, X. Qiu and C. Burda, Chem. Mater., 2008, 20, 2629–2636 CrossRef CAS.
- C. Liu, L. Zhang, R. Liu, Z. Gao, X. Yang, Z. Tu, F. Yang, Z. Ye, L. Cui and C. Xu, J. Alloys Compd., 2015, 656, 24–32 CrossRef.
- L. Li, M. Xu, M. Chubik, M. V. Chubik, A. Gromov, G. D. Wei and W. Han, RSC Adv., 2015, 5, 41611–41616 RSC.
- Q. Zhang, T. Lu, D. M. Bai, D. Q. Lin and S. J. Yao, Chem. Eng. J., 2015, 284, 972–978 CrossRef.
- L. Chai, Y. Wang, N. Zhao, W. Yang and X. You, Water Res., 2013, 47, 4040–4049 CrossRef CAS PubMed.
- T. Wang, L. Zhang, C. Li, W. Yang, T. Song, C. Tang, Y. Meng, S. Dai, H. Wang and L. Chai, Environ. Sci. Technol., 2015, 49, 5654–5662 CrossRef CAS PubMed.
- P. J. Vikesland, A. M. Heathcock, R. L. Rebodos and K. E. Makus, Environ. Sci. Technol., 2007, 41, 5277–5283 CrossRef CAS PubMed.
- W. S. Hummers and R. E. Offeman, J. Am. Chem. Soc., 1958, 80, 1339 CrossRef CAS.
- S. Linley, Y. Y. Liu, C. J. Ptacek, D. W. Blowes and F. X. Gu, ACS Appl. Mater. Interfaces, 2014, 6, 4658–4668 CAS.
- L. Kumaresan, A. Prabhu, M. Palanichamy, E. Arumugam and V. Murugesan, J. Hazard. Mater., 2011, 186, 1183–1192 CrossRef CAS PubMed.
- C. Chen, W. Cai, M. Long, B. Zhou, Y. Wu, D. Wu and Y. Feng, ACS Nano, 2010, 4, 6425–6432 CrossRef CAS PubMed.
- Y. Wang, J. Yu, W. Xiao and Q. Li, J. Mater. Chem. A, 2014, 2, 3847–3855 CAS.
- Y. Zhang, W. Zhu, X. Cui, W. T. Yao and T. Duan, CrystEngComm, 2015, 17, 757–762 Search PubMed.
- Y. Cong, J. Zhang, F. Chen, A. Masakazu Anpo and D. He, J. Phys. Chem. C, 2007, 111, 10618–10623 CAS.
- F. Pei, Y. Liu, S. Xu, L. Jing, C. Wang and S. Cao, Int. J. Hydrogen Energy, 2013, 38, 2670–2677 CrossRef CAS.
- V. Etacheri, J. E. Yourey and B. M. Bartlett, ACS Nano, 2014, 8, 1491–1499 CrossRef CAS PubMed.
- Y. Tang, D. Wu, S. Chen, F. Zhang, J. Jia and X. Feng, Energy Environ. Sci., 2013, 6, 2447–2451 CAS.
- W. Cheng, M. Wang, Z. Yang, Y. Sun and C. Ding, RSC Adv., 2014, 4, 61919–61926 RSC.
- A. R. Badireddy, S. Chellam, P. L. Gassman, M. H. Engelhard, A. S. Lea and K. M. Rosso, Water Res., 2010, 44, 4505–4516 CrossRef CAS PubMed.
- B. Jiang, C. Tian, W. Zhou, J. Wang, Y. Xie, Q. Pan, Z. Ren, Y. Dong, D. Fu and J. Han, Chem.–Eur. J., 2011, 17, 8379–8387 CrossRef CAS PubMed.
- W. Li, W. Yao, W. Zhu, C. Xi and T. Duan, J. Radioanal. Nucl. Chem., 2016, 1–10 Search PubMed.
- E. Lee, J. Y. Hong, H. Kang and J. Jang, J. Hazard. Mater., 2012, 219–220, 13–18 CrossRef CAS PubMed.
| This journal is © The Royal Society of Chemistry 2017 |

