 Open Access Article
Creative Commons Attribution 3.0 Unported Licence
Electrocatalytic oxidation and determination of dexamethasone at an Fe3O4/PANI–CuII microsphere modified carbon ionic liquid electrode
Azadeh Fatahia,
Reihaneh Malakootia and
Mohsen Shahlaei *b
*b
aNanochemistry Research Laboratory, Department of Chemistry, University of Birjand, Birjand, Iran
bNano Drug Delivery Research Center, Department of Medicinal Chemistry, Kermanshah University of Medical Sciences, Kermanshah, Iran. E-mail: mohsenshahlaei@yahoo.com; mshahlaei@kums.ac.ir; Fax: +98-833-4276493; Tel: +98-833-4276489
First published on 13th February 2017
Abstract
A novel, simple, sensitive and selective electrochemical sensor based on an Fe3O4/PANI–CuII microsphere modified carbon ionic liquid electrode is constructed and utilized for the determination of dexamethasone. The synthesized Fe3O4/PANI–CuII microspheres are characterized by routine methods such as X-ray photoelectron spectroscopy (XPS), X-ray diffraction (XRD), transmission electron microscopy (TEM), scanning electron microscopy (SEM), Fourier transform infrared spectroscopy (FT-IR), thermo gravimetric analysis (TGA), and inductively coupled plasma atomic emission spectroscopy (ICP-AES). The Fe3O4/PANI–CuII microspheres can significantly accelerate the electron transfer rate and represent excellent synergistic electrochemical activity for the oxidation of dexamethasone. Differential pulse voltammetry (DPV) was used for the quantitative determination of dexamethasone. As shown, the oxidation peak current is linear with the concentration of dexamethasone in the range of 0.05 to 30 μM with a detection limit of 3.0 nM which is more sensitive than most of the previously reported methods. The proposed method is successfully applied to the sensitive determination of dexamethasone in real samples with satisfactory recoveries.
1. Introduction
Dexamethasone-11b,16a-9-fluoro-11,17,21-trihydroxy-16-methylpregna-1,4-diene-3,20-dione, abbreviated here as DXM, is a potent synthetic derivative of the glucocorticoid hydrocortisone. It is regularly employed as an anti-inflammatory and immunosuppressive agent for the treatment of conditions such as inflammation, allergy, and autoimmune conditions.1,2 This medication has been added to the list of banned medications because of its misuse as a doping agent in sports such as cycling and horse racing to improve performance.3 Therefore, development of new, sensitive, selective and simple analytical approaches and techniques for determining dexamethasone in biological fluids such as plasma and urine is essential after administration for efficient and safe use. Different reports have been published in the literature for determining dexamethasone which include LC-MS,4–6 LC-MS-MS,7 GC-MS detection,8 HPLC chemiluminescence9,10 thin-layer chromatography,11 and electrochemical detection.12 Although these approaches show some merits, they are disadvantageous due to the complicated instruments required and the associated time-consuming sample pretreatment. Electrochemical techniques make a good candidate for the analysis of dexamethasone due to their practicality, simplicity, low-cost, and ease of miniaturization for small-volume samples.3,13,14 In recent years, carbon ionic liquid electrode (CILE), which is prepared by incorporating an ionic liquid as both binder and modifier in carbon paste electrode (CPE) have been widely used in the field of electrochemical sensing.15–17 These types of sensors have different advantages such as low cost, easy preparation, high sensitivity, high conductivity, wide electrochemical windows, antifouling effect and renewable surface. Composites of conducting polymers (CPs) and metal nanoparticles have received much attention in the last decades because of their various applications such as catalysts, biosensors and capacitors.18,19 Incorporation of metal nanoparticles would preserve the properties of low dimensional conductors, enhance the conductivity of polymers, and obtain high surface areas. The incorporation of Fe3O4 nanoparticles into polyaniline (PANI) matrix has been extensively studied because Fe3O4–PANI composite reveals characteristics through the combination of both components including good biocompatibility, large surface areas, good electrochemical stability and enhanced electrocatalytic activity.20 Recently, Fe3O4 composites or hybrids doped with noble or other transition metals have attracted great attention, because of their doping or synergetic effect. These effects have meaningfully broadened the property and potential application value of Fe3O4 nanomaterials.21–23 Among them, Cu loaded onto Fe3O4 improve the catalytic activity due to the synergetic effect.24 In this research study, a novel electrochemical sensor was generated for determining of DXM based on Fe3O4/PANI–CuII modified CILE. The results of voltammetric studies showed that the fabricated sensor has excellent advantages such as higher sensitivity and selectivity, wider linear ranges, simpler electrode fabrication process and stability. In addition, it can be applied to the sensitive detection of DXM in real samples as it has been shown.2. Experimental
All experiments were carried out in accordance with the World Medical Association's “Ethical principles for medical research involving human subjects”, and approved by the medical ethics committee at Kermanshah University of Medical Sciences. There is no experimentation with human subjects in this study.2.1. Apparatus and chemicals
Electrochemical measurements were carried out with a potentiostat–galvanostat Autolab equipped with a three-electrode cell containing a saturated Ag/AgCl as a reference electrode and a platinum electrode as an auxiliary electrode. CILE modified with Fe3O4/PANI–CuII microspheres was applied as working electrode. The system was run on a PC by NOVA and FRA 1.11 software. A Metrohm 710 pH meter was used for pH adjustment. The synthesized Fe3O4/PANI–CuII microspheres was characterized by power X-ray diffraction (XRD) was performed on a Bruker D8-advance X-ray diffractometer with Cu Kα (k = 0.154 nm) radiation and thermo gravimetric analysis (TGA) was performed using a Shimadzu thermo gravimetric analyzer (TG-50). TEM analysis was carried out using TEM microscope (Philips CM30). FT-IR spectra were recorded on a Shimadzu Fourier Transform Infrared Spectrophotometer (FT-IR-8300). The morphology of the products was determined by using Hitachi Japan, model s4160 Scanning Electron Microscopy (SEM) at accelerating voltage of 15 kV. This system was equipped with a concentric hemispherical (CHA) electron energy analyzer (Specs model EA10 plus) suitable for X-ray photoelectron spectroscopy (XPS). The Cu loading amount was determined by OPTIMA 7300 DV ICP analyzer.Chemicals were purchased from Merck and Fluka Chemical Company. DXM powder (pure) was provided from Aldrich chemicals (Milwaukee, USA). All the reagents used were of analytical grade and double distilled water was used throughout the experiments. Daily-based fresh frozen blood serum samples were prepared from the venous blood of random healthy male and female blood donors, obtained from Imam Reza Hospital (Kermanshah, Iran). Urine sample obtained from healthy individuals were stored frozen until assay.
2.2. Synthesis of Fe3O4 microspheres
Magnetite particles were synthesized by using a solvothermal method.25 FeCl3·6H2O (1.4 g, 5 mmol) was dissolved in ethylene glycol (EG) (40 mL) to form a clear solution, followed by the addition of sodium acetate (NaAc) (3.6 g). The mixture was stirred vigorously for 15 min, and then was sealed in a Teflon-lined stainless-steel autoclave. The autoclave was heated to 200 °C and maintained at this temperature for 5 h, and then was cooled to room temperature (RT). The resulting black product was washed with ethanol and deionized water several times, and was finally dried.2.3. Synthesis of Fe3O4/PANI composite microspheres
The Fe3O4/PANI microspheres was prepared by in situ chemical oxidative polymerization of aniline in the presence of Fe3O4 microspheres. In this method, 0.3 mL HCl (0.1 M) was dissolved in 10 mL of deionized water. Then, the Fe3O4 (0.25 g) microspheres and 0.2 mL aniline monomer were added to the above reaction mixture and stirred at room temperature. Five milliliters of aqueous APS (2.2 mmol) was added dropwise to the solution of PANI/HCl complex containing Fe3O4 microspheres under ultrasonic irradiation and the reaction was allowed to proceed for 3 h at RT. The resultant product was washed with deionized water, methanol and ether three times, respectively, and then dried in vacuum for 12 h to obtain green-black powder of Fe3O4/PANI microspheres.262.4. Loading of Cu on Fe3O4/PANI (Fe3O4/PANI–CuII)
The as-synthesised Fe3O4/PANI microspheres (100 mg) were first dispersed in ethanol solution (50 mL) under ultrasonication for 0.5 h. The formed black suspension was ultrasonically mixed with (30 mL, 0.1 M) of CuCl2 for 1 h. After this, the microspheres were harvested with the aid of a magnet and washed with deionized water three times and dried under vacuum.2.5. Preparation of modified electrode
The traditional carbon paste electrode (CPE) was fabricated by mixing 30.0 w/w% of paraffin oil and 70.0 w/w% of graphite powder. The CILE was fabricated by mixing 20.0 w/w% of paraffin oil, 10.0 w/w% of solid I(EMIMPF6) and 70.0 w/w% of graphite powder. The Fe3O4/PANI–CuII/CILE was fabricated by hand mixing the optimal amounts of graphite powder, paraffin oil solid I(EMIMPF6) and Fe3O4/PANI–CuII (60![[thin space (1/6-em)]](https://www.rsc.org/images/entities/char_2009.gif) :
:![[thin space (1/6-em)]](https://www.rsc.org/images/entities/char_2009.gif) 10
10![[thin space (1/6-em)]](https://www.rsc.org/images/entities/char_2009.gif) :
:![[thin space (1/6-em)]](https://www.rsc.org/images/entities/char_2009.gif) 15
15![[thin space (1/6-em)]](https://www.rsc.org/images/entities/char_2009.gif) :
:![[thin space (1/6-em)]](https://www.rsc.org/images/entities/char_2009.gif) 15% w/w). Other modified electrodes were prepared using a similar procedure for comparison. Each paste was packed firmly into pipette tube in which electrical contact was made with a copper wire that runs through the center of the electrode body. Prior to experiment, the surface of each the prepared electrodes polished using a butter paper to produce reproducible working surface and then was used for electrochemical studying of DXM by voltammetric techniques.
15% w/w). Other modified electrodes were prepared using a similar procedure for comparison. Each paste was packed firmly into pipette tube in which electrical contact was made with a copper wire that runs through the center of the electrode body. Prior to experiment, the surface of each the prepared electrodes polished using a butter paper to produce reproducible working surface and then was used for electrochemical studying of DXM by voltammetric techniques.
2.6. Real sample preparation
Human urine and serum samples were taken from healthy donors and used shortly after collection. The urine sample was centrifuged and diluted 10 times without any further pretreatment. The serum sample was treated with 2 mL methanol (as protein precipitating agent). The precipitated proteins were separated out by centrifugation for 3 min at 6000 rpm. The clear supernatant layer was filtered and diluted to a definite volume.3. Results and discussion
3.1. Characterization of the Fe3O4/Cu(II) microspheres
Scanning electron microscope (SEM) images of the resulting Fe3O4 microspheres are shown in (Fig. 1a). As it can be seen, the generated Fe3O4 microspheres have a spherical shape with a rough surface and an average diameter of 145 nm. The Fe3O4/PANI microspheres consisted of aggregates of small magnetite particles with sizes from 15 to 20 nm as calculated using transmission electron microscopy (TEM) (Fig. 1b). A continuous layer of PANI could be observed on the outer shell of the Fe3O4 microsphere cores. The average thickness of the PANI shell was 25 nm. From the TEM image of Fe3O4/PANI–CuII (Fig. 1c), it could be seen that the morphology of Fe3O4/PANI–CuII almost remained the same after loading CuCl2 on Fe3O4/PANI microspheres. | ||
| Fig. 1 (a) SEM images of Fe3O4 microspheres; (b) TEM images of Fe3O4/PANI microspheres; (c) TEM images of Fe3O4/PANI–CuII microspheres. | ||
The structures of the (a) Fe3O4 microspheres, (b) Fe3O4/PANI microspheres, and (c) Fe3O4/PANI–CuII microspheres were analyzed using FT-IR spectroscopy, as shown in Fig. 2. In curve (a), the strong absorption peak at 576 cm−1 corresponds to the Fe–O vibrations, the adsorption peaks located at 3384, 1622 and 1406 cm−1 can be attributed to the stretching vibration of –OH, C![[double bond, length as m-dash]](https://www.rsc.org/images/entities/char_e001.gif) O and C–O of carboxyl groups, respectively. As for Fe3O4/PANI microspheres displayed in Fig. 2b the characteristic peaks at 1585 and 1498 (C
O and C–O of carboxyl groups, respectively. As for Fe3O4/PANI microspheres displayed in Fig. 2b the characteristic peaks at 1585 and 1498 (C![[double bond, length as m-dash]](https://www.rsc.org/images/entities/char_e001.gif) N and C
N and C![[double bond, length as m-dash]](https://www.rsc.org/images/entities/char_e001.gif) C stretching vibration of the quinoid and benzenoid ring, respectively), 1304 and 1143 (C–N stretching of the secondary aromatic amine), 1247 (C–N stretching vibration in protonic acid doped PANI), and 829 cm−1 (out of plane deformation of C–H in the 1,4-disubstituted benzene ring) showed that aniline was successfully polymerized onto the Fe3O4 core. In curve (c), the FT-IR spectrum of Fe3O4/PANI–CuII was similar to that of Fe3O4/PANI, but it can be seen the C
C stretching vibration of the quinoid and benzenoid ring, respectively), 1304 and 1143 (C–N stretching of the secondary aromatic amine), 1247 (C–N stretching vibration in protonic acid doped PANI), and 829 cm−1 (out of plane deformation of C–H in the 1,4-disubstituted benzene ring) showed that aniline was successfully polymerized onto the Fe3O4 core. In curve (c), the FT-IR spectrum of Fe3O4/PANI–CuII was similar to that of Fe3O4/PANI, but it can be seen the C![[double bond, length as m-dash]](https://www.rsc.org/images/entities/char_e001.gif) C, C–N, C–H stretching vibrations take place blue shift, which exhibited CuCl2 was fastened on the supporter.27
C, C–N, C–H stretching vibrations take place blue shift, which exhibited CuCl2 was fastened on the supporter.27
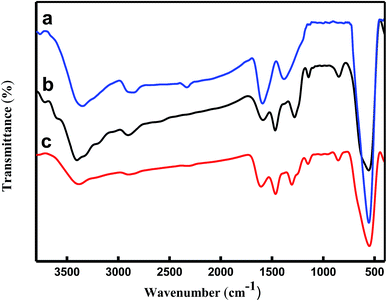 | ||
| Fig. 2 FT-IR spectra of (a) Fe3O4 (b) Fe3O4/PANI microspheres and, (c) Fe3O4/PANI–CuII microspheres. | ||
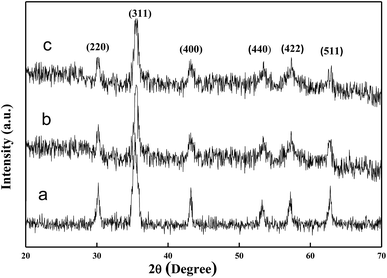
Fig. 3 shows the XRD patterns of the samples. The diffraction peaks marked in Fig. 3a can be indexed to (111), (220), (311), (400), (422), (511), (440), and (533) planes of face-centered cubic Fe3O4. For the XRD spectrum of the Fe3O4/PANI microspheres (Fig. 3b), the main peaks are similar to the pristine Fe3O4 microspheres (Fig. 3a), which reveals that the crystalline phase of Fe3O4 is well-maintained after the coating process under acidic conditions. Compared with that for bare Fe3O4 (Fig. 3a), the slight decrease in peak intensity for the Fe3O4/PANI is due to the amorphous polymer coating. The main peaks of the Fe3O4/PANI–CuII microspheres were similar to Fe3O4/PANI, which revealed that immobilizing CuCl2 on the surface of Fe3O4/PANI did not affect the structure of Fe3O4/PANI.
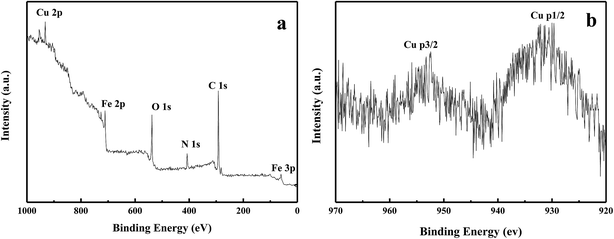
The copper content in Fe3O4/PANI–CuII microspheres was determined by means of ICP-AES and amounted to 4.2 wt%. The X-ray photoelectron spectroscopy (XPS) elemental survey scans of the surface of Fe3O4/PANI–CuII microspheres are shown in Fig. 4. Peaks corresponding to oxygen, carbon, nitrogen, copper and iron were clearly observed (Fig. 4a). To determine the oxidation state of Cu, the XPS experiments were carried out and results are reported in Fig. 4b. As it can be observed, in Fig. 3b the Cu binding energy of Fe3O4/PANI–CuII exhibited two strong peaks located at 932.8 and 952.5 eV, which were assigned to Cu 3d3/2 and Cu 3d5/2, respectively. These values suggests that the oxidation state of copper in the Fe3O4/PANI–CuII microspheres is +2.28
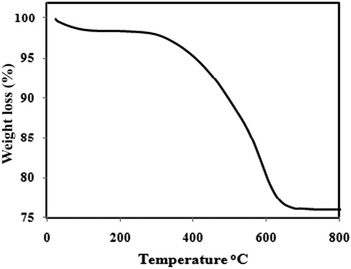
Fig. 5 illustrates the results of the thermogravimetric analysis of the Fe3O4@PANI composite, for which the thermal degradation of the PANI occurs at 450 °C.29 The initial mass loss at lower temperatures is mainly due to the release of water and solvent molecules in the polymer matrix. The major weight loss is observed at 290 °C and continues to 630 °C, possibly due to a large scale thermal degradation of the PANI chains. From the TG analysis, the mass ratio of the PANI in the magnetic core/shell composite is about 21%.
3.2. Characterization of the modified electrode
Surface morphologies of CPE, CILE and Fe3O4/PANI–CuII/CILE were investigated by SEM, respectively (Fig. 6). The surface of the CPE (Fig. 6a) showed a homogeneous surface and the SEM image of CILE (Fig. 6b) shown an smooth surface appeared without separated carbon layer, which was due to the embedment of ionic liquids EMIMPF6 between the layer of carbon and disperse the carbon powder homogeneously. When Fe3O4/PANI–CuII microspheres were introduced into the paste (Fig. 6c), the uniformity of the surface was remained almost unchanged while the surface roughness seemed to be increased by appearing uniform layer of Fe3O4/PANI–CuII microspheres on the surface which fairly distributed in paste.Electrochemical impedance spectroscopy (EIS) is an efficient analytical method to monitor the modification procedure of the electrode surface. The semicircle diameter of the Nyquist plots at high frequency is corresponding to the charge-transfer limited process and can be used to describe the interface properties of the electrode. The Nyquist plots of different electrodes including bare CPE, CILE, Fe3O4/CILE, Fe3O4/PANI/CILE, and Fe3O4/PANI–CuII/CILE in 1.0 mM [Fe(CN)6]3−/4− solution containing 0.1 M KCl are given in Fig. 7. The smaller semicircle portion at higher frequencies of CILE than the bare CPE indicates that ionic liquids can improve the electron transfer rate. The reason might be attributed to the excellent electrical conductivity of ionic liquids EMIMPF6. Fe3O4/CILE shows a small semicircle at the high frequency region when compared with the CILE, this can be attributed to the presented Fe3O4 with good conductivity and large surface area in the modified electrode, which could effectively increase the rate electron transfer between electrode surface and [Fe(CN)6]3−/4− and decrease interface electron transfer resistance. After modifying of the Fe3O4 microsphere with PANI, the semicircle portion at higher frequencies decreased visibly. It is due to good electrical conductivity of the PANI polymer. Finally, the semicircle portion at higher frequencies of Fe3O4/PANI–CuII/CILE smaller than the Fe3O4/PANI/CILE which may be due to presence of copper ions in Fe3O4/PANI–CuII. It can facilitate the electron transfer.
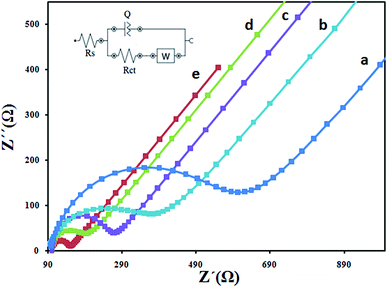 | ||
| Fig. 7 EIS for (a) CPE, (b) CILE (c) Fe3O4/CILE (d) Fe3O4/PANI/CILE/and Fe3O4/PANI–CuII/CILE (e) in 1 mM [Fe(CN)6]3−/4− with 0.1 M KCl. | ||
3.3. Determination of surface area
The active surface area of the modified electrode was estimated, using the [Fe(CN)6]3−/4− redox system and applying the Randles–Sevcik equation for a reversible process.30 For a typical reversible process, the following formula is can be employed:| Ip = (2.69 × 10⁵)An3/2D1/2C0ν1/2 |
3.4. Electrochemical behavior of DXM at Fe3O4/PANI–CuII/CILE
The electrochemical study of different modified electrodes was performed in 0.1 M KH2PO4 electrolyte containing a 100 μM DXM solution with a cyclic voltammetry technique, and the results are shown in Fig. 8. Due to slow electron transfer, DXM did not show any significant peaks at bare CPE (curve a), while the responses at the CILE were stronger (curves b), compared with the CPE and CILE, the enhancement in peaks current peaks current at the surface of CILE/Fe3O4 (curves c), this is confirms the synergetic effect of the Fe3O4 microspheres on the electro-oxidation of DXM. The significant increase in peaks current and shift in peaks potential at the surface of Fe3O4/PANI/CILE in comparison with those obtained CILE/Fe3O4, CILE and CPE is due to the presence of PANI which possesses good electrical conductivity. It also must be noted that the enhancement in the peak currents at the surface of Fe3O4/PANI–CuII/CILE in comparison with other electrodes is due to the presence of copper ions in the composition of the modified electrode. The complex formation between electrode surface copper ions and DXM increases the accumulated drug and an enhancement in the peak current and sensitivity of the proposed electrode towards DXM is resulted.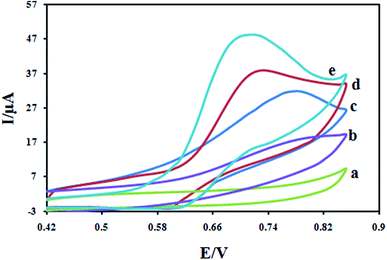 | ||
| Fig. 8 Cyclic voltammograms for 100 μM DXM at scan rate 100 mV s−1 at CPE (a); CILE (b); Fe3O4/CILE (c); Fe3O4/PANI/CILE (d) and Fe3O4/PANI–CuII/CILE (e) in 0.1 M KH2PO4 electrolyte. | ||
3.5. Optimization of the amount of modifier in the electrode
The effect of the amount of Fe3O4/PANI–CuII on the Fe3O4/PANI–CuII/CILE performance toward electrooxidation of DXM was examined by DPV. It was observed that the sensitivity of the sensor first rapidly increases with increasing the Fe3O4/PANI–CuII nanoparticles content in the paste up to about 15% and then started to level off and even slowly decreases with the higher loadings. Initially, the maximum peak current was obtained when the amounts of the graphite powder, paraffin oil, ion liquid EMIMPF6 and Fe3O4/PANI–CuII in the paste were 60![[thin space (1/6-em)]](https://www.rsc.org/images/entities/char_2009.gif) :
:![[thin space (1/6-em)]](https://www.rsc.org/images/entities/char_2009.gif) 10
10![[thin space (1/6-em)]](https://www.rsc.org/images/entities/char_2009.gif) :
:![[thin space (1/6-em)]](https://www.rsc.org/images/entities/char_2009.gif) 15
15![[thin space (1/6-em)]](https://www.rsc.org/images/entities/char_2009.gif) :
:![[thin space (1/6-em)]](https://www.rsc.org/images/entities/char_2009.gif) 15% (w/w).
15% (w/w).
3.6. Investigation of the scan rate
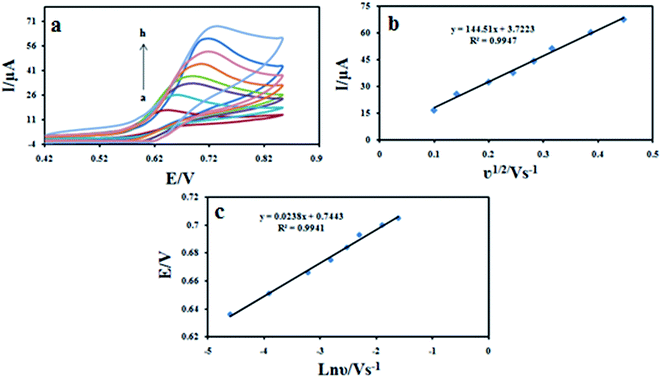
Effect of the scan rate on the cyclic voltammograms of 100 μM DXM at different scan rates were shown in Fig. 9a. The results showed that the peak currents vary linearly with the square root of the scan rate (ν1/2) (Fig. 9b), which indicates a diffusion-controlled process for DXM oxidation on the surface of the modified electrode in the studied range of potential sweep rates, with following equations: Ipa = 144.51ν1/2 + 3.7233 (R2 = 0.9947). The dependence of the peak potential and the logarithmic scan rate (ln![[thin space (1/6-em)]](https://www.rsc.org/images/entities/char_2009.gif) ν) showed a linear relationship with a regression equation of Epa (V) = 0.0238
ν) showed a linear relationship with a regression equation of Epa (V) = 0.0238![[thin space (1/6-em)]](https://www.rsc.org/images/entities/char_2009.gif) ln
ln![[thin space (1/6-em)]](https://www.rsc.org/images/entities/char_2009.gif) ν (V s−1) + 0.7443 (R2 = 0.9941) (Fig. 9c). For an irreversible electrode process, according to Laviron equation,31 Epa is defined by the following equation:
ν (V s−1) + 0.7443 (R2 = 0.9941) (Fig. 9c). For an irreversible electrode process, according to Laviron equation,31 Epa is defined by the following equation:Ep = E0 + RT/(1 − α)nF![[thin space (1/6-em)]](https://www.rsc.org/images/entities/char_2009.gif) ln((1 − α)nF/RTks) + (RT/(1 − α)nF)ln ln((1 − α)nF/RTks) + (RT/(1 − α)nF)ln![[thin space (1/6-em)]](https://www.rsc.org/images/entities/char_2009.gif) ν ν |
![[thin space (1/6-em)]](https://www.rsc.org/images/entities/char_2009.gif) 485 C mol−1 and R = 8.314 J mol−1 K−1, the (1 − α)n was calculated to be 1.07. According to Bard and Faulkner.32 α can be calculated using the following equation: α can be given as: α = 47.7/(Ep − Ep/2) mV where Ep/2 is the potential where the current is at half the peak value. Thus, from this, the transfer coefficient (α) and the electron transfer number (n) are calculated to be 0.54 and 1.92 ≈ 2, respectively. Also, if the value of E0 is known, the ks value can be determined from the intercept of the straight line of Ep vs. ln
485 C mol−1 and R = 8.314 J mol−1 K−1, the (1 − α)n was calculated to be 1.07. According to Bard and Faulkner.32 α can be calculated using the following equation: α can be given as: α = 47.7/(Ep − Ep/2) mV where Ep/2 is the potential where the current is at half the peak value. Thus, from this, the transfer coefficient (α) and the electron transfer number (n) are calculated to be 0.54 and 1.92 ≈ 2, respectively. Also, if the value of E0 is known, the ks value can be determined from the intercept of the straight line of Ep vs. ln![[thin space (1/6-em)]](https://www.rsc.org/images/entities/char_2009.gif) ν. The E0 value can be deduced from the intercept of Ep vs. ν plot by extrapolating the line to the vertical axis at ν = 0, when ν was approached to zero, then Ep was approached to E0.33 Thus, using this information and Laviron equation the ks values obtained was 2.90 s−1.
ν. The E0 value can be deduced from the intercept of Ep vs. ν plot by extrapolating the line to the vertical axis at ν = 0, when ν was approached to zero, then Ep was approached to E0.33 Thus, using this information and Laviron equation the ks values obtained was 2.90 s−1.
3.7. Effect of pH
The effect of pH of the buffer solution on the electrochemical behavior of DXM was studied by cyclic voltammetry using 0.1 M KH2PO4 electrolyte in the pH range of 1.0–9.0 (Fig. 10a). The pH of the KH2PO4 electrolyte solution was regulated by small amounts of NaOH and HCl solutions. As it can be seen, no voltammetric peak of DXM was observed at pH 5 and higher. On the other hand, the anodic peak current in the range of 1.0 to 5.0 increased with the decrease of pH, when the pH was less than 2.0, the oxidation current did not increase. Therefore, pH 2.0 was selected in the assay. In addition, the oxidation peak potential shifts negatively with increase in pH, suggesting that protons participate in the electrode reaction process. The relationship between the peak potential (Epa) and pH is expressed as: Epa (V) = 0.0521pH + 0.7953 (R2 = 0.9963) (Fig. 10b). The absolute value of the slope (0.0521 V pH−1) is close to the theoretical Nernstian value of 0.0586 V pH−1, indicating that electron transfer was accompanied by an equal number of protons in electrode reaction of DXM.34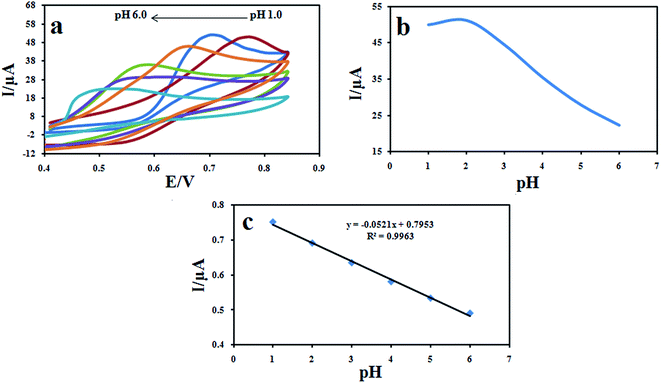 | ||
| Fig. 10 Cyclic voltammograms of 100 μM DXM recorded (a) from pH 1.0 to 6.0 at a scan rate of 100 mV s−1 (b) effect of pH of DXM solutions on the peak current (b) and (c) peak potential. | ||
3.8. Calibration curve and detection limit
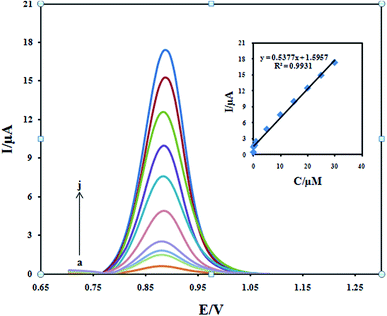
The differential pulse voltammetry was used for the determination of DXM because of its higher sensitivity and selectivity than CV. Under the optimal experimental conditions, the oxidation peak current of DXM was proportional to its concentration in the range from 0.05 to 30.0 μM (Fig. 11). The linear regression equation can be expressed as Ipa (μA) = 0.5377 + 1.5957 (mA) (R2 = 0.9931). Based on the relation 3 (S/N), the detection limit was 3.0 nM. Compared with other electrochemical sensors (Table 1), the proposed methods in our work gave higher sensitivities with wider linear ranges for DXM detection.3.9. Chronoamperometric measurements
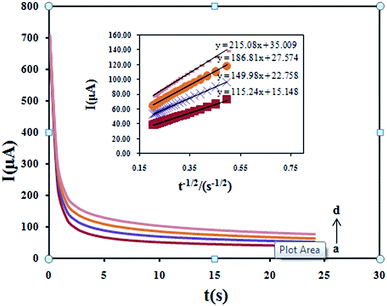
The chronoamperometry as well as other electrochemical methods was employed for the investigation of electrode reaction at chemically modified electrodes. Chronoamperometric measurements of DXM at Fe3O4/PANI–CuII/CILE were done (Fig. 12) for various concentrations of DXM. For an electroactive material (DXM in this case) with a diffusion coefficient of D, the current for the electrochemical reaction at a mass transport limited rate is described by the Cottrell equation:| I = nFAD1/2Cbπ−1/2t−1/2 |
Under diffusion control, a plot of I versus t−1/2 will be linear, and from the slope the value of D can be obtained. The mean value of the D was found to be 5.15 × 10⁻⁴ cm2 s−1.
3.10. Interference, stability and reproducibility
In order to evaluate the ability of anti-interference, some ordinary compounds in biological media and drugs were selected. No significant interference was found for the detection of 50 μM DXM from the following compounds: NaCl, KCl, KNO3, tryptophan, cysteine, uric acid, ascorbic acid, hydrocortisone, and phenazopyridine. The stability of the sensor was also investigated by examining its response current after storage period of 30 days the current of DXM reduced 4.9%, indicating the excellent stability, after a storage period of 30 days. The reproducibility of the proposed sensor was tested using five different electrodes. The relative standard deviations (RSD) of the DPV response currents for these species were less than 6.8%. Thus, the modified electrode showed a high stability and excellent reproducibility and anti-interference ability.3.11. Real sample analysis
The applicability of the proposed method was examined to determine DXM in the pharmaceutical samples using the calibration curve method. The sample treatment processes were described in the Experimental section. The obtained results are summarized in Table 2. As it is obvious, the recovery of DXM was found to be between 97.0–102.0% using DPV method, which confirm good sensitivity of the proposed procedure. This means that the proposed procedure should be applicable to the analysis of real samples with different matrices.| Added (μM) | Found (μM) | Recovery (%) | |
|---|---|---|---|
| Blood serum samples | 0 | Not detected | — |
| 1 | 1.05 | 105 | |
| 3 | 3.15 | 105 | |
| 5 | 4.9 | 99.8 | |
| Urine | 0 | Not detected | — |
| 1 | 0.96 | 0.96 | |
| 3 | 3.03 | 101 | |
| 5 | 5.25 | 105 |
The R.S.D. value for determination was less than 3.7% for n = 3.
4. Conclusions
In the present study an efficient and sensitive catalytic system based on a Fe3O4/PANI–CuII/CILE was introduced for nanomolar detection of DXM using DPV method. The results showed good stability as well as high electrocatalytic activity toward DXM. In comparison to other reported electrodes the proposed sensor has an acceptable limit of detection and linear range and can be used for monitoring of the drug in real samples with different matrices. In addition to its low detection limit, wide linear range, low cost, reasonable reproducibility and stability are the other advantages of this sensor.References
- R. B. Friedrich, A. Ravanello, L. C. Cichota, C. M. B. Rolim and R. C. R. Beck, Validation of a simple and rapid UV spectrophotometric method for dexamethasone assay in tablets, Quim. Nova, 2009, 32(4), 1052–1054 CrossRef.
- M. M. Vdovenko, A. V. Gribas, A. V. Vylegzhanina and I. Y. Sakharov, Development of a chemiluminescent enzyme immunoassay for the determination of dexamethasone in milk, Anal. Methods, 2012, 4(8), 2550–2554 RSC.
- R. N. Goyal, V. K. Gupta and S. Chatterjee, Fullerene-C60-modified edge plane pyrolytic graphite electrode for the determination of dexamethasone in pharmaceutical formulations and human biological fluids, Biosens. Bioelectron., 2009, 24(6), 1649–1654 CrossRef CAS PubMed.
- K. Wasch, H. Brabander, D. Courtheyn and C. V. Peteghem, Detection of corticosteroids in injection sites and cocktails by MSn, Analyst, 1998, 123, 2415–2422 RSC.
- H. Shibasaki, T. Furuta and Y. Kasuya, Quantification of corticosteroids in human plasma by liquid chromatography-thermospray mass spectrometry using stable isotope dilution, J. Chromatogr. B: Biomed. Sci. Appl., 1997, 692(1), 7–14 CrossRef CAS.
- C. S. Creaser, S. J. Feely, E. Houghton and M. Seymour, Immunoaffinity chromatography combined on-line with high-performance liquid chromatography–mass spectrometry for the determination of corticosteroids, J. Chromatogr. A, 1998, 794(1), 37–43 CrossRef CAS PubMed.
- M. Cherlet, S. De Baere and P. De Backer, Quantitative determination of dexamethasone in bovine milk by liquid chromatography-atmospheric pressure chemical ionization-tandem mass spectrometry, J. Chromatogr. B: Anal. Technol. Biomed. Life Sci., 2004, 805(1), 57–65 CrossRef CAS PubMed.
- O. H. Hidalgo, M. J. Lopez, E. A. Carazo, M. S. A. Larrea and T. B. Reuvers, Determination of dexamethasone in urine by gas chromatography with negative chemical ionization mass spectrometry, J. Chromatogr. B: Anal. Technol. Biomed. Life Sci., 2003, 788(1), 137–146 CrossRef CAS.
- Y. Iglesias, C. Fente, S. Mayo, B. Vazquez, C. Franco and A. Cepeda, Chemiluminescence detection of nine corticosteroids in liver, Analyst, 2000, 125(11), 2071–2074 RSC.
- Y. Iglesias, C. Fente, B. Vazquez, C. Franco, A. Cepeda and S. Mayo, Application of the luminol chemiluminescence reaction for the determination of nine corticosteroids, Anal. Chim. Acta, 2002, 468(1), 43–52 CrossRef CAS.
- O. Huetos, M. Ramos, M. M. de Pozuelo, T. B. Reuvers and M. San Andrés, Determination of dexamethasone in feed by TLC and HPLC, Analyst, 1999, 124(11), 1583–1587 RSC.
- B. Rezaei, S. Zare and A. A. Ensafi, Square wave voltammetric determination of Dexamethasone on a multiwalled carbon nanotube modified pencil electrode, J. Braz. Chem. Soc., 2011, 22(5), 897–904 CrossRef CAS.
- K. Balaji, G. R. Reddy, T. M. Reddy and S. J. Reddy, Determination of prednisolone, dexamethasone and hydrocortisone in pharmaceutical formulations and biological fluid samples by voltammetric techniques using b-cyclodextrin modified carbon paste electrode, Afr. J. Pharm. Pharmacol., 2008, 2(8), 157–166 Search PubMed.
- T. M. B. Oliveira, F. W. P. Ribeiro, J. E. Soares, P. de Lima-Neto and A. N. Correia, Square-wave adsorptive voltammetry of dexamethasone: redox mechanism, kinetic properties, and electroanalytical determinations in multicomponent formulations, Anal. Biochem., 2011, 413(2), 148–156 CrossRef CAS PubMed.
- A. Safavi, N. Maleki, O. Moradlou and F. Tajabadi, Simultaneous determination of dopamine, ascorbic acid, and uric acid using carbon ionic liquid electrode, Anal. Biochem., 2006, 359(2), 224–229 CrossRef CAS PubMed.
- A. Safavi, N. Maleki, E. Farjami and F. A. Mahyari, Simultaneous electrochemical determination of glutathione and glutathione disulfide at a nanoscale copper hydroxide composite carbon ionic liquid electrode, Anal. Chem., 2009, 81(18), 7538–7543 CrossRef CAS PubMed.
- M. Opallo and A. Lesniewski, A review on electrodes modified with ionic liquids, J. Electroanal. Chem., 2011, 656(1), 2–16 CrossRef CAS.
- L. Ding and B. Su, A non-enzymatic hydrogen peroxide sensor based on platinum nanoparticle–polyaniline nanocomposites hosted in mesoporous silica film, J. Electroanal. Chem., 2015, 736, 83–87 CrossRef CAS.
- A. K. Das, S. Maiti and B. Khatua, High performance electrode material prepared through in situ polymerization of aniline in the presence of zinc acetate and graphene nanoplatelets for supercapacitor application, J. Electroanal. Chem., 2015, 739, 10–19 CrossRef CAS.
- B. H. Nguyen, L. Dai Tran, Q. P. Do, H. Le Nguyen, N. H. Tran and P. X. Nguyen, Label-free detection of aflatoxin M1 with electrochemical Fe3O4/polyaniline-based aptasensor, Mater. Sci. Eng., C, 2013, 33(4), 2229–2234 CrossRef CAS PubMed.
- J. Jiang, H. Gu, H. Shao, E. Devlin, G. C. Papaefthymiou and J. Y. Ying, Bifunctional Fe3O4–Ag Heterodimer Nanoparticles for Two-Photon Fluorescence Imaging and Magnetic Manipulation, Adv. Mater., 2008, 20(23), 4403–4407 CrossRef CAS.
- F.-h. Lin, W. Chen, Y.-H. Liao, R.-a. Doong and Y. Li, Effective approach for the synthesis of monodisperse magnetic nanocrystals and M–Fe3O4 (M = Ag, Au, Pt, Pd) heterostructures, Nano Res., 2011, 4(12), 1223–1232 CrossRef CAS.
- C.-M. Yu, J.-W. Guo and H.-Y. Gu, Direct electrochemical behavior of hemoglobin at surface of Au@Fe3O4 magnetic nanoparticles, Microchim. Acta, 2009, 166(3–4), 215–220 CrossRef CAS.
- L. Pan, Y. Chen and F. Wang, Synthesis of nanostructured M/Fe3O4 (M = Ag, Cu) composites using hexamethylenetetramine and their electrocatalytic properties, Mater. Chem. Phys., 2012, 134(1), 177–182 CrossRef CAS.
- Q. Xiong, J. Tu, Y. Lu, J. Chen, Y. Yu and Y. Qiao, et al., Synthesis of hierarchical hollow-structured single-crystalline magnetite (Fe3O4) microspheres: the highly powerful storage versus lithium as an anode for lithium ion batteries, J. Phys. Chem. C, 2012, 116(10), 6495–6502 CAS.
- A. Mehdinia, F. Roohi and A. Jabbari, Rapid magnetic solid phase extraction with in situ derivatization of methylmercury in seawater by Fe3O4/polyaniline nanoparticle, J. Chromatogr. A, 2011, 1218(28), 4269–4274 CrossRef CAS PubMed.
- Y. Lu, Y. Yin, B. T. Mayers and Y. Xia, Modifying the surface properties of superparamagnetic iron oxide nanoparticles through a sol–gel approach, Nano Lett., 2002, 2(3), 183–186 CrossRef CAS.
- U. G. Singh, R. T. Williams, K. R. Hallam and G. C. Allen, Exploring the distribution of copper–Schiff base complex covalently anchored onto the surface of mesoporous MCM 41 silica, J. Solid State Chem., 2005, 178(11), 3405–3413 CrossRef CAS.
- S. Xuan, Y.-X. J. Wang, K. C.-F. Leung and K. Shu, Synthesis of Fe3O4@polyaniline core/shell microspheres with well-defined blackberry-like morphology, J. Phys. Chem. C, 2008, 112(48), 18804–18809 CAS.
- N. Yang, Q. Wan and J. Yu, Adsorptive voltammetry of Hg(II) ions at a glassy carbon electrode coated with electropolymerized methyl-red film, Sens. Actuators, B, 2005, 110(2), 246–251 CrossRef CAS.
- J. Abbar and S. Nandibewoor, Voltammetric Behavior of Chlorzoxazone and Its Electroanalytical Determination in Pharmaceutical Dosage Form and Urine at Gold Electrode, Crit. Rev. Anal. Chem., 2012, 42(3), 272–281 CrossRef CAS.
- A. J. Bard, L. R. Faulkner, J. Leddy and C. G. Zoski. Electrochemical methods: fundamentals and applications, Wiley, New York, 1980 Search PubMed.
- Y. Wu, X. Ji and S. Hu, Studies on electrochemical oxidation of azithromycin and its interaction with bovine serum albumin, Bioelectrochemistry, 2004, 64(1), 91–97 CrossRef CAS PubMed.
- T. Łuczak, Preparation and characterization of the dopamine film electrochemically deposited on a gold template and its applications for dopamine sensing in aqueous solution, Electrochim. Acta, 2008, 53(19), 5725–5731 CrossRef.
- C. Jeyaseelan and A. Joshi, Trace determination of dexamethasone sodium phosphate in pharmaceutical formulations by differential pulse polarography, Anal. Bioanal. Chem., 2002, 373, 772–776 CrossRef CAS PubMed.
| This journal is © The Royal Society of Chemistry 2017 |

