 Open Access Article
Creative Commons Attribution 3.0 Unported Licence
Spectroscopic markers for uranium(VI) phosphates. Part II: the use of time-resolved photoluminescence
F. Massuyeaua,
D. L. Perryb,
N. Kalashnykc and
E. Faulques*a
aInstitut des Matériaux Jean Rouxel (IMN), Université de Nantes, CNRS, 2 rue de la Houssinière, BP 32229, 44322 Nantes Cedex 3, France. E-mail: eric.faulques@cnrs-imn.fr
bLawrence Berkeley National Laboratory, University of California, Mail Stop 70A-1150, Berkeley, CA 94720, USA
cInstitut Jean Lamour (IJL), Université de Lorraine, CNRS, UMR 7198, Parc de Saurupt, CS 50840, 54011 Nancy, France
First published on 4th January 2017
Abstract
Detection of uranium hydrates that are relevant for environmental sustainability and adsorption at surfaces is effected using time-resolved photoluminescence spectroscopy (TRPL) with simultaneous lifetime and spectral acquisitions. The study is the second paper devoted to this topic (part I: Faulques et al. RSC Adv., 2015, 5, 71219) and focuses on photoluminescence (PL) phenomena. When a temporal dimension is added, the TRPL technique surpasses, via PL decay analysis, steady-state approaches for discriminating minerals with very similar optical and PL spectra. Further, estimates of quantum yields and nonradiative lifetimes can be given. The results are pertinent in the context of remote sensing of parent hazardous uranyl compounds in the environment.
1 Introduction
The study of uranium in natural systems has drawn much attention, primarily due to its strong significance to geological and oceanographic chemistry as well as for environmental sustainability. This element is naturally radioactive and highly toxic. Uranium phase recognition becomes, therefore, extremely challenging for potential environmental risks and investigations of uranium(VI) mobility that depends on its adsorption at surfaces. The detection of uranium in soils, waters, and living bodies can be performed directly by different optical spectroscopy techniques, including, in particular, luminescence spectroscopy.The first studies probing uranyl luminescence date back more than a century ago when earlier optical experiments were intimately associated with the discovery of radioactivity. Later, it has been established that this luminescence is very sensitive to the coordination chemistry of the uranyl ion.1–5 The main historical facts of uranyl luminescence research have been summarized by Formosinho et al.6 while the electronic and vibrational properties of actinyl ions (including uranyl) were thoroughly reviewed by Denning.7
Steady-state photoluminescence (PL) of natural and synthetic uranyl phosphates and carbonates is well documented for solids and solutions in a number of studies.8–17
Various investigations of uranyl ion luminescence quenching by water and time-resolved photoluminescence spectroscopy (TRPL) experiments on uranyl crystals and phosphates in solid state or in solutions have been previously published.10,13,18–31 The advantages of the TRPL technique over stationary photoluminescence are the following: an intense laser beam with a focused spot impinges onto the sample, allowing the detection of very weak PL signals on low material amounts; PL spectra can be recorded not only in the energy domain but also in the time domain, therefore, permitting physical analysis of PL mechanisms. In particular, PL lifetimes are sensitive to structural and environmental changes of the emitting species, to carrier trapping, and to dynamical processes like carrier/exciton recombination or diffusion. This technique permits also the estimation of deactivation rate constants in the excited state.
The minerals investigated in the present work are several uranyl hydrated phosphates, including alkaline earth uranyl phosphates: saleeite Mg(UO2)2(PO4)2·10H2O, metatorbernite Cu(UO2)2(PO4)2·8H2O, uranocircite Ba(UO2)2(PO4)2·10H2O, ulrichite CaCu(UO2) (PO4)2·4H2O, and phosphuranylite KCa(H3O)3(UO2)7(PO4)4O4·8H2O. These minerals consist of a coordination core of hexavalent uranium surrounded by water molecules and the oxygen atoms both donated by the anionic phosphate functional group and those associated with the uranium. Their corresponding detailed crystal structures can be found in the literature.32–36
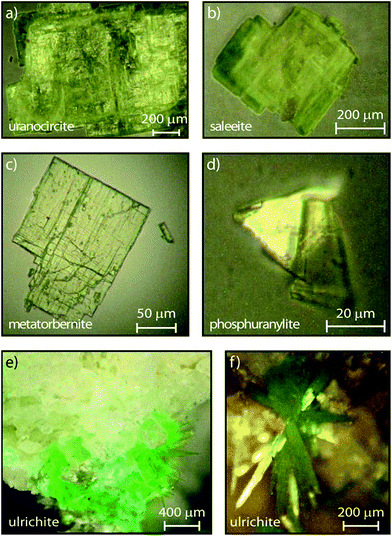 | ||
| Fig. 1 Microphotographs of crystallites investigated in this study and in:17 (a) uranocircite, (b) saleeite, (c) metatorbernite, (d) phosphuranylite, (e) ulrichite spot on rock at low magnification, (f) ulrichite at higher magnification showing the radiating crystals (∼400 μm × 40 μm). | ||
The aim of the present work is to revisit previously published data on these minerals, and to provide a new record on the detection of uranyl moieties following a recent study by the same authors using steady-state PL, optical absorption, Raman and infrared spectroscopy.17 Here, simultaneous temporal and spectral data acquisition is performed with a yet unemployed TRPL technique based on multichannel detection provided by streak camera equipment. In short, this method allows simultaneous recording of many PL transients at the same span of time, the number of time channels being equal to the number of pixels in the vertical direction of the CCD employed for the signal detection.
Luminescence quantum yields and lifetimes, mostly unknown before, are now estimated via the decay analysis of the minerals. Several of these hydrated compounds exhibit quenching of luminescence explained in terms of the crystalline environment of the materials. These findings might have importance not only for fundamental studies but also for the field of uranium environmental research and tracking. The latter aspect is motivated by early recognition of TRPL as a potential remote-sensing technique for selective uranium detection in uranyl geological targets.37
2 Experimental
2.1 Instrumentation
TRPL experiments were carried out with a regenerative amplified femtosecond Ti:Sapphire laser system (Spectra Physics Hurricane X) producing 100 fs pulses at 800 nm with a repetitive rate of 1 kHz. The laser line is frequency doubled in a second harmonic generator to give the excitation wavelength λexc = 400 nm (3.1 eV). The femtosecond laser pulse traces were controlled by an oscilloscope WavePro 950 Lecroy operating with an analog bandwidth of 1 GHz. The emission spectra were temporarily resolved using a high dynamic range Hamamatsu C7700 streak camera of temporal resolution <20 ps equipped with (i) a 7 mm × 17 mm S20 photocathode designed for detecting signals between 200 and 850 nm; (ii) an image intensifier of 25 mm diameter with a P43 phosphor screen and a removable fiber coupling entrance on the streak tube; (iii) an achromatic entrance optical lens with f/3.5 aperture with adjustable focus; (iv) an exit optical lens at magnification 2![[thin space (1/6-em)]](https://www.rsc.org/images/entities/char_2009.gif) :
:![[thin space (1/6-em)]](https://www.rsc.org/images/entities/char_2009.gif) 1 and f/2.5 with adjustable focus; (v) a readout CCD ORCAII camera Peltier cooled to −60 °C with a 1344 × 1024 pixels resolution, 12 bit sampling and pixel size 6.45 × 6.45 μm. The 1344 and 1024 pixels record the spectrum and the sweep time, respectively. The laser beam is filtered in a Pellin–Broca prism and sent through density filters. It is focused onto the sample by a UV grade fused silica bi-convex lens. The excitation density in the sample was adjusted with density filters to avoid sample photodegradation. The fluorescence was collected by a spherical mirror (UV enhanced aluminum, diameter 76.2 mm, focal length 152.4 mm, aperture f/2), and focused onto the spectrograph slit by a second planar UV enhanced and protected aluminum mirror. EKSPLA or Newport bandpass colored glass filters were placed in front of the spectrograph entrance to remove the reflected laser beam.
1 and f/2.5 with adjustable focus; (v) a readout CCD ORCAII camera Peltier cooled to −60 °C with a 1344 × 1024 pixels resolution, 12 bit sampling and pixel size 6.45 × 6.45 μm. The 1344 and 1024 pixels record the spectrum and the sweep time, respectively. The laser beam is filtered in a Pellin–Broca prism and sent through density filters. It is focused onto the sample by a UV grade fused silica bi-convex lens. The excitation density in the sample was adjusted with density filters to avoid sample photodegradation. The fluorescence was collected by a spherical mirror (UV enhanced aluminum, diameter 76.2 mm, focal length 152.4 mm, aperture f/2), and focused onto the spectrograph slit by a second planar UV enhanced and protected aluminum mirror. EKSPLA or Newport bandpass colored glass filters were placed in front of the spectrograph entrance to remove the reflected laser beam.
The transient signals were spectrally dispersed into a Princeton Instruments SP2300 imaging Acton spectrograph specially fitted for the streak camera (focal length 300 mm, aperture ratio f/3.9, gratings with 150 g mm−1, blazed at 500 nm) with a slit opening of 25 μm. The streak camera sweep was triggered by the laser pulses via an internal (0–100 ns) Spectra-Physics synchronous delay generator, (SDG II) and an external delay generator (from 100 ns to 1 ms) Stanford Research Systems plugged onto the laser. The spot size of the laser beam impinging onto samples was about 300 μm, with typical laser powers between 0.9 mW and 44 mW. Transient fluorescence images were acquired with analog integration methods, and no sample degradation was observed.
2.2 Materials and methods
The certified minerals were obtained from Mineralogical Research Company (Minresco, San Jose, CA, USA). Geographical origins of the studied minerals are given in our previous work,17 while the microphotographs of the crystallites are shown in Fig. 1.Experiments were conducted in the solid-state at room temperature (RT). Small crystallites (phosphuranylite, uranocircite), or crystalline platelets (metatorbernite, saleeite), were deposited onto fused silica plates. Alternately, approximately 1 mm3 of tiny acicular ulrichite crystals radiating from the matrix of a rock fragment were studied as provided using a gemological, movable sample holder. The streak camera enables direct lifetime measurements of the transient PL. Streak image backgrounds are removed in all experiments after acquisition. Calibration of the spectrograph was made by recording several intense laser lines at 400 nm along the horizontal direction of the CCD and checking that the position and intensity of this line were unchanged. The temporal and spectral PL profiles were reproduced using appropriate kinetics-decay analysis and Voigt spectral shape modeling, respectively. All spectral fits to the experimental data were performed by minimizing χ2 or maximizing the coefficient of correlation R2 with the free software Fityk 0.9.8 by Marcin Wojdyr under GNU General Public License. The PL spectra were fitted using Voigt functions with a Levenberg–Marquardt iteration algorithm. Time-resolved data were acquired and analyzed with the HPD-TA software provided with the streak camera. For each sweep time, the fluorescence image was averaged by sampling 3 to 10 exposures over different exposure times depending on the CCD signal. The fluorescence dynamics (growth and decay) were subsequently treated with commercial data software and reproduced using the model described in the text. An apparatus function was included in the temporal fits. The fits were applied to the spectra expressed in energy units to reproduce the vibronic spectral components with more accuracy.
3 Results and discussion
The streak camera images consist of three-dimensional (3D) data sets providing the photoluminescence intensity vs. emission wavelength and vs. time delay (ns to μs) after excitation. Therefore, the novelty of the present study in comparison with our previous work17 lies in the PL lifetime study of these uranyl phosphates. The PL images of the samples are recorded in the 344–706 nm spectral range (1.76–3.60 eV) allowed by the grating and covering the full rectangular CCD surface (Fig. 2). Some samples have a globally similar spectral character but clearly present various delayed luminescence appearing in either the 2 ns, 50 ns, 20 μs, 200 μs, or 500 μs time windows.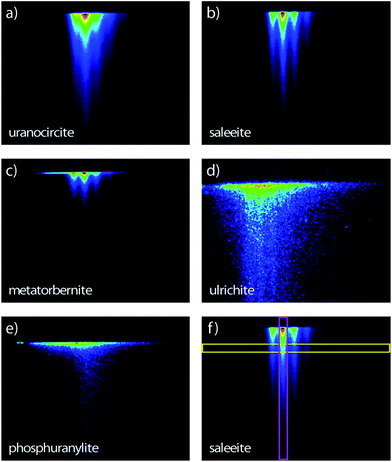 | ||
| Fig. 2 Streak camera images contours of the room temperature time-resolved PL with sweep ranges indicated in parentheses of (a) uranocircite (20 μs), (b) saleeite (500 μs), (c) metatorbernite (200 μs), (d) ulrichite (2 ns) and (e) phosphuranylite (50 ns). The time extends on the vertical direction. (f) Thin vertical (pink) and horizontal (yellow) regions of interest explaining Fig. 5 and 6, respectively. Spectral window: (a–c, e) 366–729 nm; (d) 407–768 nm. Excitation: 400 nm. The PL intensity increases from blue color to red color. | ||
Kinetics were modeled including the temporal dependence of the laser pulse with contribution of a Gaussian apparatus function. The best reproduction of the kinetics was achieved by analytical integration of the following differential equations for exponential decays in a multi-level approach comprising the electronic ground state and one or two independent excited states
 | (1) |
We note that the ni populations include species recombining radiatively and nonradiatively onto the ground state, which is supposed to be negligibly depopulated at RT. In this case, the observed temporal signal (growth and decay) is
 | (2) |
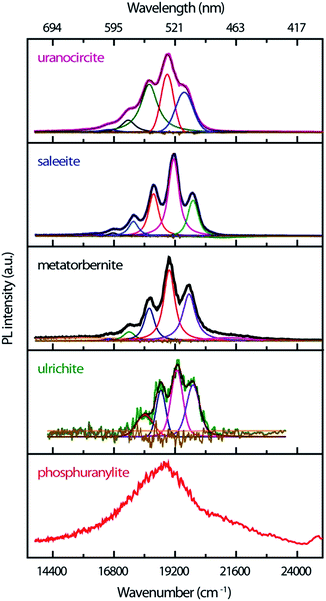
The time-resolved PL of the minerals at RT is made up of intense emissions comparatively close in energy as shown in Fig. 3. The origin of these PL emissions in the green spectrum can be ascribed to electronic transitions between the nonbonding U-5f δu and φu LUMOs and the U(5f)–O(2p) bonding σu HOMO of the uranyl ion.39,40
The PL bands show strong coupling of lattice phonons with the electronic transitions. The spacing between the most intense vibronic peaks of about 800–850 cm−1 is due to the O–U–O symmetric ν1 phonon stretching mode which is Raman-active. The spectra are of good quality, especially for those samples available in very low amounts (ulrichite, phosphuranylite). The non-smoothed ulrichite spectrum is background removed with a broad Gaussian profile of 5621 cm−1 width. While steady state experiments evidence hot PL bands,17 these weak features are not definitely identified in the present transient spectra. Their possible contributions might be shifted with larger intensity or merged in the fluorescence background. Table 1 compiles the TRPL emission energies found by fitting the PL bands with Voigt functions in the current study.
| Minerals | TRPL peaks (cm−1) | FWHM (cm−1) | R2 |
|---|---|---|---|
| Vibronic separations | |||
| a R2 is the correlation coefficient between experimental spectra and Voigt fits.b w is very weak intensity. | |||
| Uranocircite Ba(UO2)2(PO4)2·10H2O | 16![[thin space (1/6-em)]](https://www.rsc.org/images/entities/char_2009.gif) 594w(±62)–17 594w(±62)–17![[thin space (1/6-em)]](https://www.rsc.org/images/entities/char_2009.gif) 348(±25)–18 348(±25)–18![[thin space (1/6-em)]](https://www.rsc.org/images/entities/char_2009.gif) 169(±6)–18 169(±6)–18![[thin space (1/6-em)]](https://www.rsc.org/images/entities/char_2009.gif) 877(±5)–19 877(±5)–19![[thin space (1/6-em)]](https://www.rsc.org/images/entities/char_2009.gif) 544(±12) 544(±12) |
386(±100)–653(±7)–790(±60)–585(±10)–815(±103) | 0.9997 |
| 754(±37)–821(±19)–708(±1)–667(±7) | |||
| Ulrichite CaCu(UO2) (PO4)2·4H2O | 17![[thin space (1/6-em)]](https://www.rsc.org/images/entities/char_2009.gif) 730(±30)–18 730(±30)–18![[thin space (1/6-em)]](https://www.rsc.org/images/entities/char_2009.gif) 510(±57)–19 510(±57)–19![[thin space (1/6-em)]](https://www.rsc.org/images/entities/char_2009.gif) 290(±8)–20 290(±8)–20![[thin space (1/6-em)]](https://www.rsc.org/images/entities/char_2009.gif) 080(±30) 080(±30) |
943(±200)–538(±19)–678(±53)–763(±163) | 0.9430 (noisy spectrum) |
| 780(±27)–780(±49)–790(±22) | |||
| Metatorbernite Cu(UO2)2(PO4)2·8H2O | 16594w–17388(±33)–18182(±11)–18965(±8)–19744(±12) | 501–549(±6)–485(±13)–519(±10)–591(±55) | 0.9993 |
| 794(±33)–794(±22)–783(±2)–779(±4) | |||
| Saleeite Mg(UO2)2(PO4)2·10H2O | 16![[thin space (1/6-em)]](https://www.rsc.org/images/entities/char_2009.gif) 741w(±6)–17 741w(±6)–17![[thin space (1/6-em)]](https://www.rsc.org/images/entities/char_2009.gif) 547(±3)–18 547(±3)–18![[thin space (1/6-em)]](https://www.rsc.org/images/entities/char_2009.gif) 340(±15)–19 340(±15)–19![[thin space (1/6-em)]](https://www.rsc.org/images/entities/char_2009.gif) 131(±2)–19 131(±2)–19![[thin space (1/6-em)]](https://www.rsc.org/images/entities/char_2009.gif) 895(±17) 895(±17) |
447–463(±10)–470(±38)–495(±3)–490(±32) | 0.9995 |
| 806(±3)–793(±12)–791(±13)–764(±15) | |||
| Phosphuranylite KCa(H3O)3(UO2)7(PO4)4O4·8H2O | Unresolved, centered at ∼18![[thin space (1/6-em)]](https://www.rsc.org/images/entities/char_2009.gif) 835 835 |
N/A | N/A |
| Unresolved | |||
The vibronic component maxima and the FWHM of the fitted peaks are presented in cm−1 units with uncertainty linked to fitting accuracy. The smallest intervals around 700 cm−1 could correspond to the energy separations associated with the O–U–O symmetric stretching phonon of the lowest excited state as can be seen from absorption experiments,17,40 although the corresponding bands are much higher in intensity than in a steady state. The largest interval values above 754 cm−1 correspond within wavenumber uncertainty to the vibrational Raman-active frequency of uranyl moieties in the ground state, and they are close to those determined earlier in our steady state experiments.17
Saleeite and uranocircite show PL spectra centered around 19![[thin space (1/6-em)]](https://www.rsc.org/images/entities/char_2009.gif) 119 cm−1 and 18
119 cm−1 and 18![[thin space (1/6-em)]](https://www.rsc.org/images/entities/char_2009.gif) 889 cm−1, respectively. The spectra are relatively well structured and resolved with strong relative intensity differences in the components of the vibronic structure. Metatorbernite is a mineral with PL transients close both to saleeite in relative intensities and to uranocircite in spectral locations, but with different PL kinetics. The metatorbernite peaks are slightly redshifted with respect to saleeite, with a maximum PL around 18
889 cm−1, respectively. The spectra are relatively well structured and resolved with strong relative intensity differences in the components of the vibronic structure. Metatorbernite is a mineral with PL transients close both to saleeite in relative intensities and to uranocircite in spectral locations, but with different PL kinetics. The metatorbernite peaks are slightly redshifted with respect to saleeite, with a maximum PL around 18![[thin space (1/6-em)]](https://www.rsc.org/images/entities/char_2009.gif) 967 cm−1.
967 cm−1.
The emission of phosphuranylite (Fig. 3) is non-structured with a large band centered around 18![[thin space (1/6-em)]](https://www.rsc.org/images/entities/char_2009.gif) 835 cm−1. It is possible to distinguish a shoulder at about 21
835 cm−1. It is possible to distinguish a shoulder at about 21![[thin space (1/6-em)]](https://www.rsc.org/images/entities/char_2009.gif) 276 cm−1. The broad spectrum of this mineral is ascribed to the many vibrational modes arising from three different uranyl sites in the crystal and is almost identical to steady-state PL spectra recorded elsewhere.41–43 Ulrichite also presents a broad PL band with weak intensity due to the low amount of material. The PL maximum is located around 19
276 cm−1. The broad spectrum of this mineral is ascribed to the many vibrational modes arising from three different uranyl sites in the crystal and is almost identical to steady-state PL spectra recorded elsewhere.41–43 Ulrichite also presents a broad PL band with weak intensity due to the low amount of material. The PL maximum is located around 19![[thin space (1/6-em)]](https://www.rsc.org/images/entities/char_2009.gif) 251 cm−1 with a vibronic structure better resolved after spectral background treatment.
251 cm−1 with a vibronic structure better resolved after spectral background treatment.
Fig. 4 displays the temporal profiles taken by integrating the PL intensity over the whole spectrum. All minerals present a more or less pronounced bi-exponential non-linear PL decay in semi-log scales as observed in other studies.19,43 In fact, uranocircite and saleeite luminescence can be ascribed to mainly one uranyl species. The other minerals exhibit a more nonlinear decay which can be attributed to at least two different uranyl species yielding short-lived and long-lived luminescence.
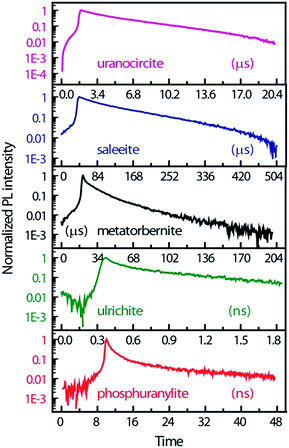 | ||
| Fig. 4 PL kinetics and temporal profiles observed in the different minerals, integrated over the whole spectral ranges of Fig. 3 and displayed in an intensity log scale normalized to 1. Zero-time delay corresponds to the beginning of the streak camera sweep. | ||
In Table 2, the decay times of the PL have been reported and compiled. R2 of the fits is >0.99 except for ulrichite. From Fig. 4 and Table 2, saleeite has the longest lifetime among the investigated minerals, and its decay is almost mono-exponential with a PL extending up to 500 μs and a decay time τ2 of 153 μs. This value is comparable to the lifetime τ2 found by Othmane et al.20 in autunite. In contrast, the lifetime of uranocircite is about twenty times shorter (7 μs) with a quasi-linear PL decay. The PL of metatorbernite is decaying with a bi-exponential function and yields a τ2 lifetime of 32 μs closer to that of uranocircite. The lifetimes of the bi-exponential PL decays in ulrichite and phosphuranylite are in the nanoseconds range with τ2 values of 1.1 and 9.1 ns, respectively.
| Minerals | τ1 (μs) | τ2 (μs) | QY range | τr (μs) range | τnr (μs) range | R2 |
|---|---|---|---|---|---|---|
| a R2 is the correlation coefficient between temporal profiles and kinetics fits.b Deduced from full images except for ulrichite (see Fig. 5). | ||||||
| Saleeite | 31.9 ± 1.4 | 152.7 ± 3 | 0.17–0.34 | 450–900 | 184–232 | 0.9935 |
| Metatorbernite | 10.1 ± 0.18 | 31.6 ± 0.88 | 0.035–0.07 | 451–952 | 33–34 | 0.9994 |
| Uranocircite | 1.5 ± 0.06 | 7.0 ± 0.16 | 0.007–0.015 | 467–934 | 7.0–7.4 | 0.9936 |
Ulrichite: from peak at 19![[thin space (1/6-em)]](https://www.rsc.org/images/entities/char_2009.gif) 290 cm−1 290 cm−1 |
(6.5 ± 0.004) × 10−5 | (1.11 ± 0.04) × 10−3 | 1.2 × 10⁻⁶ to 2.4 × 10⁻⁶ | 458–916 | ∼1.1 × 10⁻³ | 0.9218 low signal to noise ratio |
| Phosphuranylite | (1 ± 0.1) × 10−3 | (9.1 ± 0.2) × 10−3 | 1 × 10⁻⁵ to 2 × 10⁻⁵ | 454–908 | ∼9.1 × 10⁻³ | 0.9900 |
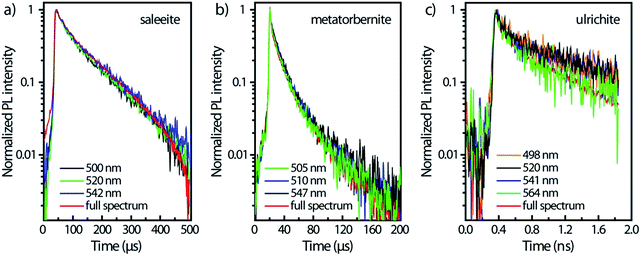
Fig. 5 presents the temporal evolution of the strong vibronic bands in three minerals. In the case of saleeite and metatorbernite, the luminescence decay curves in ROIs (all colored curves except the red ones in Fig. 5) are limited to the most intense individual vibronic components (thin vertical pink ROIs like in Fig. 2). They are hardly distinguishable from the whole spectrally integrated ones (red curves in Fig. 5). The luminescence is decaying at essentially the same rate in each mineral for each intense vibronic emission peak displayed by the colored curves. The same behavior is found in unanocircite, not shown here.
The unequivocal discrimination of minerals which have very close emission spectra like saleeite and metatorbernite can be done by examining their decays which are not extending over the same temporal scale. This fact is exemplified in Fig. 5a and b. In general, simple observation of fluorescence maps (Fig. 2) obtained for different sweep ranges provides qualitative signatures of each mineral studied.
For ulrichite, there is no visible effect of refractive index variation vs. wavelength despite rapid nanosecond sweep time. The PL kinetics kickoff at time t0 does not vary substantially with wavelength as seen by the onsets of PL front in Fig. 5c after beginning of sweeps. Lifetimes τ2 are found to be about 624 ps for the full spectrum, and 1.1 ns for the decays at the most intense PL emissions 520 nm and 541 nm.
Spectral snapshots (thin horizontal yellow ROIs like in Fig. 2f) were extracted from the images at fixed time delays after beginning of streak camera sweep. The temporal evolution of the spectra (not shown) does not display significant changes in the peak positions except for absolute intensities. The PL spectrum of saleeite is slightly red shifted at long time (1 nm to 3 nm). In metatorbernite and uranocircite it is not possible to discern a shift of the vibronic lines. As exemplified in Fig. 6, the overall spectra of ulrichite and phosphuranylite narrow as time evolves, and vibronic features are hidden in the noise resulting from the weaker PL signal at longer times.
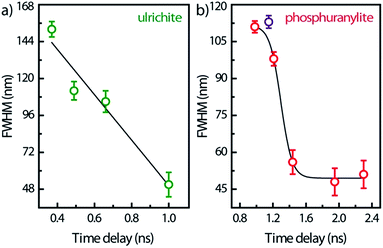 | ||
| Fig. 6 FWHM temporal variation of the whole PL band in ulrichite and phosphuranylite (see Fig. 2d and e) after laser excitation. Solid lines are visual guides; zero-time delay corresponds to the beginning of the streak camera sweep. | ||
From previous studies, it is ascertained that free uranyl ions in solutions give lifetimes between 1 μs and 5 μs.44 Two compounds in the present study (phosphuranylite and ulrichite) exhibit very short lifetimes (in the range of nanoseconds) in comparison to other minerals of the studied series that luminesce between 5 μs and 150 μs (Fig. 4). In phosphuranylite, short decay times can originate from H3O+ groups present in the phase, together with OH− hydroxyls which could quench the luminescence in the solid state. While water molecules can affect the lifetimes of uranyl luminescence, the relationship is not straightforward. The mineral structures are complex, with several types of water sometimes being present. These include lattice water that is not directly bonded to the central uranyl ion, directly bonded water, hydrogen bonded water, and water that is more associated with a second metal ion. Additionally, in some uranyl mineral structures, the second metal ion, such as copper(II), exhibiting a d9 electron configuration, is paramagnetic. Paramagnetic ions like copper(II) have been known to affect the lifetimes or PL intensity, with the effect being previously discussed. In the present study, metatorbernite and ulrichite fall into this category, with intralattice coupling of all the molecules in the structure making the exact uranyl ion lifetime-water content relationship uncertain.45,46
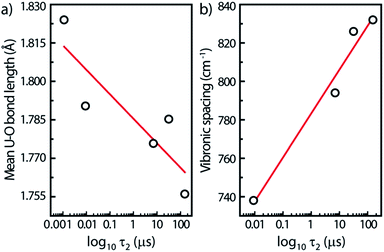
For this study, we have found rough relationships between the uranyl PL lifetime and U–O bonds. Note that these trends may be absent for other parent minerals. In Fig. 7a, the PL lifetimes of all five minerals decrease with increasing U–O bond lengths averaged over each unit cell. Lopez and Birch noted that in solutions of uranyl nitrate hexahydrate the (UO2)2(OH)22+ dimer has a longer lifetime than the monomer.38 Since the uranyl center in the monomer can be assumed to be at infinite distance to other uranyl centers in the solution, a general rule may be assumed concerning increasing U⋯U distances and decreasing lifetimes.
Another linear relationship is observed between increasing steady-state vibronic separation ν1 given by the energy difference between (0,0) and (0,1) peak transitions of the minerals17 and increasing PL lifetimes plotted on a log scale (Fig. 7b). The dependence between the ν1 Raman frequency (or vibronic spacing) and the τ2 lifetime is related with the fact that both quantities seem to increase when the number of water species inside the mineral is augmented, i.e., that water-poor containing minerals have their luminescence quenched. Geipel et al.29 observed, indeed, a decrease of the luminescence lifetime by about one order of magnitude from the water-rich to the water-poor containing uranium(VI) minerals.
A total quantum yield can be determined with TRPL from the following equation:
 | (3) |
| Φf = krτ | (4) |
Phosphuranylite and ulrichite quantum yields are very small due to the short decay times. Indeed, by naked eye observation, it is not possible to discern the luminescence of phosphuranylite and ulrichite under either UV lamp or laser excitation. Qualitatively, saleeite is glowing green intensely at lower laser powers and gives the higher Φf, while the glow of metatorbernite and uranocircite is much lesser from photon counts recorded on the CCD detector, in agreement with their Φf estimates.
PL decay analysis can also yield τr radiative or τnr non-radiative lifetimes, since Φf has been determined. Now, it is straightforward to estimate τr and τnr
| τr = τ/Φf and τnr = τ/(1 − Φf) | (5) |
These results show that the photoluminescence technique described here could be applied to remote imaging embarking airborne or seaborne laser luminescence systems for the detection and discrimination of uranium wastes and naturally occurring uranium present inland, in seawater, or on seabeds. Such remote sensing approach could be used on its own or as a complement to gamma ray spectrometry.50–52
4 Conclusions
Time-resolved photoluminescence imaging with a streak camera provides robust temporal fingerprints permitting to identify or detect low amounts of uranyl phosphates hydrates in the solid state. Luminescence decay lifetimes were used to give a range of luminescence quantum yields and radiative/non-radiative lifetimes in the minerals. The present results have strong implications in environmental analysis by making use for example of embarked devices based on remote laser-excited uranyl sensors for selective detection of uranium in geologic beds or waters.Acknowledgements
This work was supported by the U. S. Department of Energy under Contract No. DE-ACO3-76SF00098. We thank V. G. Ivanov for useful discussions and J. Y. Mevellec for crystals microphotographs.References
- E. Rabinowitch and R. L. Belford, in International Series of Monographs on Nuclear Energy, Division XII: Chemistry, Pergamon Press, Oxford, 1964 Search PubMed.
- H. D. Burrows and T. J. Kemp, Chem. Soc. Rev., 1974, 3, 139–165 RSC.
- C. K. Jørgensen and R. Reisfeld, Chem. Phys. Lett., 1975, 35, 441–443 CrossRef.
- D. L. Perry, H. Ruben, D. H. Templeton and A. Zalkin, Inorg. Chem., 1980, 19, 1067–1069 CrossRef CAS.
- H. G. Brittain and D. L. Perry, J. Phys. Chem., 1980, 84, 2630–2634 CrossRef CAS.
- S. J. Formosinho, H. D. Burrows, M. da Graça Miguel, M. E. D. G. Azenha, I. M. Saraiva, A. C. D. N. Ribeiro, I. V. Khudyakov, R. G. Gasanov, M. Bolte and M. Sarakha, Photochem. Photobiol. Sci., 2003, 2, 569–575 CAS.
- R. G. Denning, J. Phys. Chem. A, 2007, 111, 4125–4143 CrossRef CAS PubMed.
- C. K. Jørgensen and R. Reisfeld, in Topics in Inorganic and Physical Chemistry, Springer, Berlin, Heidelberg, 1982, vol. 50, pp. 121–171 Search PubMed.
- G. Meinrath, J. Radioanal. Nucl. Chem., 1997, 224, 119–126 CrossRef CAS.
- M. E. Azenha and G. Blasse, J. Alloys Compd., 1993, 196, 81–85 CrossRef CAS.
- E. Fritsch, L. Mihut, M. Baibarac, I. Baltog, M. Ostrooumov, S. Lefrant and J. Wery, J. Appl. Phys., 2001, 90, 4777–4782 CrossRef CAS.
- Z. Wang, J. M. Zachara, P. L. Gassman, C. Liu, O. Qafoku, W. Yantasee and J. G. Catalano, Geochim. Cosmochim. Acta, 2005, 69, 1391–1403 CrossRef CAS.
- M. Del Nero, C. Galindo, R. Barillon and B. Madé, Environ. Sci. Technol., 2011, 45, 3982–3988 CrossRef CAS PubMed.
- R. Vochten and K. Van Springel, Mineral. Mag., 1996, 60, 647–651 CAS.
- A. O. Matkovskiy, G. A. Sidorenko and A. N. Tarashchan, Int. Geol. Rev., 1981, 23, 91–95 CrossRef.
- G. Wang, Y. Su and D. L. Monts, J. Phys. Chem. A, 2008, 112, 10502–10508 CrossRef CAS PubMed.
- E. Faulques, N. Kalashnyk, F. Massuyeau and D. L. Perry, RSC Adv., 2015, 5, 71219–71227 RSC.
- J. B. M. Novo, F. R. Batista, C. J. da Cunha, L. C. Dias and F. B. T. Pessine, J. Lumin., 2007, 124, 133–139 CrossRef CAS.
- N. Baumann, T. Arnold, H. Foerstendorf and D. Read, Environ. Sci. Technol., 2008, 42, 8266–8269 CrossRef CAS PubMed.
- G. Othmane, T. Allard, T. Vercouter, G. Morin, M. Fayek and G. Calas, Chem. Geol., 2016, 423, 1–6 CrossRef CAS.
- M. M. Olken, R. N. Biagioni and A. B. Ellis, Inorg. Chem., 1983, 22, 4128–4134 CrossRef CAS.
- M. Moriyasu, Y. Yokoyama and S. Ikeda, J. Inorg. Nucl. Chem., 1977, 39, 2211–2214 CrossRef CAS.
- M. Moriyasu, Y. Yokoyama and S. Ikeda, J. Inorg. Nucl. Chem., 1977, 39, 2199–2203 CrossRef CAS.
- R. G. Denning, C. N. Ironside, J. R. G. Thorne and D. R. Woodwark, Mol. Phys., 1981, 44, 209–224 CrossRef CAS.
- L. V. Haley and J. A. Koningstein, J. Phys. Chem. Solids, 1983, 44, 431–433 CrossRef CAS.
- M. Lopez and D. J. S. Birch, Analyst, 1996, 121, 905–908 RSC.
- V. Brendler, G. Geipel, G. Bernhard and H. Nitsche, Radiochim. Acta, 1996, 74, 75–80 CrossRef CAS.
- C. Moulin, I. Laszak, V. Moulin and C. Tondre, Appl. Spectrosc., 1998, 52, 528–535 CrossRef CAS.
- G. Geipel, G. Bernhard, M. Rutsch, V. Brendler and H. Nitsche, Radiochim. Acta, 2000, 8, 757–762 Search PubMed.
- N. Baumann, V. Brendler, T. Arnold, G. Geipel and G. Bernhard, J. Colloid Interface Sci., 2005, 290, 318–324 CrossRef CAS PubMed.
- Z. Wang, J. M. Zachara, C. Liu, P. L. Gassman, A. R. Felmy and S. B. Clark, Radiochim. Acta, 2008, 96, 591–598 CAS.
- S. A. Miller and J. C. Taylor, Z. Kristallogr., 1986, 177, 247–253 CrossRef CAS.
- A. J. Locock and P. C. Burns, Can. Mineral., 2003, 41, 489–502 CrossRef CAS.
- A. O. Matkovskiy, G. A. Sidorenko and A. N. Tarashchan, Int. Geol. Rev., 2010, 23, 91–95 CrossRef.
- U. Kolitsch and G. Giester, Mineral. Mag., 2001, 65, 717–724 CrossRef CAS.
- F. Demartin, V. Diella, S. Donzelli, C. M. Gramaccioli and T. Pilati, Acta Crystallogr., Sect. B: Struct. Sci., 1991, 47, 439–446 CrossRef.
- A. Kasdan, R. J. L. Chimenti and J. P. deNeufville, Appl. Opt., 1981, 20, 1297–1307 CrossRef CAS PubMed.
- M. Lopez and D. J. S. Birch, Chem. Phys. Lett., 1997, 268, 125–132 CrossRef CAS.
- J. Su, K. Zhang, W. H. E. Schwarz and J. Li, Inorg. Chem., 2011, 50, 2082–2093 CrossRef CAS PubMed.
- C. K. Jørgensen, J. Electrochem. Soc., 1983, 130, 681–684 CrossRef.
- R. L. Frost, J. Čejka and G. Ayoko, J. Raman Spectrosc., 2008, 39, 495–502 CrossRef CAS.
- R. J. P. Driscoll, D. Wolverson, J. M. Mitchels, J. M. Skelton, S. C. Parker, M. Molinari, I. Khan, D. Geeson and G. C. Allen, RSC Adv., 2014, 4, 59137–59149 RSC.
- Database of Raman spectroscopy, X-ray diffraction and chemistry of minerals, http://rruff.info/.
- V. Eliet, G. Bidoglio, N. Omenetto, L. Parma and I. Grenthe, J. Chem. Soc., Faraday Trans., 1995, 91, 2275–2285 RSC.
- M. Frisch and C. L. Cahill, Dalton Trans., 2005, 1518–1523 RSC.
- A.-G. D. Nelson and T. E. Albrecht-Schmitt, C. R. Chim., 2010, 13, 755–757 CrossRef CAS.
- W. K. Chan, K. H. Chun, T. W. Lai and A. F. Leung, Can. J. Phys., 1979, 57, 2045–2049 CrossRef CAS.
- C. D. Flint and P. A. Tanner, J. Chem. Soc., Faraday Trans., 1984, 80, 219–226 RSC.
- V. Sytko and M. Pershina, Proc. SPIE, 1995, 2531, 272–280 CrossRef CAS.
- J. P. DeNeufville, A. Kasdan and R. J. L. Chimenti, Appl. Opt., 1981, 20, 1279–1296 CrossRef CAS PubMed.
- A. T. McCay, T. L. Harley, P. L. Younger, D. C. W. Sanderson and A. J. Cresswell, Energies, 2014, 7, 4757–4780 CrossRef.
- M. S. Ramayya, A. K. Chaturvedi, I. Patra, D. Srinivas and P. Yadagiri Reddy, J. Geol. Soc. India, 2014, 84, 311–318 CrossRef CAS.
| This journal is © The Royal Society of Chemistry 2017 |

