 Open Access Article
Controlled synthesis and enhanced luminescence of BiOCl:Eu3+ ultrathin nanosheets†
Yangyang Guoa,
Zhijun Zhanga,
Gangqiang Zhub,
Weibin Zhanga and
Woochul Yang*a
aDepartment of Physics, Dongguk University, Seoul, 04620, Korea. E-mail: wyang@dongguk.edu
bDepartment of Physics, Shaanxi Normal University, Xi'an, 710062, China
First published on 12th January 2017
Abstract
BiOCl:Eu3+ ultrathin nanosheets were synthesized through a facile solvothermal method with the assistance of polyvinyl pyrrolidone. The ultrathin nanosheets showed a size ranging from 50–100 nm and a height of 2.9 nm, which is about four [Cl–Bi–O–Bi–Cl] layers. In addition, the luminescence properties and mechanism were investigated in detail, and compared with that of the nanoplate. It was found that the luminescence intensity for the BiOCl:Eu3+ ultrathin nanosheet was 6 times stronger than that of the nanoplate. Importantly, the oxygen vacancies act as a luminescence centers, and there was effective energy transfer from BiOCl ultrathin nanosheets to Eu3+ ions. In BiOCl:Eu3+ ultrathin nanosheets, white-light emission was observed under near-ultraviolet (NUV) excitation. These BiOCl:Eu3+ ultrathin nanosheets exhibit great potential as color-emitting phosphors for white light-emitting diode applications.
1. Introduction
Recently, two-dimensional (2D) materials composed of a single or few atomic layers have attracted tremendous interest,1–4 because of their fascinating potential applications in electronics,5 catalysis,6 energy storage,7 solar cells,8 wearable devices,9 and luminescence.10 2D materials with nanoscale thicknesses are quite alluring candidates for phosphors because of their large surface-to-volume ratio compared to bulk, which improves the photoelectric performance of the semiconductors.11,12 Moreover, these materials are suitable for fabricating optoelectronic devices, such as electroluminescence panels, which consist of a stack of functional layers or sheets.13 Therefore, an emphatic work has been done on fabricating the 2D materials to explore their full potential applications.Bismuth oxychloride (BiOCl) is an indirect band gap semiconductor of group V–VI–VII family, with a wide band gap of 3.5 eV.14 In particular, BiOCl presents a tetragonal structure with [Cl–Bi–O–Bi–Cl] layers stacked together via weak van der Waals interaction through the Cl atoms along the c-axis. Also, [Bi2O2]2+ layers are sandwiched between two slabs of halogen ions. The layered structure of BiOCl exhibits excellent electronic and optical properties, with many important and potential applications such as phosphor, photocatalyst, gas sensor, magnetic materials, and pigments in the cosmetic industry.15–20 Furthermore, BiOCl has a relatively low phonon energy (as low as ∼400 cm−1) compared to other inorganic compounds, which improves the probability of radiative transition.21 The wide band gap of BiOCl can provide an optical window for the inherent quenching of rare earth ions.22 In addition, the ionic radius and charge of Bi3+ are comparable with trivalent rare earth ions Eu3+, which is beneficial for Eu3+ replacing Bi3+ in the BiOCl host lattice. Therefore, high luminescence quantum efficiency is expected to be obtained in BiOCl:Eu3+ phosphors. Li et al. synthesized BiOCl:Eu3+ powder, which possessed a broad excitation band in the near-ultraviolet (NUV) region, through a solid-state method. The phosphors exhibited great potential as red-emitting phosphors for white LED, owing to their excellent broadband NUV excitation ability and special far-red emission property.23 Yu et al. reported the up-conversion emission and cathodoluminescence (CL) of Yb3+ ions activated BiOCl:Ho3+ phosphors. These phosphors showed excellent CL properties and the CL emission intensity increased with increasing accelerating voltage and filament current.24 Armita et al. reported the luminescence of nanoflakes/BiOX:Eu3+ (X = Cl, Br, I) and suggested that both BiOCl and BiOBr were good host matrices for RE3+ ions to exhibit effective luminescence properties as well as excellent photocatalytic properties under sunlight irradiation.25 In our previous work, the luminescence of nanoflower-like structures showed that Eu3+ and Sm3+-activated BiOCl, where flower-like structure exhibited a strong red emission corresponding to the typical f–f transitions of Eu3+ and Sm3+, respectively.26 Xie et al. reported the ultrathin BiOCl nanosheet with excellent catalytic activity related to the presence of oxygen vacancy defects.27 Zhao et al. carried out systematic calculation of the electronic structure and studied the optical properties of BiOCl:Eu3+ using first-principles method. He revealed that BiOCl:Eu3+ was favorable not only for luminescence but also for photocatalysis applications.28,29
However, to the best of our knowledge, only a few studies have been undertaken to probe into the luminescence properties of BiOCl:Eu3+ 2D material. Therefore, we synthesized BiOCl:Eu3+ nanoplates and ultrathin nanosheets using a facile solvothermal method. The luminescence properties, depending on the thickness and the exposed facets, were investigated in detail. The density of oxygen vacancies in the lattice structure is also substantiated.
2. Experimental section
2.1 Sample preparation
All the chemical reagents used in this work were of analytical grade, and ere applied during the synthesis of BiOCl:Eu3+ ultrathin nanosheets, without any further purification. Stoichiometric amounts of Eu(NO3)3, Bi(NO3)3·5H2O and 0.52 g PVP were dissolved in 32.5 mL mannitol solution (0.1 M) with vigorous stirring for 10 min. Then, 6.5 mL of saturated NaCl solution was slowly added to the above mixture, producing a uniform white suspension. After 30 min of agitation, the mixture was transferred into a Teflon-lined stainless steel autoclave of 50 mL capacity, and the autoclave was then placed in an oven with a temperature of 160 °C for 3 h. Afterward, the autoclave was allowed to naturally cool down to room temperature (RT). The resulting precipitate was collected, and washed for several times with deionized water and ethanol. The obtained powder was dried at 70 °C for 4 h for further characterization. Similarly, the BiOCl:Eu3+ nanoplates were synthesized by the same experimental method without the surfactant (PVP).2.2 Characterization
X-ray diffraction (XRD) data was collected at room temperature by D/Max 2550 diffractometry (Rigaku, Japan) at a scanning rate of 5 degree per min in the 2θ range of 10–80° with Cu Kα1 radiation (λ = 1.54056 Å) at 40 kV and 100 mA. The transmission electron microscopy (TEM) and high-resolution TEM (HRTEM) images of the samples were taken with a JEM-2100 electron microscope (JEOL, Japan) operated at an acceleration voltage of 200 kV. The UV-vis diffuse reflectance spectra were measured by Lambda 950 UV-VIS-NIR spectrophotometry (Perkin-Elmer, USA) in the wavelength range of 300–700 nm. The excitation and emission spectra of the samples were recorded at RT by fluorescence spectrophotometry (F-4600 Hitachi, Japan). The scan speed was fixed at 240 nm min−1, and the photomultiplier tube voltage and slit widths were fixed for all the samples at 700 V and 2.5 nm, respectively.3. Result and discussion
3.1 Phase formation of BiOCl:Eu3+ ultrathin nanosheet and nanoplate
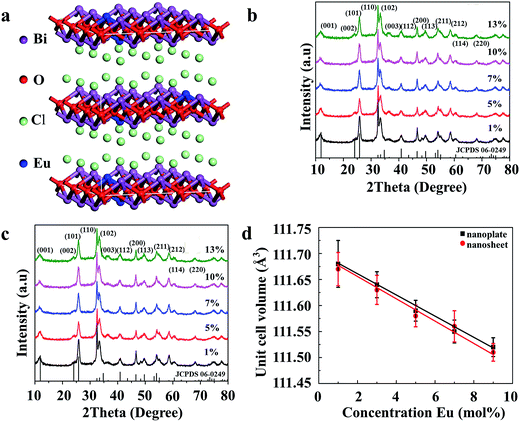
Fig. S1 (ESI†) shows the XRD patterns of the synthesized Bi0.9Eu0.1OCl ultrathin nanosheet and nanoplate and the standard data of BiOCl (JCPDS card no. 06-0249). All diffraction peaks are in good agreement with the values in the JCPDS card, indicating that the samples are of single phase, and doping of Eu3+ ions does not cause any significant changes to the host material. All the samples were crystallized in tetragonal phase (a = b = 0.3891 nm, c = 0.7369 nm) with the space group P4/nmm. The XRD patterns of nanoplates and nanosheets differ from each other. The ultrathin nanosheets give much broader and less intense peaks. The full width at half-maximum (FWHM) of the (001) peak of the obtained Bi0.9Eu0.1OCl ultrathin nanosheet and nanoplate are 1.74° and 0.41°, respectively. The XRD patterns of Bi0.9Eu0.1OCl nanoplates consist of sharp and distinct diffraction peaks, indicating a higher crystalline nature and large grain size. Compared with Bi0.9Eu0.1OCl nanoplate, the diffraction intensity ratio of (110)/(001) planes for Bi0.9Eu0.1OCl ultrathin nanosheet is much higher, which is attributed to the ultrathin nanosheet oriented along the [001] orientation, with a relatively large lateral size oriented along the [110] direction.30 The tetragonal structure of BiOCl:Eu3+ is evidence of the basic unit cell crystal structure (Fig. 1a). Fig. 1b and c show the XRD patterns of BiOCl nanosheets and nanoplates doped with different concentrations of Eu3+ ions. The XRD patterns do not show any significant changes with the increase in concentration of Eu3+ ions. The incorporation of Eu3+ ions into the host material can be verified from estimation of the unit cell parameters of the samples. Fig. 1d shows the relationship between the unit cell volumes and Eu3+ doping concentrations for both nanoplate and ultrathin nanosheet. The unit cell volume of Bi1−xEuxOCl ultrathin nanosheets (x = 0.01, 0.05, 0.07, 0.10 and 0.13) is smaller than that of Bi1−xEuxOCl nanoplates, which is consistent with the XRD results. The unit cell volumes were found to linearly decrease by about 0.16 and 0.17% for nanosheet and nanoplate samples, respectively, with an increase of Eu3+ in BiOCl, as the ionic radii of Eu3+ (r = 1.066 Å, CN = 8) is smaller than that of Bi3+ (r = 1.17 Å, CN = 8).31 As a consequence, when Bi3+ is substituted by Eu3+, the shrinkage of the unit cell volume is clearly observed, as expected.323.2 Morphology of BiOCl nanostructures
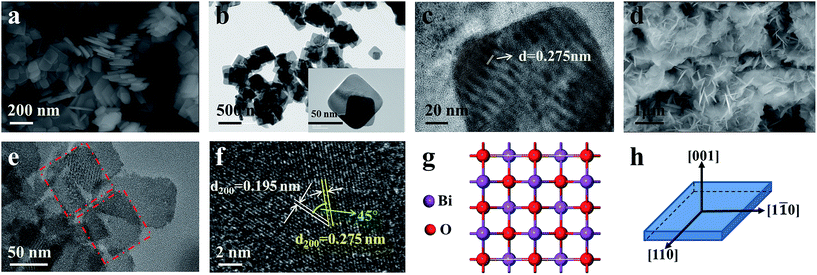
Fig. 2 shows the morphology of the as-prepared Bi0.9Eu0.1OCl nanostructures, as investigated by SEM and TEM images. The SEM image of Fig. 2a clearly shows the formation of nanoplates in the sample. The nanoplate size is in the range of 100–200 nm, with an estimated thickness of 15–20 nm. Fig. 2b shows the TEM imagery of the samples, and the formed particles are almost of square shape. The inset of Fig. 2b shows high magnification TEM imagery of a few square-like nanoplates. Fig. 2c shows the high crystallinity of the particles demonstrated by HRTEM imagery. This figure shows the formation of clear lattice fringes, and the d-spacing calculated from the lattice fringes is found to be 0.275 nm, which is in good agreement with the standard JCPDS card values. The clear 2D lattice fringe demonstrates the high crystallinity and smooth exposed facets of such large nanoplates. Fig. 2d shows the SEM imagery of Bi0.9Eu0.1OCl ultrathin nanosheet, which contains numerous square-like nanosheets having a size in the range of 50–100 nm. During the synthesis process, we found that the existence of PVP exhibits a significant influence on the formation of BiOCl:Eu3+ ultrathin nanosheets. It is well known that the commonly used PVP is an effective surfactant, which can function as a surface stabilizer, and its long polymeric chain structure will completely surround one or more nuclear Bi oxyhalides.33 Importantly, the PVP can be adsorbed on the specific plane, and controls the growth of 2D nanostructures of BiOCl.34,35 Fig. 2e shows the TEM imagery that contains numerous square-like nanosheets having a size in the range of 50–100 nm. The HRTEM image (Fig. 2f) exhibits continuous lattice fringes with an interplanar lattice spacing of 0.275 nm. The angle of adjacent spots labeled in the HRTEM pattern is 45°, which is identical to the theoretical value of the angle between the (110) and (200) planes of tetragonal BiOCl. Fig. 2g shows the BiOCl [001] crystal structure, and reveals Bi and O atoms in a specific crystal plane. On the basis of the above structural and morphology information, the crystal orientation is as shown in Fig. 2h, where the top and bottom surfaces of the nanosheet are {001} facets, while the four lateral surfaces are {110} facets.36 The Bi0.9Eu0.1OCl nanoplate was also prepared for comparison under similar conditions as the Bi0.9Eu0.1OCl ultrathin nanosheet. Presuming that the length of each Bi0.9Eu0.1OCl nanostructure sample was the same as its width, the percentage of the {001} facets was estimated to be 86 and 36% for Bi0.9Eu0.1OCl ultrathin nanosheet and nanoplate, respectively. It is widely accepted that the {001} facets of BiOCl possess a high oxygen density,37 and the surface energy of O-terminated (001) surfaces was much smaller than the surface energy of Bi-terminated (001) surfaces, which is co-governed by the surface atom exposure, and the site-generated oxygen vacancy of the (001) surface.38 Consequently, the Bi0.9Eu0.1OCl ultrathin nanosheets with exposed {001} facets are expected to exhibit more oxygen defects, when compared with the Bi0.9Eu0.1OCl nanoplate.39 Fig. 3b shows a cross-sectional line profile of the BiOCl ultrathin nanosheet (as marked in Fig. 3a), indicating that the thickness estimated to be 2.9 nm corresponds to 4 [Cl–Bi–O–Bi–Cl] layers. The lateral size of Bi0.9Eu0.1OCl ultrathin nanosheet obtained by AFM is consistent with that from the TEM imagery, as shown in Fig. 3a.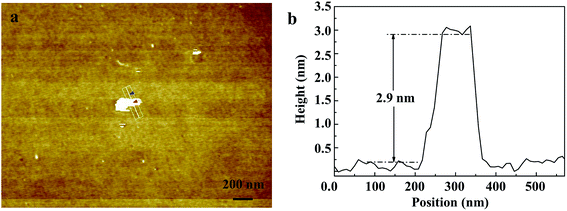 | ||
| Fig. 3 (a) AFM image of Bi0.9Eu0.1OCl ultrathin nanosheet. (b) Cross-section line profile of the Bi0.9Eu0.1OCl ultrathin nanosheet shown in (a). | ||
3.3 Identification of oxygen vacancy of Eu3+ activated BiOCl ultrathin nanosheets
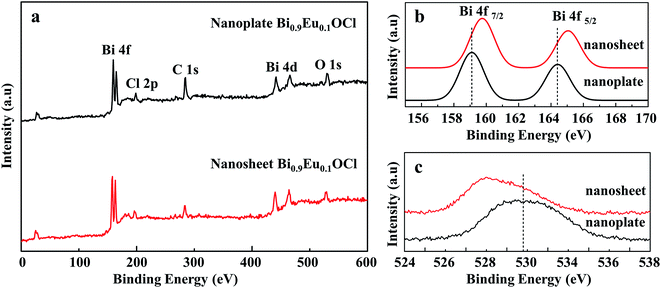
Fig. 4a shows that XPS analysis to identify the defects in the Bi0.9Eu0.1OCl ultrathin nanosheet and nanoplate. Fig. 4b shows the high-resolution Bi 4f XPS spectra of Bi0.9Eu0.1OCl ultrathin nanosheets and nanoplates. Compared with Bi0.9Eu0.1OCl nanoplates, the Bi 4f peaks of Bi0.9Eu0.1OCl ultrathin nanosheets shift to a higher binding energy. Furthermore, the binding energy of O 1s is about 529.05 eV for Bi0.9Eu0.1OCl ultrathin nanosheets, which is smaller than the 530.8 eV of Bi0.9Eu0.1OCl nanoplates (Fig. 4c). This shift may be attributed to the weakened hybridization between Bi 6s and O 2p, which leads to the decrease of binding energy of bismuth–oxygen bond (Bi–O).40 These shifts indicate the formation of surface oxygen vacancies in the Bi0.9Eu0.1OCl ultrathin nanosheets.413.4 Luminescence of Eu3+ activated BiOCl ultrathin nanosheets and BiOCl nanoplates
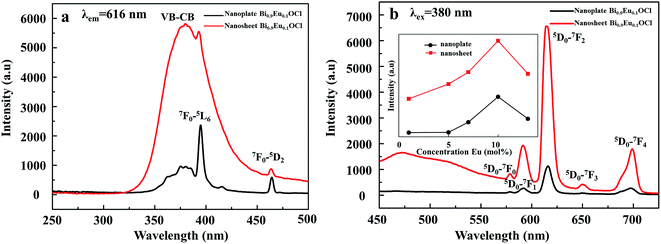
Zhao et al. analyzed the band gap of BiOCl:Eu3+ crystals through first-principles calculations, and confirmed the possibility of forming impurity levels due to Eu3+ doping.24,25 In this work, the DFT calculations have been applied to investigate the impurity level changes of the ultrathin Bi0.9Eu0.1OCl nanosheet. Fig. S2 and S3† show the crystal structure models, while Fig. S4 and S5† show the band structures of pure BiOCl and Bi0.9Eu0.1OCl. The impurity levels lead to the energy transfer from BiOCl to Eu3+ 4f state. The number of impurity levels increase with the increase of Eu3+ concentration, and finally show metallic property.42,43 To evaluate the effect of oxygen vacancy on the energy gap of the BiOCl:Eu3+ nanoplate and ultrathin nanosheets. Fig. S6 and S7 of the ESI† show the UV-Vis absorption spectra BiOCl with different Eu3+ concentrations. The band gap values calculated based on the Kubelka–Munk theory are shown in the insets of Fig. S6 and S7.† The band gap for the ultrathin nanosheets were found to be 3.2–3.35 eV, smaller than that of the nanoplates (3.36–3.4 eV). This is due to the fact that the oxygen vacancies play a role of narrowing the band gap instead of forming the impurity levels.44 The band gap becomes narrower with the increase in Eu3+ concentration for BiOCl ultrathin nanosheets and nanoplates (insets of Fig. S6 and S7†). This phenomenon is known as band gap narrowing (BGN), which is consistent with DFT calculations, as shown in Fig. S4 and S5,† the impurity states become more delocalized and overlap with the VB edge and raise the position of the VB. As a consequence, the raised VB band is beneficial for separation of the photo-induced electron–hole pairs.45 In the case of luminescence, there are more photogenerated electrons or holes that could transfer to Eu3+, resulting in enhancement of the emission intensity as expected.Fig. 5a shows the excitation spectra of ultrathin nanosheets and nanoplates of Bi0.9Eu0.1OCl monitored at 616 nm (5D0 → 7F2 transition) emission wavelength. The spectra reveal a broadband in the wavelength range of 300–450 nm, with the peak at 380 nm. The broadband is due to the transition from valence band to conduction band in the BiOCl host lattice.27 The intensity of broad band is higher for the ultrathin nanosheets than for the nanoplates. The intra-configurational f–f transitions of Eu3+ overlap with the host broadband, and are observed as weak peaks. The f–f transitions from 7F0 to 5G2, 5G3, 5L6 and 5D3 electronic transitions are observed at 377, 382, 394 and 416 nm, respectively. The peak at 464 nm is attributed to the 7F0 → 5D2 electronic transition. These peaks are clearly observed for the nanoplate sample, as the intensity of the host absorption band is weak. The results indicate that the BiOCl:Eu3+ phosphor own excellent broadband NUV-exciting ability. Fig. 5b shows the recorded emission spectra of f–f ultrathin nanosheets and nanoplates upon 380 nm excitation. The emission spectra show several sharp and well-resolved emission lines of Eu3+ corresponding to the radiative relaxations from the excited state (5D0) level to its low-lying multiplets 7FJ (J = 0, 1, 2, 3, 4). The strongest emission centered at around 616 nm corresponds to the electrical dipole transition (5D0 → 7F2) of Eu3+, indicating that the Eu3+ ions occupy the sites without inversion symmetry. Other line emission lines at about 578, 592, 650 and 697 nm are associated with 5D0 → 7F0, 7F1 (magnetic dipole transition), 7F3, and 7F4 transitions of Eu3+, respectively. The ultrathin nanosheet shows stronger emission intensity than the nanoplates sample. The inset of Fig. 5b shows that as the Eu3+ concentration increases from 1 to 10 mol%, the emission intensity increases. Furthermore, as the Eu concentration reaches 10 mol%, the emission intensity decreases, due to the concentration quenching effect. When the Eu3+ ions concentration increases, the distance between Eu and Eu decreases, which results in the increase of nonradiative energy transfer between the dopant ions. The distance at which the nonradiative transfer become comparable with the radiative emission is known as the critical distance (Rc). The Rc value can be estimated by the following well-known Blasse's equation:46
| Rc ≈ 2(3V/4πXcN)1/3 |
| I/C = K1/βCs/3 |
![[thin space (1/6-em)]](https://www.rsc.org/images/entities/char_2009.gif) C (Fig. 6a). The slope of the linear fit was found to be 0.73, and the s value was found to be 2.19 (close to the theoretical value of 3 for the exchange coupling). This indicates that exchange coupling is the major mechanism for the concentration quenching in BiOCl:Eu3+ phosphors.
C (Fig. 6a). The slope of the linear fit was found to be 0.73, and the s value was found to be 2.19 (close to the theoretical value of 3 for the exchange coupling). This indicates that exchange coupling is the major mechanism for the concentration quenching in BiOCl:Eu3+ phosphors.
An observation of note is the broad emission band centered at around 475 nm with a small shoulder, which probably originates from the oxygen vacancies. Such weak emission can arise in BiOCl:Eu3+ due to the transition of an electron from the conduction band (CB) to the valance band (VB) via oxygen vacancy state and trap levels. Under 380 nm excitation, Eu3+ emission can be observed, indicating efficient energy transfer from Eu3+ to oxygen vacancy. Because the Eu3+ concentrations in the different final products are the same, the different luminescence behaviors can be ascribed to the different morphologies of the two samples. Fig. 5b shows that the relative intensities of the PL peaks of the nanoplate exhibit weak luminescence. However, a significant enhancement of up to 600% was observed in the red luminescence intensity for the BiOCl:Eu3+ ultrathin nanosheets, compared with the nanoplates. The nanosheets of only 2.9 nm in thickness show more surface defects than the nanoplates. These results indicate that the luminescence properties of BiOCl:Eu3+ are very sensitive to its morphology, and are strongly dependent on the surface defects, i.e. more oxygen vacancies from the ultrathin nanosheet may also result in a strong emission intensity. BiOCl:Eu3+ ultrathin nanosheet has a large number of oxygen vacancies, as has been demonstrated by the XPS result. The origin of PL spectra includes red emission from Eu3+, and blue emission from the oxygen vacancy. As the thickness of BiOCl:Eu3+ decreases, the concentration of oxygen vacancies increases as the luminescence centres. This is the reason for the increasing emission intensity with decreasing thickness of BiOCl:Eu3+.
The PL mechanisms of BiOCl ultrathin nanosheet are mainly attributed to the effect of oxygen vacancies, which inevitably occur during the crystallization process. The oxygen vacancy acts as an electron trap to capture the electron.49 Fig. 6b shows a possible mechanism of the luminescence of BiOCl:Eu3+ ultrathin nanosheets. Under the excitation of UV light, the electrons coupled with excitation energy can be promoted from valence band to conduction band (progression (1)). In the conduction band, most of the electrons are then relaxed to the oxygen vacant state and luminescence centers of Eu3+ states via the non-radiative transitions (progressions (2, 3)), followed by the radiative transition to ground states. The broad peak below 550 nm is due to process (4), and the characteristic emission of Eu3+ is due to progression (5). With the 394 nm excitation, the energy transferring from the Eu3+ to oxygen vacancy (progression (6)) was observed, along with the Eu3+ emission. At the same time, the same progressions (4) & (5) occurred, and resulting in characteristic emission of Eu3+. Then, the intensity of red luminescence was observed.
Fig. 6c shows the commission international de l'éclairage (CIE) chromaticity coordinates of BiOCl:Eu3+ ultrathin nanosheets excited at 380 nm. This figure shows that the CIE chromaticity coordinates of Bi0.99Eu0.01OCl (0.281, 0.298) are around the blue-green, Bi0.95Eu0.05OCl (0.297, 0.255), Bi0.87Eu0.13OCl (0.322, 0.271), and Bi0.93Eu0.07OCl (0.338, 0.295) are around the white, and Bi0.9Eu0.1OCl (0.355, 0.308) are around the orange-yellow regions, indicating that the emission color can be tuned by modulation of the Eu3+ ion concentration from blue-green to white, and finally to yellow. The results suggest that the CIE chromaticity coordinates are tunable with the change in Eu3+ ions concentration.
4. Conclusions
Color tunable white-light emitting BiOCl:Eu3+ nanosheets were successfully synthesized with a facile solvothermal method. BiOCl:Eu3+ nanoparticles were also successfully synthesized by a facile solvothermal method. The thickness and size of the nanoparticles were controlled with PVP. Nanosheets of size around 50–100 nm and thickness of 2.9 nm were formed in the presence of PVP, and nanoplates were formed in its absence. The band gap of the materials also decreased, due to the decrease in the thinness of the particles, and it also further decreased with the Eu3+ ions doping. The BiOCl:Eu3+ ultrathin nanosheets phosphor sample showed higher intensity than the nanoplates sample, due to the formation of oxygen vacancies. The nanosheets sample showed white-light emission, due to the combined emission from the host and the dopant ions. Importantly, these BiOCl:Eu3+ ultrathin nanosheets phosphors showed color-tunable emissions, due to the energy transfer from the BiOCl host to Eu3+ ions and the oxygen vacancies. The tunable color-emitting ultrathin BiOCl:Eu3+ phosphors exhibit potential as a kind of phosphor-converted materials for NUV white LEDs.Acknowledgements
This research was supported by the Basic Science Research Program through the National Research Foundation of Korea (NRF), funded by the Ministry of Education (No. 2014R1A1A2058415, No. 2015R1D1A1A01058991, and No. 2016R1A6A03012877).Notes and references
- B. Radisavljevic, A. Radenovic, J. Brivio, V. Giacometti and A. Kis, Nat. Nanotechnol., 2011, 6, 147–150 CrossRef CAS PubMed
.
- Y. W. Zhu, S. T. Murali, M. D. Stoller, K. J. Ganesh, W. W. Cai, P. J. Ferreira and A. Pirkle, Science, 2011, 332, 1537–1541 CrossRef CAS PubMed
.
- K. S. Novoselov, A. K. Geim, S. V. Morozov, D. Jiang, Y. Zhang, S. V. Dubonos, I. V. Grigorieva and A. A. Firsov, Science, 2004, 306, 666–669 CrossRef CAS PubMed
.
- K. S. Novoselov, D. Jiang, F. Schedin, T. J. Booth, V. V. Khotkevich, S. V. Morozov and A. K. Geim, Proc. Natl. Acad. Sci. U. S. A., 2005, 102, 10451–10453 CrossRef CAS PubMed
.
- S. Bae, H. Kim, Y. Lee, X. Xu, J. S. Park and Y. Zhang, Nat. Nanotechnol., 2010, 5, 574–578 CrossRef CAS PubMed
.
- A. Pospischil, M. M. Furchi and T. Mueller, Nat. Nanotechnol., 2014, 9, 257–261 CrossRef CAS PubMed
.
- X. Zang, Q. Chen, P. Li, Y. He, X. Li and M. Zhu, Small, 2014, 10, 2583–2588 CrossRef CAS PubMed
.
- R. Ganatra and Q. Zhang, ACS Nano, 2014, 8, 4074–4099 CrossRef CAS PubMed
.
- X. Li, X. Zang, X. Li, M. Zhu, Q. Chen, K. L. Wang, M. L. Zhong, J. Q. Wei, D. H. Wu and H. W. Zhu, Adv. Energy Mater., 2014, 4, 1400224 CrossRef
.
- K. F. Mak, C. G. Lee, J. Hone, J. Shan and T. F. Heinz, Phys. Rev. Lett., 2010, 105, 136805 CrossRef PubMed
.
- C. O. Tadashi, F. Katsutoshi, A. Kosho, E. Yasuo, S. Takayoshi, K. Keiji and K. Kosuke, J. Phys. Chem. C, 2008, 112, 17115–17120 Search PubMed
.
- C. O. Tadashi, F. Katsutoshi, A. Kosho, E. Yasuo and S. Takayoshi, Chem. Mater., 2007, 19, 6575–6580 CrossRef
.
- G. L. Frey, K. J. Reynolds and R. H. Friend, Adv. Mater., 2002, 14, 265–268 CrossRef CAS
.
- S. J. Wu, C. Wang, Y. F. Cui, T. M. Wang, B. B. Huang, X. X. Zhang and X. Y. Qin, Mater. Lett., 2010, 64, 115–118 CrossRef CAS
.
- G. G. Briand and N. Burford, Chem. Rev., 1999, 99, 2601–2658 CrossRef CAS PubMed
.
- N. Kijima, K. Matano, M. Saito, T. Oikawa, T. Konishi, H. Yasuda, T. Sato and Y. Yoshimura, Appl. Catal., A, 2001, 206, 237–244 CrossRef CAS
.
- X. Zhang, Z. Ai, F. Jia and L. Zhang, J. Phys. Chem. C, 2008, 112, 747–753 CAS
.
- Z. Deng, D. Chen, B. Peng and F. Tang, Cryst. Growth Des., 2008, 8, 2995–3003 CAS
.
- K. Zhang, J. Liang, S. Wang, J. Liu, K. Ren, X. Zheng, H. Luo, Y. Peng, X. Zou, X. Bo, J. Li and X. Yu, Cryst. Growth Des., 2011, 12, 793–803 Search PubMed
.
- L. Chen, R. Huang, M. Xiong, Q. Yuan, J. He, J. Jia, M. Y. Yao, S. L. Luo, C. Au and S. F. Yin, Inorg. Chem., 2013, 52, 11118–11125 CrossRef CAS PubMed
.
- Y. Lei, G. Wang, S. S. Fan and W. Zhang, CrystEngComm, 2009, 11, 1857–1862 RSC
.
- H. Yamashita and H. X. Li, Nanostructured Photocatalysts: Adv. Funct. Mater., 2016, vol. 333 Search PubMed
.
- Y. J. Li, Z. Y. Zhao, Z. G. Song, R. H. Wan, J. B. Qiu and Z. W. Yang, J. Am. Ceram. Soc., 2015, 98, 2170–2176 CrossRef CAS
.
- D. Peng and S. Y. Jae, Mater. Lett., 2016, 169, 135–139 CrossRef
.
- D. Armita, S. Shyam, N. K. B. V. Adusumalli and V. Mahalingam, Langmuir, 2014, 30, 1401–1409 CrossRef PubMed
.
- Y. Y. Guo, Z. J. Zhang, G. Q. Zhu and W. Yang, Appl. Surf. Sci., 2016, 388, 345–351 CrossRef CAS
.
- M. L. Guan, C. Xiao, J. Zhang, S. J. Fan, R. An, Q. M. Cheng and Y. Xie, J. Am. Chem. Soc., 2013, 135, 10411–10417 CrossRef CAS PubMed
.
- J. Yi and Z. Y. Zhao, J. Lumin., 2014, 156, 205–211 CrossRef CAS
.
- Z. Y. Zhao and W. W. Dai, Inorg. Chem., 2014, 53, 13001–13011 CrossRef CAS PubMed
.
- L. Q. Ye, X. L. Jin, Y. M. Leng, Y. R. Su, H. Q. Xie and C. Liu, J. Power Sources, 2015, 293, 409–415 CrossRef CAS
.
- R. D. Shannon, Acta Crystallogr., Sect. A: Cryst. Phys., Diffr., Theor. Gen. Crystallogr., 1976, 32, 751–767 CrossRef
.
- I. V. B. Maggay, P. C. Lin and W. R. Liu, J. Solid State Light., 2014, 1, 13–27 CrossRef
.
- Z. T. Deng, F. Q. Tang, D. Chen, X. W. Meng, L. Cao and B. S. Zou, J. Phys. Chem. B, 2006, 110, 18225–18230 CrossRef CAS PubMed
.
- Z. T. Deng, D. Chen, B. Peng and F. Q. Tang, Cryst. Growth Des., 2008, 8, 2995–3003 CAS
.
- M. Li, R. M. Wang, J. Y. Zhang, H. Gao, F. Li, S. J. Lindquist and N. Q. Wu, ACS Appl. Mater. Interfaces, 2016, 8, 6662–6668 CAS
.
- J. R. Jin, Y. J. Wang and T. He, RSC Adv., 2015, 5, 100244–100250 RSC
.
- L. Ye, L. Zan, L. Tian, T. Peng and J. Zhang, Chem. Commun., 2011, 47, 6951–6953 RSC
.
- K. Zhao, L. J. Zhang, Q. L. Wang, W. He and J. J. Yin, J. Am. Chem. Soc., 2013, 135, 15750–15753 CrossRef CAS PubMed
.
- Y. H. Wu, B. Yuan, M. R. Li, W. H. Zhang, Y. Liu and C. Li, Chem. Sci., 2015, 6, 1873–1878 RSC
.
- J. Wang, W. J. Jiang, D. Liu, Z. Wei and Y. F. Zhu, Appl. Catal., B, 2015, 306, 176–177 Search PubMed
.
- J. Xu, Y. R. Teng and F. Teng, Sci. Rep., 2016, 6, 32457 CrossRef CAS PubMed
.
- A. A. Dakhel, J. Mater. Sci., 2011, 46, 1455–1461 CrossRef CAS
.
- M. Y. Guo, A. M. C. Ng, F. Z. Liu, A. B. Djurisic, W. K. Chan, H. M. Su and K. S. Wong, J. Phys. Chem. C, 2011, 115, 11095–11101 CAS
.
- J. P. Wang, Z. Y. Wang, B. B. Huang, Y. D. Ma, Y. Y. Liu, X. Y. Qin, X. Y. Zhang and Y. Dai, ACS Appl. Mater. Interfaces, 2012, 4, 4024–4030 CAS
.
- K. G. Santosh, P. S. Ghosh, M. Sahu, K. Bhattacharyya, R. Tewari and V. Natarajan, RSC Adv., 2015, 5, 58832–58842 RSC
.
- G. Blasse, Phys. Lett. A, 1968, 28, 444–453 CrossRef CAS
.
- Z. G. Xia, R. S. Liu, K. W. Huang and V. Drozd, J. Mater. Chem., 2012, 22, 15183–15189 RSC
.
- D. L. Dexter, J. Chem. Phys., 1953, 21, 836–850 CrossRef CAS
.
- T. Aitasalo, P. Deren, J. Holsa, H. Jungner, J. C. Krupa, M. I. Lastusaar, J. Legendziewicz and J. W. Niittykoski, J. Solid State Chem., 2003, 171, 114–122 CrossRef CAS
.
Footnote |
| † Electronic supplementary information (ESI) available. See DOI: 10.1039/c6ra26310k |
| This journal is © The Royal Society of Chemistry 2017 |

