 Open Access Article
Creative Commons Attribution 3.0 Unported Licence
DNA intercalators as amyloid assembly modulators: mechanistic insights†
Jasdeep Singh,
Ankit Srivastava,
Pankaj Sharma,
Prashant Pradhan and
Bishwajit Kundu *
*
Kusuma School of Biological Sciences, Indian Institute of Technology Delhi, New Delhi, India. E-mail: bkundu@bioschool.iitd.ac.in
First published on 3rd January 2017
Abstract
Amyloid assemblies are stabilized through inter-molecular H-bonding with initial structural organizations governed by extensive hydrophobic and π-stacking interactions. Apparently, the structural integrity and stability of DNA duplexes are also governed by a cooperative balance of similar interactions. Structural perturbations in both amyloids and DNA by planar molecules or intercalators essentially rely on their ability to interfere with this balance. However, poor information on amyloid interference mechanisms by intercalators has subjected researchers to undertake random trials with such anti-amyloidogenic agents. Here, we employed four different classes of DNA intercalators to investigate if their non-native, hetero-aromatic associations could modulate the amyloid aggregation pathway. We utilized micro-second scale MD simulations using the steric-zipper structure of the diabetes associated amylin fragment to identify such associations and their plausible role in subjugating higher order assemblies. The simulation estimates were experimentally validated and extended to other disease-associated amyloid systems including gelsolin, prion and lysozyme. We find that the intercalators essentially stabilize monomeric and prefibrillar assemblies, reducing their ability to transform into structured supramolecular structures. Our results conclusively establish the dominant role of aromatic-associations in diverting the course of the amyloid assembly process at the expense of stabilizing H-bonding networks. Overall this report presents comprehensive experimental and theoretical insights on the regulation of amyloidogenesis by aromatic planar moieties.
Introduction
Amyloids represent fibrillar, intractable protein aggregates, the deposition of which in tissues causes a multitude of pathological complications including fatal neurodegenerative disorders such as Alzheimer's, Huntington's and Creutzfeldt Jakob diseases.1–4 Regardless of origin, sequence or native structure, amyloid aggregates share common cross-β spine architectures, primarily stabilized through inter-molecular hydrogen bond networks.5,6 Amyloidogenesis involves the destabilization of native protein architecture to form partially unfolded ensembles that attain rogue β-rich, oligomeric protofibrillar conformations.7,8 Self-association of protofibrillar intermediates terminates in ordered mature amyloid fibrils.9,10 Protofibrillar oligomer intermediates represent the central players in amyloidogenesis and amyloidosis. Structurally, they comprise fundamental elements for fibril elongation (‘on pathway ‘intermediates)11,12 and pathologically, account for amyloid related cytotoxicities owing to their interaction with cellular membranes.13,14Transition of native monomers to protofibrillar intermediates depends on specific free surfaces formed by aggregation prone regions of proteins.15–17 These surfaces are defined through the intrinsic hydrophobicity, secondary structural propensities, and electrostatic nature of the constituent residues. The transitions along the aggregation pathway stem from complex interplay among these interactions in driving the assembly process. Amongst these interactions, recent literature on in vitro as well as in silico fibrillation of amyloidogenic regions from human islet amyloid polypeptide (IAP) projects synergistic role of π-stacking interactions, mediated through aromatic Phe's in the assembly process.18–21
Similarly from the structural perspective, integrity and organization of DNA polymer rely on subtle balance of similar stabilizing H-bond and π-stacking interactions.22,23 Consequently, various planar molecules/compounds/drugs which are known to interact and modulate DNA structure have been tested for their anti-amyloidogenic potential.24–26 The best known drugs of this class included two FDA approved DNA intercalators, 4′-iodo-4′-deoxydoxorubicin for systemic amyloidosis27,28 and mitoxantrone/picoxantrone against Aβ (1–42) fibrillation.29,30 Traditionally, these compounds comprise simple class of planar organic molecules capable of modulating genetic and epigenetic expression via stacking in between adjacent base pairs of DNA.31–33 These interactions are specifically driven by pi stacking between the electron clouds of coplanar bases and the intercalators.34,35 Primarily hydrophobic interactions and beta sheet propensities have been proposed as main driving force during amyloid assembly.5,16 However, the finding that DNA intercalators like doxorubicin/mitoxantrone act as amyloid inhibitor warrants investigation of the balance between hydrophobic/beta-sheet propensities vs. aromatic interactions in driving amyloid assembly. In other words, whether the anti-amyloidogenic effect of the intercalators is due to their ability to favour non-amyloid (‘off-pathway’) intermediates through competitive “aromatic-associations” is yet to be proven.21,25
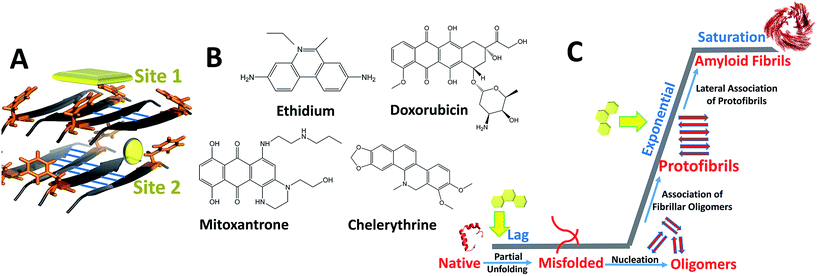
Bridging the previously reported evidences, we hypothesize dominant role of hetero-aromatic associations in modulating amyloid aggregation pathways. During initial phases, such associations could interfere with inter-molecular interactions, obviating organization of native monomers to ‘on-pathway’ amyloid intermediates while driving the process towards ‘off-pathway’ intermediates. Additionally, such associations could also interfere with lateral assembly of protofibrillar intermediates, originally facilitated through π-associations, thereby impeding their progression to mature fibrils.36,37 Amyloid assembly in case of PolyQ is an exception as charge interactions appears to play dominant role. However, inhibition by EGCG by virtue of its hydrophobic/H-bond interactions requires thorough investigation behind its mechanism of action. To comprehensively understand the role of hetero-aromatic associations to interfere with the amyloidogenic pathways, we designed this current study by employing the pre-fibrillar structural coordinates of IAP amyloid-core containing sequence (NFGAILS), IAP (22–28) as our model system (Fig. 1). The choice of this system serves dual advantages in terms of Phe-23 mediated assembly formation18,38 and in pre-availability of atomic coordinates of supramolecular amyloid assembly of IAP (22–28).39 Thus, the entire reaction pathway for IAP (22–28) aggregation and in process interference mechanisms by planar compounds can be mapped though strategic simulation of its aggregation pathway.
For our studies we employed four different DNA intercalators: synthetic molecule, ethidium bromide (EtBr); natural alkaloid chelerythrine (Chl); and two FDA approved anti-cancer drugs viz., doxorubicin (Dxr) and mitoxantrone (Mtx). Aggregation of IAP (22–28) was probed in the presence and absence of these intercalators by molecular dynamics simulations. Furthermore, the study was extended to investigate the effect of these compounds on the pre-formed protofibril assembly of IAP (22–28). To validate computational outcomes, this hetero-molecular landscape was replicated in vitro through spectroscopic approaches with visualization using electron microscopy. To eliminate selection bias towards IAP (22–28) model system, we employed three additional assorted systems, gelsolin peptide fragment (GNCFILD) from D187N disease mutant of gelsolin protein (AGel (186–192)) and other amyloidogenic proteins viz. lysozyme (Lys) and human prion protein (PrP). Gelsolin fragments and its mutations are associated with familial amyloidosis of Finnish type,40 lysozyme in senile amyloidosis41 and prion aggregation in transmissible spongiform encephalopathies.42 Dissecting through diverse biophysical and visualization approaches on the same systems, our findings attempts to illustrate and correlate in silico landscapes with experimental estimates.
Results
Intercalators interrupt structural transitions into higher order assemblies
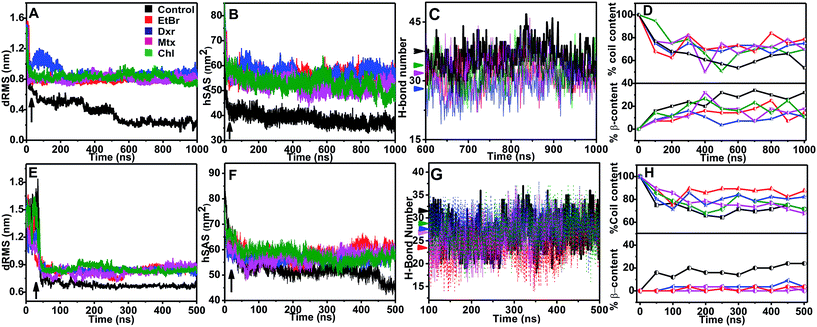
Molecular dynamic trajectories for each system were analyzed by distinct approaches. The amyloid modulatory function of intercalators was established by comparing the resultant trajectories over six variables: root mean square deviation in distance between Cα atoms of peptides (dRMS), hydrophobic solvent accessible surface area of side chains (hSAS), backbone secondary structure contents (SS), H-bond number (HBN), matrix of least distance between pair of residues (MLDR) and finally by free energy landscape (FEL) of aggregation pathways (Fig. 2 and 3). In our simulations the aggregates formed by IAP (22–28) and AGel (186–192) monomers in the absence of intercalators served as controls while the octameric protofibrillar assembly of IAP (22–28) and AGel (186–192) served as reference frames for respective systems (discussed in Materials and methodologies).Aggregation landscape of IAP (22–28)
The fully ordered octameric protofibril like assembly (2kib) possesses nearly 70% residues with high propensity for extended conformation.45 In our study, we observed a progressive increase in the beta sheet content with a concomitant decline in coil content in the control samples (∼35% increase and ∼50% decrease respectively, Fig. 2D). In the presence of intercalators, the aggregates displayed an overall higher random conformation for majority of residues, thus exhibiting a strong structural disorder. Apart from intrinsic hydrophobicity and β-sheet propensities, IAP (22–28) aggregation pathway had been shown to be driven by homo-aromatic associations among its Phe-23 residues.18 Therefore, we speculated subsistence of hetero-aromatic associations between Phe-23 and planar compounds driving the pathway towards non-amyloid assemblies. The MLDRs constructed between Phe-23 and test compounds for each system averaged over final 600 ns of trajectory showed persistent hetero-aromatic associations (ESI Fig. 3B–3E†). Converging the clues from H-bond patterns, β-content evolution and hetero-aromatic associations, we confirmed that intercalators had deviated aggregation of IAP (22–28) to non-amyloid assemblies, putatively incapable of organizing into higher order amyloid like assemblies.
Aggregation landscape of AGel (186–192)
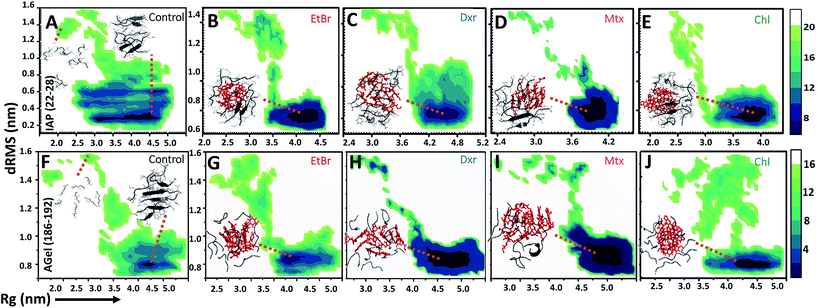
The influence of intercalators was further investigated on aggregation landscape of AGel (186–192). Here, moderate disparity in dRMS, hSAS and HBN was observed between the control and the test samples (Fig. 2E–H). The average β-sheet content in control systems progressively escalated with 25% of residues involved in forming in-register beta arrangement. In the presence of intercalators, each system failed to organize into β-rich aggregates throughout the simulation (Fig. 2H). Respective MLDRs showed that fraction of native contacts were subsided by intercalators compared to control (ESI Fig. 4†). The employed intercalators similarly displayed hetero-aromatic associations with Phe residues of AGel (186–192) monomers along the reaction pathway (ESI Fig. 5†). The most stable conformations during aggregation pathways were projected as function of Rg and dRMS variations with respect to reference structure. The FEL of control system displayed spontaneous assembly of monomers, without the accumulation of intermediate states; to yield β-rich aggregates (Fig. 3F). The corresponding lowest energy conformations were confined to narrow basin, possessing higher Rg (3.1 nm) compared to the reference (Rg ∼ 2.5 nm). A notable finding on extracting structures from the coordinates of basin was formation of predominantly single layer heterogeneous and in-register fibril assembly resulting in higher Rg than reference structure (double layer oligomer). Expectedly, the intercalators induced more disorder in the packing arrangement of monomers (Rg ∼ 4.5–5 nm, Fig. 3G–J) suggesting their integration within the monomeric units as seen in the IAP (22–28) simulations.Intercalators remodel protofibrillar assembly
In order to assess if the intercalators could perturb the conformational integrity of pre-formed amyloid like ensembles, we carried out studies on protofibril like assembly of IAP (22–28). Initial docking studies through MOE showed two high propensity ligand binding sites (site 1 and 2, Fig. 1A) on assembly which showed comparable binding affinities (ESI Table 1†), hinting towards the probability of concurrent binding at both sites. As a result, unbiased systems were setup to follow unrestrained protofibril-intercalator dynamics (ESI Fig. 1B†).Variations in dRMS, hSAS and Rg
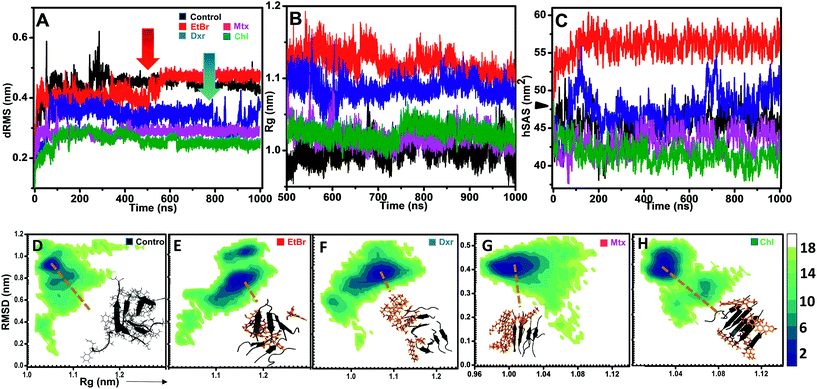
The effects of compounds on fibril assembly were determined in terms of comparative dRMS, hSAS and the overall structural changes in assembly (Rg) (Fig. 4). Control setup represented fibril assembly alone which showed progressive increase in dRMS, stabilizing near 0.45 Å post 400 ns simulation (Fig. 4A). This could be attributed to non-inclusion of dihedral constrains in these simulations, resulting in bending and twisting of protofibril assembly along its longitudinal axis. However, in the presence of EtBr and Dxr, the fibril assembly showed rapid fluctuations in dRMS around 550 ns and 850 ns respectively (Fig. 4A). The effect was more pronounced in the presence of EtBr where dRMS escalated to ∼0.5 Å, comparably higher than control setup. Contrastingly, these fluctuations were completely absent in the presence of Mtx/Chl which displayed considerably lower dRMS (∼0.3 Å) over entire trajectory indicating interactions primarily confined to fibril surface (site 1), thus restricting bending and twisting of fibrils. However, the interactions also resulted in slight unpacking of the assembly, indicated through Rg variations collected during last 500 ns of simulation period. Association of EtBr molecules with the assembly resulted in modulating fibril packing, indicated through comparatively high gyration radius (Rg) than control and in the presence of other intercalators (Fig. 4B). Furthermore, the much pronounced destabilization effects of EtBr on IAP (22–28) assembly were evident through concurrent solvation of hydrophobic core residues (Fig. 4C). Dxr exerted mild solvation of the residues, only towards the end of simulation in accord with its dRMS fluctuations. Interestingly, Mtx and Chl facilitate sidechain packing of hydrophobic residues as observed by lower hSAS than control, contributing to higher percentage burial.Hetero-aromatic associations and free-energy landscapes
In addition to H-bonding network, we found that hetero-aromatic associations between Phe residues of monomers and planar hydrophobic moiety of intercalators also played a crucial role. In control, unusual homo associations between Phe 7 and 8 and Phe 6 and 5 were observed (ESI Fig. 6†), possibly arising due to twisting and bending. Interestingly, EtBr completely hindered such homo aromatic associations and fostered hetero-aromatic associations through its phenanthridinium moiety. Each EtBr molecule displayed association not only with exposed Phe's (2, 4, 6 and 8) at fibril surface but also with Phe's (1, 3, 5 and 7) at site 2. Unlike EtBr, hetero-aromatic associations with other intercalators were less pronounced (ESI Fig. 6B†).The influence of intercalators on the structural remodeling of pre-formed protofibrils into energetically favorable conformation was assessed by constructing FEL's. Fig. 4D shows projections of control assembly in the conformational space as function of Rg and backbone RMSD. The energetically favorable ensembles were confined to narrow conformational space, corresponding to compact (Rg 1.05 nm) twisted assembly. In the presence of EtBr and Dxr, the conformational space drifted towards partially condensed states (Fig. 4E and F). The preferred lowest energy conformations in the presence of EtBr represented assemblies with higher gyration radius (Rg 1.17 nm) with phenanthridinium rings intercalated at site 2. Dxr induced mild deviations in packing of assembly (Rg 1.08 nm), attributed to engagement of single Dxr molecule at site 2 through its methyloxan unit while other Dxr molecules were bound at site 1. Notably, no such drift in acquired conformational space was observed for assembly in the presence Mtx and Chl, where binding was observed at site 1 alone (Fig. 4G and H). The lowest energy conformations corresponded to control-like compact assembly (Rg ∼ 1.01 nm), although in these cases minimum disorder was induced in fibrils.
Molecular docking of intercalators to Lys and PrP
In Lys, preferred binding cavity for benzophenanthridine alkaloids and Chl had already been reported previously.46 Interestingly, cluster analysis of binding poses post docking of other intercalators also displayed same preferred site for binding (ESI Fig. 8A†). For PrP, binding of intercalators were not restricted to a single fold as seen for Lys. We observed highest binding poses at different sites (α2 and α3 helices) of PrP (ESI Fig. 8B†). The highest docking free energies (kcal mol−1) for binding of intercalators to Lys and PrP are summarized in ESI Table 2.†Biophysical characterization of modulatory effects of intercalators
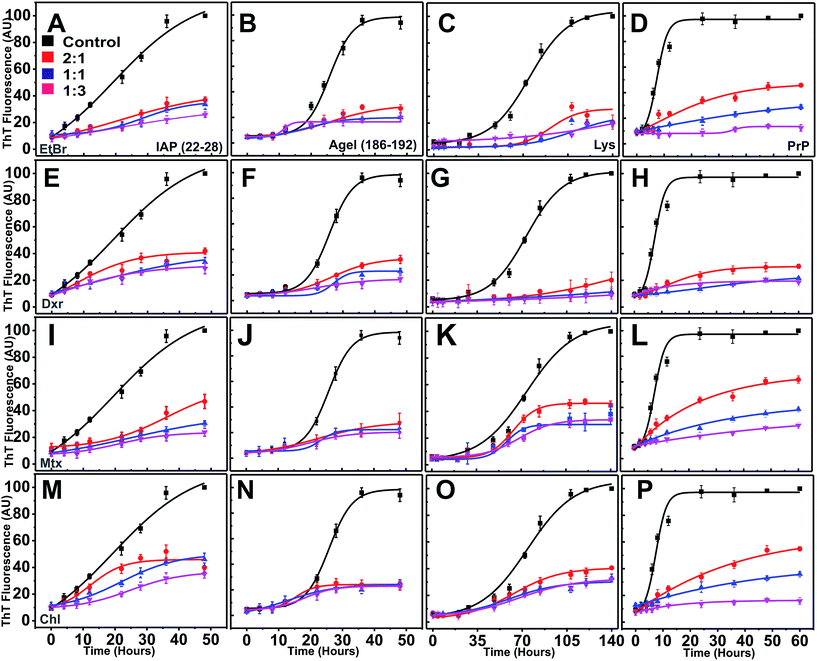
Motivated by the simulation estimates, we further extended our investigations to validate efficacy of intercalators against aggregation of IAP (22–28) to structured intermediates and modulation of its protofibril assembly through real-time in vitro aggregation assays. We were equally interested in testing if our computational estimates are generic in nature. This is important, since conformational transition of protein systems to their amyloid states rely on traversing through various kinetic and thermodynamic barriers, unlike in peptide systems where direct contributions from local interactions govern their spontaneous aggregation. The simulation predictions on interference mechanisms were also extended to experimental investigations against full length proteins, Lys and PrP. In all cases, the kinetics of amyloid formation was monitored using standard thioflavin T (ThT) fluorescence and static light scattering experiments (SLS).Intercalators inhibit transitions of monomers to structured assemblies
ThT fluorescence exhibits a hyperchromic shift in emission maximum upon binding to β-rich fibrillar structures during amyloidogenesis.37,47,48 Traversing from lag and exponential to stationary phase, amyloidogenesis generally follows sigmoidal kinetics.49,50 In our case, reactions of proteins/peptides were prepared in the presence (increasing molar equivalents) and absence of compounds and were subjected to amyloid aggregation.Under given aggregating conditions, all the four peptides/proteins showed gradual increase in ThT fluorescence over reaction periods (Fig. 5). In controls sets, the ThT fluorescence showed distinct lag phases of different duration (ESI Table 3†), with shortest observed for PrP.
Interestingly, in the presence of intercalators (regardless of the type), ThT yields remained persistently low at all ratios (2![[thin space (1/6-em)]](https://www.rsc.org/images/entities/char_2009.gif) :
:![[thin space (1/6-em)]](https://www.rsc.org/images/entities/char_2009.gif) 1, 1
1, 1![[thin space (1/6-em)]](https://www.rsc.org/images/entities/char_2009.gif) :
:![[thin space (1/6-em)]](https://www.rsc.org/images/entities/char_2009.gif) 1 and 1
1 and 1![[thin space (1/6-em)]](https://www.rsc.org/images/entities/char_2009.gif) :
:![[thin space (1/6-em)]](https://www.rsc.org/images/entities/char_2009.gif) 3) throughout the reaction time (Fig. 5E–P). ThT intensities failed to escalate exponentially (low Imax, maximum ThT intensity) suggesting total inhibition of nucleation dependent polymerization in a dose dependent manner (ESI Table 3†).
3) throughout the reaction time (Fig. 5E–P). ThT intensities failed to escalate exponentially (low Imax, maximum ThT intensity) suggesting total inhibition of nucleation dependent polymerization in a dose dependent manner (ESI Table 3†).
Interestingly, scattering for peptide-intercalator systems at lowest molar ratio (2![[thin space (1/6-em)]](https://www.rsc.org/images/entities/char_2009.gif) :
:![[thin space (1/6-em)]](https://www.rsc.org/images/entities/char_2009.gif) 1) at the end of reaction period was moderately lower (∼20–30%) than corresponding controls, contrary to corresponding ThT yields. This indicated that compounds were effective in preventing formation of fibrillar assemblies (low ThT) by steering the aggregation of monomers towards large unstructured (high scattering) aggregates (ESI Fig. 9†). Accordingly at higher ratios (1
1) at the end of reaction period was moderately lower (∼20–30%) than corresponding controls, contrary to corresponding ThT yields. This indicated that compounds were effective in preventing formation of fibrillar assemblies (low ThT) by steering the aggregation of monomers towards large unstructured (high scattering) aggregates (ESI Fig. 9†). Accordingly at higher ratios (1![[thin space (1/6-em)]](https://www.rsc.org/images/entities/char_2009.gif) :
:![[thin space (1/6-em)]](https://www.rsc.org/images/entities/char_2009.gif) 1 and 1
1 and 1![[thin space (1/6-em)]](https://www.rsc.org/images/entities/char_2009.gif) :
:![[thin space (1/6-em)]](https://www.rsc.org/images/entities/char_2009.gif) 3), the systems displayed even lower scattering. The inhibitory control over the aggregation of peptide/protein monomers to fibrillar assemblies was established through TEM images of same systems where no fibrillar assemblies were observed (Fig. 6).
3), the systems displayed even lower scattering. The inhibitory control over the aggregation of peptide/protein monomers to fibrillar assemblies was established through TEM images of same systems where no fibrillar assemblies were observed (Fig. 6).
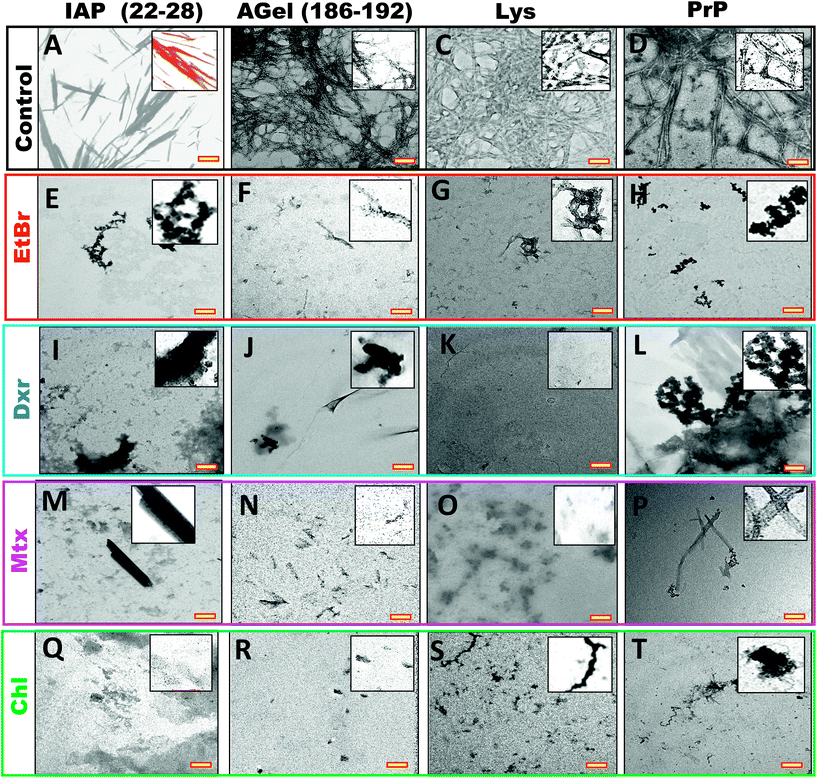 | ||
Fig. 6 TEM images of same systems in Fig. 7 (at 2![[thin space (1/6-em)]](https://www.rsc.org/images/entities/char_2009.gif) : :![[thin space (1/6-em)]](https://www.rsc.org/images/entities/char_2009.gif) 1 ratio), processed after 4 hours of their completion. End stage aggregates from fibrillation of IAP (22–28), AGel (186–192), Lys and PrP alone (A–D) and assembly process in the presence of EtBr, Dxr, Mtx and Chl (E–T). All intercalators showed complete inhibition of fibrillation independent of peptide/protein system. Scale bars (yellow insets) are 500 nm. Insets show magnified version of the sample. 1 ratio), processed after 4 hours of their completion. End stage aggregates from fibrillation of IAP (22–28), AGel (186–192), Lys and PrP alone (A–D) and assembly process in the presence of EtBr, Dxr, Mtx and Chl (E–T). All intercalators showed complete inhibition of fibrillation independent of peptide/protein system. Scale bars (yellow insets) are 500 nm. Insets show magnified version of the sample. | ||
Intercalators arrest protofibrillar progression into mature fibrils
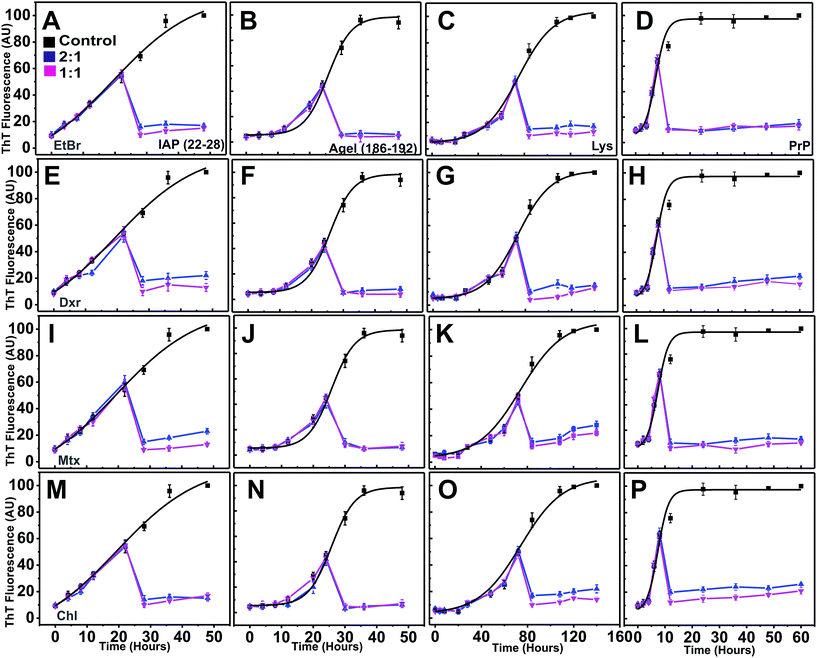
To validate our in silico predictions of inhibitory control of intercalators over the progression of aggregation pathway from pre-formed protofibrillar oligomers, the compounds were co-incubated independently at the mid-point of the exponential phases of individual systems (after 22 hours for IAP (22–28), 25 hours for AGel (186–192), 70 hours for Lys and 10 hours for PrP). Immediately after addition, the ThT intensity declined drastically to basal levels (Fig. 7). However, when the corresponding scattering profiles were analyzed, only marginal drop in intensities were observed (ESI Fig. 10†). After incubation with intercalators at this point, scattering of each system (at 2![[thin space (1/6-em)]](https://www.rsc.org/images/entities/char_2009.gif) :
:![[thin space (1/6-em)]](https://www.rsc.org/images/entities/char_2009.gif) 1) failed to rise proportionally compared to controls and was nearly stagnant till the end of reaction period. This clearly suggested that intercalators obviated further assembly of protofibrillar oligomers to mature fibrils, thus arresting the pathway in a protofibrillar state. TEM images of these systems at the end of aggregation further confirmed the presence of protofibrillar species and absence of mature fibrils (ESI Fig. 11†).
1) failed to rise proportionally compared to controls and was nearly stagnant till the end of reaction period. This clearly suggested that intercalators obviated further assembly of protofibrillar oligomers to mature fibrils, thus arresting the pathway in a protofibrillar state. TEM images of these systems at the end of aggregation further confirmed the presence of protofibrillar species and absence of mature fibrils (ESI Fig. 11†).
Binding of intercalators marginally affects secondary and tertiary structure stability
Proteins may undergo structural changes upon exposure to exogenous factors as temperature, solvent environment which could result in alternate conformational states.10,51 For Lys and PrP, the observed anti-amyloidogenic effects could be attributed to induced local secondary or tertiary structure perturbations by intercalators. Thus, we tried to assess the effect of compounds on their native secondary and tertiary structures. In both proteins, steady state fluorescence titration with compounds (ESI Fig. 12A–H†) showed no apparent shifts around λ340 indicative of unaltered tertiary architecture. In Lys, secondary structural transitions were also absent, as indicated by overlapping CD spectra at all ratios (ESI Fig. 12I–L†). However, association of intercalators slightly induced secondary structure perturbations in PrP (ESI Fig. 12M–8P†). Thermal melting studies of control and test systems (2![[thin space (1/6-em)]](https://www.rsc.org/images/entities/char_2009.gif) :
:![[thin space (1/6-em)]](https://www.rsc.org/images/entities/char_2009.gif) 1 [P]/[D]) by monitoring λ340 and θ222 as function of temperature resulted in overlapping denaturation profiles (ESI Fig. 13A–D†). However, Tm calculated through first derivative in the presence of intercalators showed slight shift towards higher temperatures (2–3 °C) for tertiary structure transitions in Lys and PrP. For secondary structure transitions in PrP, Tm shifted slightly towards lower temperature (5–6 °C) compared to control in accord with induced secondary structure perturbations while it remained unaltered for Lys.
1 [P]/[D]) by monitoring λ340 and θ222 as function of temperature resulted in overlapping denaturation profiles (ESI Fig. 13A–D†). However, Tm calculated through first derivative in the presence of intercalators showed slight shift towards higher temperatures (2–3 °C) for tertiary structure transitions in Lys and PrP. For secondary structure transitions in PrP, Tm shifted slightly towards lower temperature (5–6 °C) compared to control in accord with induced secondary structure perturbations while it remained unaltered for Lys.
Intercalators specifically bind to monomeric/native peptides/proteins
Furthermore, it became essential to ascertain if different intercalators could actually bind to peptides/proteins. Association of intercalators to the aggregation prone regions (fully accessible in peptides while partially in proteins) could directly or indirectly modulate their aggregation pathway by possibly blocking inter-molecular interaction sites.46 Fluorimetric titrations of intercalators with peptide/proteins provided clues on changes in microspace of intercalators upon association with monomers. Titration curves for each system are shown in ESI Fig. 14.† The dissociation constants for each system are summarized in ESI Table 4.† Micromolar range dissociation constants indicated strong association of intercalators to peptide/protein monomers resulting in strong PD complexes, putatively incapable of organizing into higher order structural aggregates.Association of intercalators with pre-formed fibrils
The intercalators could arrest protofibrillar progression when added during exponential growth phase of each system indicating strong association between intercalators and protofibrils. Similar experiments were carried to verify the association between intercalators and fibrils of peptides/proteins. Both hypo- and hyperchromic shifts in the fluorescence yield were visible for different compounds when titrated with corresponding pre-formed fibrils. Each trend represents distinct changes in the micro space of intercalators upon interacting with fibril assembly. Titration curves for each system were plotted as above (ESI Fig. 15†) and the dissociation constants are presented in ESI Table 5.†Discussions
The application of many planar molecules has been extended as amyloid inhibitors where some of these molecules are proven to reduce associated toxicities.28,29 In our study, we have attempted to gain insights into interference mechanisms of intercalators with the aggregation pathways of peptides and proteins, specifically emphasizing and establishing the role of hetero-aromatic associations.Spontaneous aggregation of peptide monomers from IAP and gelsolin proteins to form structurally heterogeneous assemblies was established using μs explicit solvent simulations. The simulation results agreed to initial dependency on solvation free energy of IAP (22–28) and AGel (186–192) monomers owing to high hydrophobicity (of 75% and 62% residues respectively)45 to form initial collapsed state. Further optimal structural reorganizations to partially structured species during the downhill process were reflected through incessant decline in dRMS with high increment in β-content during later stages of simulation. These observations complied with earlier experimental and theoretical reports documented on aggregation of short peptides.18,20,43,44,52 FEL projections indicated spontaneous association of monomers to form higher order ensembles whereas an early single large basin was observed in FEL of IAP (22–28) and AGel (186–192) monomeric transitions into assembly in the presence of intercalators. Apparently, the kinetics of assembly formation in the presence of compounds was driven further owing to some topological advantage imparted by their planar groups. However, extraction of corresponding lowest energy conformation showed improper packing of monomers, terminating in non-amyloid oligomeric assemblies. Consequently, loss of inter-chain contacts was compensated by subsequent concurrent contacts between monomers and compounds, particularly the stable hetero-aromatic associations with Phe residues. Binding poses of stable complexes obtained at the end of simulations clearly displayed hetero-aromatic associations between Phe's and planar groups of the compounds (ESI Fig. 7A–D†). Since the compounds spend most of the simulation period in associations with some Phe residues and their self-association, such hetero-aromatic associations could be accounted for modulation of aggregation pathways.
In vitro substantiation of simulation outcomes were highly corroborating and validated incompetency of IAP (22–28) and AGel (186–192) monomers to form β-rich aggregates (ThT insensitive species) in the presence of intercalators. Similarly, emergence of stable disordered aggregates at the end of simulations was highly supported by SLS experiments where the corresponding scattering at 2![[thin space (1/6-em)]](https://www.rsc.org/images/entities/char_2009.gif) :
:![[thin space (1/6-em)]](https://www.rsc.org/images/entities/char_2009.gif) 1 [peptide]/[D] was marginally lower than the respective controls. Binding affinity studies showed that the peptide monomers were initially capable of forming stable (PD) complexes with intercalators. These inhibitory effects were reciprocated by the Lys and PrP as well. We reasoned that having significant binding affinities (μM range), the intercalators may confer additional stabilizing effect to the protein's native structure, resisting their amyloidogenic conversion. However, thermal denaturation studies ruled out this possibility and led us to propose that along the reaction pathway, these intercalators bind to core amyloidogenic regions (directly in case of peptide amyloidogenesis and indirectly after partial unfolding of proteins) and steering the pathway towards amyloid incompetent states.
1 [peptide]/[D] was marginally lower than the respective controls. Binding affinity studies showed that the peptide monomers were initially capable of forming stable (PD) complexes with intercalators. These inhibitory effects were reciprocated by the Lys and PrP as well. We reasoned that having significant binding affinities (μM range), the intercalators may confer additional stabilizing effect to the protein's native structure, resisting their amyloidogenic conversion. However, thermal denaturation studies ruled out this possibility and led us to propose that along the reaction pathway, these intercalators bind to core amyloidogenic regions (directly in case of peptide amyloidogenesis and indirectly after partial unfolding of proteins) and steering the pathway towards amyloid incompetent states.
The observed interference effects of intercalators could be explained by two mechanisms; hetero-association of intercalators with peptide monomers and self-association of intercalators. The hetero-association between intercalators and peptide monomers can occlude the amyloid-like interactions by blocking the potential inter-chain free energy surfaces, crucial for assembly process.53 This was indeed supported through observed low dissociation constants of peptides with intercalators. Furthermore in our simulations, we observed self-association of intercalators with concurrent recruitment of peptide monomers to the opposite end of their assembly, possibly providing stable scaffolds for hetero-molecular interactions. These associations were coherent with previously reported evidences on macromolecule dependent/independent association of ligands.54–59 This super assembly can be represented as monomer–(intercalator)n–monomer, where n represents number of compound monomers involved in self-assembly. Thus, it could be conceived from the observed facts that compounds were capable of intercalating in between monomeric peptides during the association events itself, driving the aggregation pathway towards alternate assemblies, incompetent to form ‘on-pathway’ pre-fibrillar oligomer assembly. On the other hand, in case of Lys, binding preferences of EtBr, Dxr and Mtx also incorporates amyloidogenic stretches which could be directly or indirectly implicated in averting its amyloidogenesis (ESI Fig. 8†). Interestingly, the preferential modes for PrP suggested the possibility of hetero-aromatic interactions with crucial aromatic residues at the α2–α3 helices. The unfolding of these helices have been shown to initiate PrP fibrillogenesis and the intercalators mostly stabilize this crucial tertiary scaffold60 (ESI Fig. 13B†).
The intercalators actively induced remodeling of the pre formed protofibril assembly. From the structural perspective, protofibrils represent basic building units for elongation to mature amyloid fibrils. Coarse grained simulations on IAP (20–29) fibril formation and its elongation, as reported by Sorensen J. et al., depicts these associations mediated through solvent exposed residues at all interfaces, promoting inter molecular contacts with other assemblies in system.53 On the other hand, binding of congo red and phenol red are earlier shown to induce subtle structural changes to the protofibrils formed by the core amyloid stretches of yeast prion protein Sup35 and hIAPP.61,62 However, owing to smaller simulation time scales (20 ns) in these studies, no gross destabilization of protofibrils was observed.
However, in our studies EtBr and Dxr associated with the IAP (22–28) protofibrils both longitudinally and laterally (S1 and S2 sites respectively). These associations induced structural perturbations at later stages of simulations as depicted through higher presentation of hydrophobic side chains to the solvent (Fig. 4C). However, Mtx and Chl interactions were only confined to exposed residues at fibril surface which further resulted in even lower solvent exposure of hydrophobic residues than control, thus potentially blocking the longitudinal interaction sites. Both types of binding could interfere with further assembly of individual protofibrils, resulting in null/stunted fibril growth. Speculations for interference with protofibril elongation in the presence of intercalators were substantially supported by scattering and ThT profiles. The observed stagnancy in scattering after incubation of compounds at time intervals corresponding to dominant protofibril population in all systems (ESI Fig. 10†) strongly indicated towards ‘freezing’ the elongation of protofibrils to mature fibrils. Further, a sharp drop in corresponding ThT yields validated S1 as preferred site for intercalator–fibril interactions that plausibly prevents fibril growth. Recent work on Lys and insulin amyloids63 showed fibril surface as single preferred site for ThT binding, accounting for its enhanced fluorescence upon association. Drawing parallels, ThT molecules would have been incapable of displacing the intercalators from their original binding site resulting in low quantum yields. This was indeed supported by apparently high binding affinities of intercalators with fibril assemblies (ESI Table 4†). The corresponding scattering intensities remained nearly constant till the end of reactions indicating stalling of amyloid progression from protofibrils by the intercalators. The possibility of an artefact arising due to marginal change in scattering in peptide systems is negated by the observance of substantial change in scattering profiles for protein samples.
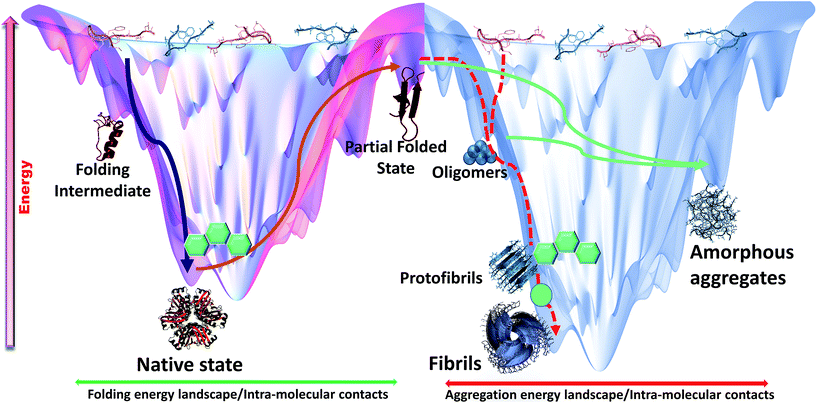
The simulation projections provided important mechanistic insights about interaction and interference of intercalators with amyloidogenic pathways (Fig. 8). Simulation results were conclusively proven through in vitro experiments which suggested dominant inhibitory role of DNA intercalators during amyloid assembly process, facilitated predominantly through aromatic associations with native monomers or along their aggregation process. However, the current approach to gain mechanistic insights could be further supported by parallel replica exchange molecular dynamics (REMD) studies to allow more coverage of conformational space and enhanced sampling efficiency. Recent reports on REMD studies on cross interactions of p53 core fragment and its aggregation rescue mutant64 and of Aβ1–42 and hIAPP1–37 polypeptides65 showed formation of diverse conformational assemblies within given time scale. Such detail might have been overlooked if conventional MD approach is exclusively used. Similarly, it is possible that other potential intermediates and terminal assemblies in the presence of intercalators were missed out when an all-atomistic simulation is used. These unaccounted intermediates further needs to be explored through more extensive computational and experimental validations. Through multi-dimensional approaches, this study attempts to understand complex hetero-molecular landscape underlying anti-amyloid potential of planar molecules studied so far.
Materials and methodologies
Molecular dynamics system and simulations
To obtain binding free energies of compounds with the 2kib assembly, the compounds were initially docked with fibrillar octameric structure at 1![[thin space (1/6-em)]](https://www.rsc.org/images/entities/char_2009.gif) :
:![[thin space (1/6-em)]](https://www.rsc.org/images/entities/char_2009.gif) 1 ratio (octamer assembly
1 ratio (octamer assembly![[thin space (1/6-em)]](https://www.rsc.org/images/entities/char_2009.gif) :
:![[thin space (1/6-em)]](https://www.rsc.org/images/entities/char_2009.gif) compound) by using inbuilt Site Finder application in Molecular Operating Environment v2010.12 (MOE).71 Protocols for site identification and free energy calculations for docking to fibril assembly and proteins are detailed elsewhere.72
compound) by using inbuilt Site Finder application in Molecular Operating Environment v2010.12 (MOE).71 Protocols for site identification and free energy calculations for docking to fibril assembly and proteins are detailed elsewhere.72
For protofibril simulations (1 μs each), studies were restricted to hIAPP (PDB id 2KIB) where its octameric assembly alone was positioned at the center of a box with same dimensions as used earlier. Subsequently, in each separate setup, five molecules of test compounds were positioned randomly in the box. This alternate system was employed to reduce the bias originating from pre-defined conformations of ligand, docked to octamer assembly. Overall, a cumulative of 12.5 μs all atom MD simulations were carried out. Each system was explicitly solvated with appropriate amount of SPC water molecules and ions added to maintain electroneutrality at 0.1 M NaCl concentration equivalent to in vitro system setup for carrying IAP (22–28) and AGel (186–192) amyloidogenesis. Subsequently, post energy minimization of system by steepest descent scheme, 1 ns equilibration using an isothermal–isobaric and isochoric–isothermal ensemble was performed respectively. PME was used to treat long range electrostatics with short range interactions at cutoff radius of 10 Å for both coulomb and van der Waal potentials. System temperature (310 K) and pressure (1 bar) was kept constant using velocity rescale and Berendsen barostat respectively. Finally, the velocities were generated by solving Newton's equations of motion with 2 fs time step using Leap frog integrator. The coordinates were recorded at each 5 ps interval. The resulting trajectories were analyzed by inbuilt gromacs tools while the images were created using PyMol package.73
Chemicals
The IAP (22–28) and AGel (186–192) peptides were custom synthesized and purchased from BioCell Corporation (India) as 99% pure lyophilized powder. Chicken egg-white lysozyme and all chemicals were purchased from Sigma Chemical Co. (St. Louis, MO). Human PrP was purified as per previous reports.74Preparation and characterization of amyloid fibrils
![[thin space (1/6-em)]](https://www.rsc.org/images/entities/char_2009.gif) :
:![[thin space (1/6-em)]](https://www.rsc.org/images/entities/char_2009.gif) compound [D] ratios of 2
compound [D] ratios of 2![[thin space (1/6-em)]](https://www.rsc.org/images/entities/char_2009.gif) :
:![[thin space (1/6-em)]](https://www.rsc.org/images/entities/char_2009.gif) 1, 1
1, 1![[thin space (1/6-em)]](https://www.rsc.org/images/entities/char_2009.gif) :
:![[thin space (1/6-em)]](https://www.rsc.org/images/entities/char_2009.gif) 1 and 1
1 and 1![[thin space (1/6-em)]](https://www.rsc.org/images/entities/char_2009.gif) :
:![[thin space (1/6-em)]](https://www.rsc.org/images/entities/char_2009.gif) 3 and monitored for ThT fluorescence. For assessing the effect of compounds on pre-formed protofibrils, compounds were added to the protofibrillar stage (mid-exponential phase of the ThT curve) at [P]
3 and monitored for ThT fluorescence. For assessing the effect of compounds on pre-formed protofibrils, compounds were added to the protofibrillar stage (mid-exponential phase of the ThT curve) at [P]![[thin space (1/6-em)]](https://www.rsc.org/images/entities/char_2009.gif) :
:![[thin space (1/6-em)]](https://www.rsc.org/images/entities/char_2009.gif) [D] ratios of 2
[D] ratios of 2![[thin space (1/6-em)]](https://www.rsc.org/images/entities/char_2009.gif) :
:![[thin space (1/6-em)]](https://www.rsc.org/images/entities/char_2009.gif) 1 and 1
1 and 1![[thin space (1/6-em)]](https://www.rsc.org/images/entities/char_2009.gif) :
:![[thin space (1/6-em)]](https://www.rsc.org/images/entities/char_2009.gif) 1. All measurements were carried out in triplicates wherein error bars represent standard deviation of each data point.
1. All measurements were carried out in triplicates wherein error bars represent standard deviation of each data point.where, yo and y indicates ThT fluorescence at t = 0 and any time (t) and ymax is maximum ThT fluorescence. Lag phase was calculated using
 .
.![[thin space (1/6-em)]](https://www.rsc.org/images/entities/char_2009.gif) :
:![[thin space (1/6-em)]](https://www.rsc.org/images/entities/char_2009.gif) D ratios 2
D ratios 2![[thin space (1/6-em)]](https://www.rsc.org/images/entities/char_2009.gif) :
:![[thin space (1/6-em)]](https://www.rsc.org/images/entities/char_2009.gif) 1, 1
1, 1![[thin space (1/6-em)]](https://www.rsc.org/images/entities/char_2009.gif) :
:![[thin space (1/6-em)]](https://www.rsc.org/images/entities/char_2009.gif) 1 and 1
1 and 1![[thin space (1/6-em)]](https://www.rsc.org/images/entities/char_2009.gif) :
:![[thin space (1/6-em)]](https://www.rsc.org/images/entities/char_2009.gif) 3 were incubated for 4 hours prior to fluorescence scans between 300 nm to 400 nm with excitation at 290 nm. Excitation and emission slits were set at 5/5. Thermal denaturation assays at P
3 were incubated for 4 hours prior to fluorescence scans between 300 nm to 400 nm with excitation at 290 nm. Excitation and emission slits were set at 5/5. Thermal denaturation assays at P![[thin space (1/6-em)]](https://www.rsc.org/images/entities/char_2009.gif) :
:![[thin space (1/6-em)]](https://www.rsc.org/images/entities/char_2009.gif) D (2
D (2![[thin space (1/6-em)]](https://www.rsc.org/images/entities/char_2009.gif) :
:![[thin space (1/6-em)]](https://www.rsc.org/images/entities/char_2009.gif) 1) were performed by gradual heating from 20 °C to 90 °C with ramping rate of 1° per minute.
1) were performed by gradual heating from 20 °C to 90 °C with ramping rate of 1° per minute.![[thin space (1/6-em)]](https://www.rsc.org/images/entities/char_2009.gif) 000 rpm for 1 hour after incubation for 60 h. The pellet was suspended in 50 μL respective buffer and sonicated for 5 minutes. The sonicated samples were resuspended in 450 μL of respective buffer before use in the titration experiments. All scans were recorded with excitation/emission slits set at 5/10 nm. The excitation wavelength for EtBr and Dxr was set at 485 nm while for Mtx and Chl it was kept at 660 nm and 420 nm, respectively. Change in fluorescence intensity was plotted against increasing concentration of protein/peptide. Dissociation constant (Kd) was obtained by using GraphPad Prism 5 (GraphPad Software Inc., San Diego, CA) employing nonlinear regression least square curve fitting analysis using single site specific model as:
000 rpm for 1 hour after incubation for 60 h. The pellet was suspended in 50 μL respective buffer and sonicated for 5 minutes. The sonicated samples were resuspended in 450 μL of respective buffer before use in the titration experiments. All scans were recorded with excitation/emission slits set at 5/10 nm. The excitation wavelength for EtBr and Dxr was set at 485 nm while for Mtx and Chl it was kept at 660 nm and 420 nm, respectively. Change in fluorescence intensity was plotted against increasing concentration of protein/peptide. Dissociation constant (Kd) was obtained by using GraphPad Prism 5 (GraphPad Software Inc., San Diego, CA) employing nonlinear regression least square curve fitting analysis using single site specific model as:| Y = Bmax × X/(Kd + X) |
Acknowledgements
This work was supported financially and infrastructurally by IIT Delhi. JS, PS, PP and AS acknowledge fellowship support from IIT Delhi and ICMR India, respectively. We are indebted to Prof. Dipak Dasgupta and Dr Amrita Banerjee for technical discussions and providing chelerythrine. Authors thank the IIT Delhi HPC facility for computational resources.References
- W. M. Tay, D. Huang, T. L. Rosenberry and A. K. Paravastu, J. Mol. Biol., 2013, 425, 2494–2508 CrossRef CAS PubMed.
- E. C. Mader Jr, R. El-Abassi, N. R. Villemarette-Pittman, L. Santana-Gould, P. W. Olejniczak and J. D. England, Neurol. Int., 2013, 5, e1 CrossRef PubMed.
- P. Trepte, N. Strempel and E. E. Wanker, Essays Biochem., 2014, 56, 167–180 CrossRef PubMed.
- W. J. Du, J. J. Guo, M. T. Gao, S. Q. Hu, X. Y. Dong, Y. F. Han, F. F. Liu, S. Jiang and Y. Sun, Sci. Rep., 2015, 5, 7992 CrossRef CAS PubMed.
- F. Chiti and C. M. Dobson, Annu. Rev. Biochem., 2006, 75, 333–366 CrossRef CAS PubMed.
- M. Sunde, L. C. Serpell, M. Bartlam, P. E. Fraser, M. B. Pepys and C. C. Blake, J. Mol. Biol., 1997, 273, 729–739 CrossRef CAS PubMed.
- S. Kumar and J. B. Udgaonkar, J. Mol. Biol., 2009, 385, 1266–1276 CrossRef CAS PubMed.
- C. G. Glabe and R. Kayed, Neurology, 2006, 66, S74–S78 CrossRef CAS PubMed.
- C. Goldsbury, J. Kistler, U. Aebi, T. Arvinte and G. J. Cooper, J. Mol. Biol., 1999, 285, 33–39 CrossRef CAS PubMed.
- J. C. Rochet and P. T. Lansbury Jr, Curr. Opin. Struct. Biol., 2000, 10, 60–68 CrossRef CAS PubMed.
- R. Carrotta, M. Manno, D. Bulone, V. Martorana and P. L. San Biagio, J. Biol. Chem., 2005, 280, 30001–30008 CrossRef CAS PubMed.
- G. T. Dolphin, P. Dumy and J. Garcia, Angew. Chem., 2006, 45, 2699–2702 CrossRef CAS PubMed.
- M. Cheon, I. Chang, S. Mohanty, L. M. Luheshi, C. M. Dobson, M. Vendruscolo and G. Favrin, PLoS Comput. Biol., 2007, 3, 1727–1738 CAS.
- S. Auer, F. Meersman, C. M. Dobson and M. Vendruscolo, PLoS Comput. Biol., 2008, 4, e1000222 Search PubMed.
- A. De Simone, A. Dhulesia, G. Soldi, M. Vendruscolo, S. T. Hsu, F. Chiti and C. M. Dobson, Proc. Natl. Acad. Sci. U. S. A., 2011, 108, 21057–21062 CrossRef CAS PubMed.
- A. R. Dinner, A. Sali, L. J. Smith, C. M. Dobson and M. Karplus, Trends Biochem. Sci., 2000, 25, 331–339 CrossRef CAS PubMed.
- A. Srivastava, P. Arya, S. Goel, B. Kundu, P. Mishra and A. Fnu, PLoS One, 2015, 10, e0127011 Search PubMed.
- C. Wu, H. Lei and Y. Duan, Biophys. J., 2005, 88, 2897–2906 CrossRef CAS PubMed.
- D. Zanuy, B. Ma and R. Nussinov, Biophys. J., 2003, 84, 1884–1894 CrossRef CAS PubMed.
- L. H. Tu and D. P. Raleigh, Biochemistry, 2013, 52, 333–342 CrossRef CAS PubMed.
- K. E. Marshall, K. L. Morris, D. Charlton, N. O'Reilly, L. Lewis, H. Walden and L. C. Serpell, Biochemistry, 2011, 50, 2061–2071 CrossRef CAS PubMed.
- M. L. Waters, Curr. Opin. Chem. Biol., 2002, 6, 736–741 CrossRef CAS PubMed.
- P. Yakovchuk, E. Protozanova and M. D. Frank-Kamenetskii, Nucleic Acids Res., 2006, 34, 564–574 CrossRef CAS PubMed.
- S. Stefansson, D. L. Adams and C. M. Tang, BioTechniques, 2012, 52, 1–6 Search PubMed.
- Y. Porat, A. Abramowitz and E. Gazit, Chem. Biol. Drug Des., 2006, 67, 27–37 CAS.
- S. Bastianetto, S. Krantic and R. Quirion, Mini-Rev. Med. Chem., 2008, 8, 429–435 CrossRef CAS PubMed.
- A. M. Wardley, G. C. Jayson, D. J. Goldsmith, M. C. Venning, P. Ackrill and J. H. Scarffe, Br. J. Cancer, 1998, 78, 774–776 CrossRef CAS PubMed.
- G. Merlini, E. Ascari, N. Amboldi, V. Bellotti, E. Arbustini, V. Perfetti, M. Ferrari, I. Zorzoli, M. G. Marinone and P. Garini, et al., Proc. Natl. Acad. Sci. U. S. A., 1995, 92, 2959–2963 CrossRef CAS.
- R. Colombo, A. Carotti, M. Catto, M. Racchi, C. Lanni, L. Verga, G. Caccialanza and E. De Lorenzi, Electrophoresis, 2009, 30, 1418–1429 CrossRef CAS PubMed.
- K. Augutis, M. Axelsson, E. Portelius, G. Brinkmalm, U. Andreasson, M. K. Gustavsson, C. Malmestrom, J. Lycke, K. Blennow, H. Zetterberg and N. Mattsson, Mult. Scler., 2013, 19, 543–552 CrossRef CAS PubMed.
- A. Mukherjee, R. Lavery, B. Bagchi and J. T. Hynes, J. Am. Chem. Soc., 2008, 130, 9747–9755 CrossRef CAS PubMed.
- A. Banerjee, J. Singh and D. Dasgupta, J. Fluoresc., 2013, 23, 745–752 CrossRef CAS PubMed.
- S. Lahiri, T. Takao, P. G. Devi, S. Ghosh, A. Ghosh, A. Dasgupta and D. Dasgupta, BioMetals, 2012, 25, 435–450 CrossRef CAS PubMed.
- S. Lahiri, P. G. Devi, P. Majumder, S. Das and D. Dasgupta, J. Phys. Chem. B, 2008, 112, 3251–3258 CrossRef CAS PubMed.
- D. Reha, M. Kabelac, F. Ryjacek, J. Sponer, J. E. Sponer, M. Elstner, S. Suhai and P. Hobza, J. Am. Chem. Soc., 2002, 124, 3366–3376 CrossRef CAS PubMed.
- A. Srivastava, S. Sharma, S. Sadanandan, S. Gupta, J. Singh, S. Gupta, V. Haridas and B. Kundu, Biochem. J., 2016 DOI:10.1042/BCJ20160737.
- P. Arya, A. Srivastava, S. V. Vasaikar, G. Mukherjee, P. Mishra and B. Kundu, ACS Chem. Neurosci., 2014, 5, 982–992 CrossRef CAS PubMed.
- F. Bemporad, N. Taddei, M. Stefani and F. Chiti, Protein Sci., 2006, 15, 862–870 CrossRef CAS PubMed.
- J. T. Nielsen, M. Bjerring, M. D. Jeppesen, R. O. Pedersen, J. M. Pedersen, K. L. Hein, T. Vosegaard, T. Skrydstrup, D. E. Otzen and N. C. Nielsen, Angew. Chem., 2009, 48, 2118–2121 CrossRef CAS PubMed.
- J. P. Solomon, I. T. Yonemoto, A. N. Murray, J. L. Price, E. T. Powers, W. E. Balch and J. W. Kelly, Biochemistry, 2009, 48, 11370–11380 CrossRef CAS PubMed.
- L. A. Morozova-Roche, J. Zurdo, A. Spencer, W. Noppe, V. Receveur, D. B. Archer, M. Joniau and C. M. Dobson, J. Struct. Biol., 2000, 130, 339–351 CrossRef CAS PubMed.
- M. Jeffrey, G. McGovern, N. Makarava, L. Gonzalez, Y. S. Kim, R. G. Rohwer and I. V. Baskakov, Neuropathol. Appl. Neurobiol., 2014, 40, 296–310 CrossRef CAS PubMed.
- D. Matthes, V. Daebel, K. Meyenberg, D. Riedel, G. Heim, U. Diederichsen, A. Lange and B. L. de Groot, J. Mol. Biol., 2014, 426, 362–376 CrossRef CAS PubMed.
- D. Matthes, V. Gapsys, V. Daebel and B. L. de Groot, PLoS One, 2011, 6, e19129 CAS.
- J. Kyte and R. F. Doolittle, J. Mol. Biol., 1982, 157, 105–132 CrossRef CAS PubMed.
- C. Jash, P. Basu, P. V. Payghan, N. Ghoshal and G. S. Kumar, Phys. Chem. Chem. Phys., 2015, 17, 16630–16645 RSC.
- M. Biancalana and S. Koide, Biochim. Biophys. Acta, 2010, 1804, 1405–1412 CrossRef CAS PubMed.
- H. LeVine III, Protein Sci., 1993, 2, 404–410 CrossRef PubMed.
- M. Bartolini, C. Bertucci, M. L. Bolognesi, A. Cavalli, C. Melchiorre and V. Andrisano, ChemBioChem, 2007, 8, 2152–2161 CrossRef CAS PubMed.
- D. Hamada and C. M. Dobson, Protein Sci., 2002, 11, 2417–2426 CrossRef CAS PubMed.
- J. W. Kelly, Curr. Opin. Struct. Biol., 1996, 6, 11–17 CrossRef CAS PubMed.
- S. M. Tracz, A. Abedini, M. Driscoll and D. P. Raleigh, Biochemistry, 2004, 43, 15901–15908 CrossRef CAS PubMed.
- J. Sorensen, X. Periole, K. K. Skeby, S. J. Marrink and B. Schiott, J. Phys. Chem. Lett., 2011, 2, 2385–2390 CrossRef CAS.
- K. Karatasos, J. Phys. Chem. B, 2013, 117, 2564–2575 CrossRef CAS PubMed.
- M. Menozzi, L. Valentini, E. Vannini and F. Arcamone, J. Pharm. Sci., 1984, 73, 766–770 CrossRef CAS PubMed.
- M. Enache and E. Volanschi, Rev. Roum. Chim., 2010, 55, 255–262 CAS.
- D. B. Davies, D. A. Veselkov, M. P. Evstigneev and A. N. Veselkov, J. Chem. Soc., Perkin Trans. 2, 2001, 61–67, 10.1039/B007042o.
- M. P. Evstigneev, V. P. Evstigneev and D. B. Davies, J. Mol. Struct., 2006, 784, 162–168 CrossRef CAS.
- B. P. Roques, J. Barbet and J. B. Lepecq, Comptes Rendus Hebdomadaires Des Seances De L Academie Des Sciences Serie D, 1976, 283, 1453–1455 CAS.
- M. Adrover, K. Pauwels, S. Prigent, C. de Chiara, Z. Xu, C. Chapuis, A. Pastore and H. Rezaei, J. Biol. Chem., 2010, 285, 21004–21012 CrossRef CAS PubMed.
- C. Wu, H. Lei, Z. Wang, W. Zhang and Y. Duan, Biophys. J., 2006, 91, 3664–3672 CrossRef CAS PubMed.
- C. Wu, Z. Wang, H. Lei, W. Zhang and Y. Duan, J. Am. Chem. Soc., 2007, 129, 1225–1232 CrossRef CAS PubMed.
- V. Ivancic, O. Ekanayake and N. Lazo, ChemPhysChem, 2016 DOI:10.1002/cphc.201600246.
- J. Lei, R. Qi, G. Wei, R. Nussinov and B. Ma, Phys. Chem. Chem. Phys., 2016, 18, 8098–8107 RSC.
- M. Zhang, R. Hu, H. Chen, X. Gong, F. Zhou, L. Zhang and J. Zheng, J. Chem. Inf. Model., 2015, 55, 1628–1639 CrossRef CAS PubMed.
- Z. Lin and W. F. van Gunsteren, J. Comput. Chem., 2013, 34, 2796–2805 CrossRef CAS PubMed.
- W. Huang, Z. Lin and W. F. van Gunsteren, J. Chem. Theory Comput., 2011, 7, 1237–1243 CrossRef CAS PubMed.
- N. Schmid, A. P. Eichenberger, A. Choutko, S. Riniker, M. Winger, A. E. Mark and W. F. van Gunsteren, Eur. Biophys. J., 2011, 40, 843–856 CrossRef CAS PubMed.
- K. B. Koziara, M. Stroet, A. K. Malde and A. E. Mark, J. Comput.–Aided Mol. Des., 2014, 28, 221–233 CrossRef CAS PubMed.
- A. K. Malde, L. Zuo, M. Breeze, M. Stroet, D. Poger, P. C. Nair, C. Oostenbrink and A. E. Mark, J. Chem. Theory Comput., 2011, 7, 4026–4037 CrossRef CAS PubMed.
- S. Vilar, G. Cozza and S. Moro, Curr. Top. Med. Chem., 2008, 8, 1555–1572 CrossRef CAS PubMed.
- J. Singh, A. Srivastava, P. Jha, K. K. Sinha and B. Kundu, Mol. BioSyst., 2015, 11, 1887–1896 RSC.
- Schrodinger, LLC, unpublished work.
- B. Kundu, N. R. Maiti, E. M. Jones, K. A. Surewicz, D. L. Vanik and W. K. Surewicz, Proc. Natl. Acad. Sci. U. S. A., 2003, 100, 12069–12074 CrossRef CAS PubMed.
Footnote |
| † Electronic supplementary information (ESI) available. See DOI: 10.1039/c6ra26313e |
| This journal is © The Royal Society of Chemistry 2017 |

