 Open Access Article
Creative Commons Attribution 3.0 Unported Licence
Experimental investigation on regime transition and characteristic velocity in a horizontal–vertical pulsed sieve-plate column
Sahar Akhgara,
Jaber Safdari*b,
Jafar Towfighi*a,
Pouria Amani c and
Mohammad H. Mallah
 b
b
aChemical Engineering Department, Tarbiat Modares University, P.O. Box: 14115-143, Tehran, Iran. E-mail: towfighi@modares.ac.ir
bNuclear Fuel Cycle Research School, Nuclear Science and Technology Research Institute, P.O. Box: 11365-8486, Tehran, Iran. E-mail: jsafdari@aeoi.org.ir
cSchool of Chemical Engineering, College of Engineering, University of Tehran, P.O. Box: 11155-4563, Tehran, Iran
First published on 12th January 2017
Abstract
In this study, we attempted to evaluate the flow regime transitions in a novel type of extractor, called a horizontal–vertical pulsed sieve-plate column, for three liquid–liquid systems: toluene–water, butyl acetate–water, and n-butanol–water, with a 3% volumetric fraction of acetone in the dispersed phase as a mass transfer agent. Moreover, due to the importance of the characteristic velocity, the effects of operating parameters, such as the pulsation intensity and flow rate of the phases, have been investigated in each section of the column. The characteristic velocity shows different behaviors with the variation of the operating parameters in each section, which has been thoroughly discussed in this study. New correlations for the transitions from the mixer-settler regime to the dispersion regime in the vertical section and from the dispersion regime to the emulsion regime in the horizontal section have been proposed, which indicate the lower and upper limits of the proper pulsation intensity to identify the operational range of the dispersion regime. Furthermore, new correlations have been proposed for the prediction of the characteristic velocity in each section of the column, with average absolute relative errors (AAREs) ranging from 9.81% to 11.15%, which represent a satisfactory agreement between the experimental and calculated data.
1. Introduction
Solvent extraction is a method that is widely used in the separation applications. Various types of internals and agitations have been developed for the extractors over time, leading to the introduction of various extractors, such as columns, mixer-settlers, and centrifugal extractors.1 One such extractor is a pulsed extraction column, which requires an external power supply in the form of pulsation. There are no moving mechanical devices in the pulsed columns; therefore, they require less repair and servicing. Consequently, majority of experiments require pulsed columns with perforated plates.2,3 Sieve-plate extraction columns have been employed in a range of industries, including chemical industry, hydrometallurgy, nuclear technology, waste management, and food industry.1 Compared to mixer-settlers, which are mostly used in the mining industry, pulsed perforated-plate columns are appealing from both safety and economic points of view, especially due to their simple design, lower space requirements, higher throughput, and lack of internal moving parts.Pulsed columns are generally divided into two major categories according to their shapes: (1) vertical pulsed columns and (2) horizontal pulsed columns. Various internals can be used in these columns, such as perforated plates, packing, discs, and doughnuts. The main features of the horizontal and vertical extraction columns under similar conditions have been studied,4–8 and it was found that the horizontal columns have more advantages than those of the vertical columns. Although vertical columns meet most of the requirements for industrial applications, horizontal columns have some additional benefits as follows:
(1) They are appropriate for industries with height limitations.
(2) They offer high protection against radiation.
(3) Their ease of repair, maintenance, and device disassembly are greater than those of the vertical columns.
(4) Mass transfer efficiency in a horizontal column is comparable to that in a vertical column.8
Admittedly, horizontal pulsed columns do not always yield positive results as discussed above; moreover, they have some drawbacks, for example, horizontal pulsed columns provide lower throughput and require longer startup times. Therefore, each type of column has its own advantages and disadvantages. It is expected that the columns with horizontal–vertical structures will introduce more benefits and provide better performance than those with vertical or horizontal structures in the applications with area limitation.
Demonstration of the behavior of a pulsed sieve-plate column requires a proper evaluation of the drop population characteristics (i.e. mean drop diameter, holdup, etc.).2,9–11 Numerous investigations have been conducted on the mass transfer performance as well as hydrodynamics of these columns, as reviewed by Yadav and Patwardhan.2 Moreover, determination of the characteristic velocity is crucial to estimate the flooding time and maximum throughput of an extraction column.
In the present study, based on the variations of holdup in the dispersed phase, the regime transitions in a novel extraction column, called a horizontal–vertical pulsed sieve-plate column, have been characterized. Moreover, the effects of operating parameters, including the dispersed and continuous phase flow rates and the pulsation intensities in the absence and presence of mass transfer (d → c), on the characteristic velocity in the column have been evaluated. Two correlations for the regime transition along with two correlations for the prediction of characteristic velocity have been proposed.
2. Previous work
The steady state region of operation in the extraction columns has been a subject of numerous investigations.2,12,13 In the following section, the governing regimes in the extraction columns are clarified and a brief review of the characteristic velocity studies has been presented.2.1. Working regimes in the vertical extraction columns
In a vertical pulsed plate column, mechanical energy is applied to the column by a reciprocating motion in the form of pulsing. With the help of pulsing, the layer of the heavy phase translocates to rest on the internal plates and the layer of the light phase displaces to collect under the internals.2 During the upward portion of the pulse movement, the light phase resting under the sieve-plate is pushed through the holes into the heavy phase above the plate. Similarly, on the down stroke, the reverse phenomenon occurs and the heavy phase descends through the light phase during the downward movement of the pulse.14According to reports, for a constant flow rate of a liquid phase, there are three stable regimes, including the mixer-settler, dispersion, and emulsion regimes, and one unstable operating regime, thoroughly discussed by Yadav and Patwardhan.2 In addition to these regimes, two flooding types can be defined based on the pulsation intensity, which has been clarified by numerous investigators.15–20
Regarding the abovementioned regimes, there is an operating range for the pulsation intensity. At higher and lower pulsation intensities, flooding occurs. In fact, when the pulsation intensity is inadequate (i.e., lower than that in the mixer-settler regime for a given phase flow rate), the dispersed phase drops originating from the sparger are not able to move through the perforations of the plates due to insufficient mechanical agitation and thus flooding occurs. According to Smoot et al.,16 the plates act as a physical barrier in prohibiting the countercurrent flow of the two immiscible phases. This phenomenon is called flooding due to insufficient pulsation. On the other hand, a further increase in the pulsation intensity (greater than that in the emulsion regime) leads to an enhancement of the shear forces and the formation of smaller droplets. Since the continuous phase superficial velocity becomes greater than the terminal rise velocity, drops begin to accumulate in the initial compartment of the extraction column at the dispersed phase inlet. This phenomenon is called flooding due to the excessive pulsation.
Based on the regimes of operations, the flow conditions in the column vary; consequently, it is essential to understand where one region changes to another. To propose a correlation for predicting the transition between the regimes, a large number of investigations have been conducted and many correlations for the regime transition in the extraction columns have been proposed, which have been listed by Kumar and Hartland.21 Table 1 exhibits a number of major correlations proposed for the regime transition.
| Reference | Correlation for regime transition | Comments |
|---|---|---|
| Sehmel and Babb17 | ft = 0.667(−3.373 + 3.883 × 10²μdσΔρ − ln![[thin space (1/6-em)]](https://www.rsc.org/images/entities/char_2009.gif) A) A) |
f < ft mixer-settler region |
| f ≥ ft dispersion region | ||
| • Derived for liquid–liquid systems of methyl isobutyl ketone, benzene, and hexane as individual phases dispersed in water | ||
| Sato et al.12 | 0 < Af ≤ 1.3Vd0.22h−0.32d−0.37Vd0.22h−0.32d−0.37 < Af ≤ 1.3Vd0.22h−0.35d−0.370.8Vd0.22h−0.35d−0.37 < Af | Mixer-settler region |
| Dispersion region | ||
| Emulsion region | ||
| • Derived for a liquid–liquid system of methyl isobutyl ketone and water with acetic acid as the solute transfer agent (d → c) | ||
| Miyauchi and Oya26 |  |
Af < (Af)t dispersion region |
| Af ≥ (Af)t emulsion region | ||
| • Derived for a liquid–liquid system of methyl isobutyl ketone and water with potassium chloride as the tracer electrolyte | ||
| Boyadzhiev and Spassov24 |  |
Af < (Af)t dispersion region |
| Af ≥ (Af)t emulsion region | ||
| • The system used was distilled water and an equivolumetric mixture of kerosene and carbon tetrachloride (KCT) | ||
| Kumar and Hartland23 |  |
Af < (Af)t dispersion region |
| Af ≥ (Af)t emulsion region | ||
| • Proposed from 725 data points with no mass transfer | ||
| Tung and Luecke25 |  |
Af < (Af)t dispersion region |
| Af ≥ (Af)t emulsion region | ||
| • The mass transfer results were obtained from 5 different investigations. Water was the continuous phase and the dispersed phases (and solutes) were butyl acetate (acetone), toluene (acetone), 1,1,2-trichloroethane (acetone), MIBK (acetic acid), carbon tetrachloride (iodine), and 12.5% tributyl phosphate in a kerosene-type hydrocarbon | ||
| Kumar and Hartland21 |  |
Af < (Af) mixer-settler region |
| Af ≥ (Af)t dispersion region | ||
| • Proposed from 1574 data points with no mass transfer for 14 different chemical systems. Except for one of the experiments, in all other investigations, water was the continuous phase and the dispersed phases (and solutes) included methyl isobutyl ketone, hexane, carbon tetrachloride (iodine), benzene (acetic acid), toluene (acetone), butyl acetate (acetone), iso amyl alcohol (boric acid), and o-xylene |
Sehmel and Babb,17 in their investigation of holdup in a vertical pulsed column, showed that the holdup values achieved the least value with the increasing frequency, which indicated the transition from the mixer-settler regime to the dispersion regime. Sreenivasulu et al.,22 by studying the liquid–liquid systems of water and kerosene in a vertical pulsed plate column, divided the operation of the column into three regimes. Based on their observations, the operation of the pulsed column was differentiated into a mixer-settler regime (Af < 1.5 × 10⁻² m s−1), a dispersion regime (1.5 × 10⁻² < Af < 4.0 × 10⁻² m s−1), and an emulsion regime (4.0 × 10⁻² < Af m s−1). Of course, these ranges of pulsation intensities are just estimations and depend on the chemical system used.
Sato et al.12 developed three different correlations for the transitions between the mixer-settler, dispersion, and emulsion regimes in a water–acetic acid–MIBK system. Based on their results, the mixer-settler regime was the region where the holdup reached a minimum value with the increasing pulsation intensity; afterwards, the holdup showed a reverse trend and gradually increased. Kumar and Hartland23 indicated that in many other liquid–liquid systems, the boundary between the mixer-settler and dispersion regimes also occurs at the minimum value of the holdup. Boyadzhiev and Spassov,24 by implementing the experimental results of eight different research studies, have formulated a criterion for the pulsation intensity. Tung and Luecke25 also determined the criteria for regime transition based on different experimental observations, which demonstrated the reliability of their proposed correlation.
Furthermore, according to Yadav and Patwardhan,2 the correlations of numerous researchers, such as Miyauchi and Oya,26 Sato et al.,12 or Sehmel and Babb,17 were found to be applicable only to the chemical systems as well as to the geometries of the columns for which they were developed, whereas the correlations of Boyadzhiev and Spassov24 and Kumar and Hartland21 were developed from different investigations.
2.2. Working regimes in a horizontal column
Among the investigators who proposed distinctive working regions in the horizontal pulsed plate columns, Melnyk et al.4 and Khajenoori et al.27 have observed that three operating regimes can be defined in such columns. At low pulsation intensities, a fully separated regime occurs in the column, which is characterized as similar to the mixer-settler regime in the vertical extraction columns. This fully separated regime is followed by a regime called the pseudo-dispersion flow regime. With further increase in the pulsation intensity, the shear forces on the drops will increase and, consequently, the drop breakage will increase. Therefore, at high pulsation intensities, the emulsion flow regime is formed in the horizontal pulsed-plate column.2.3. Studies on the characteristic velocity
One important parameter in the design of HVPSPC is the characteristic velocity, which is used to relate the holdup of the continuous phase and the slip velocity (Vs). Slip velocity is the relative velocity between the continuous phase flow rate and the dispersed phase drops, which can be determined by eqn (1):
 | (1) |
Gayler and Pratt28 presented a linear equation when φ < 0.2 using a modified form of Stokes' law as follows:29
 | (2) |
Characteristic velocity is required for the calculation of the column diameter and the maximum throughput of any extraction column. Thornton30 has differentiated the slip velocity (Vs) relation to achieve the flooding capacity in terms of the dispersed and continuous phase velocities. Using the results from five chemical systems, he proposed a correlation (eqn (3)) to determine the characteristic velocity for Af > 0.012 m s−1:
 | (3) |
Schmidt and Miller31 corrected the constant of Thornton's correlation from 0.60 to 0.172 to cover the transition and emulsion regions for kerosene–tributyl phosphate–nitric acid. Moreover, Logsdail and Thornton32 developed the correlation of Thornton30 to evaluate the influence of the column diameter.
Godfrey and Slater33 suggested that the power law relationship (eqn (4)) proposed by Richardson and Zaki34 for systems containing uniform solid particles is applicable for use in the liquid–liquid extractions when 0 < φ < 0.3.
| Vs = V0(1 − φ)n | (4) |
| Column type | Reference | Value of n |
|---|---|---|
| RDC column | Godfrey and Slater33 | 0 to 4 |
| Packed column | Godfrey and Slater33 | 0.3 to 1.5 |
| Sieve-plate column | Hamidi et al.38 | −3 to 1 |
| Graesser raining bucket contactor | Giraldo-Zuniga et al.39 | −0.9 to 3.6 |
| Hanson mixer-settler | Napeida et al.40 | −6 to 6 |
| Multi-impeller column | Asadollahzadeh et al.41 | 1 to 9 |
Slater35 considered the coalescence behavior and developed a correlation with broad applicability for φ > 0.5:
| Vs = V0(1 − φ)n + aφm | (5) |
Another equation has been proposed by Letan and Kehat36 as follows:
Vs = V0![[thin space (1/6-em)]](https://www.rsc.org/images/entities/char_2009.gif) exp(−βφ) exp(−βφ)
| (6) |
Moreover, an another equation was derived by Mišek37 for RDC and ARDC columns as follows:
| Vs = V0(1 − φ)exp(−βφ) | (7) |
| Reference | Correlation for V0 | Comments |
|---|---|---|
| Míšek37 and Misek and Marek42 |  |
For d43V0ρc/μc ≥ 10 |
| • An exponential term is incorporated in eqn (2) to allow the hindered settling and coalescence of the drops | ||
| • The coefficient of coalescence, z, is a function of physical properties, which must be experimentally determined | ||
| Hussain and Slater5 |  |
For d32 ≤ d |
| • Vs∞ is calculated using the equation proposed by Grace et al.,43 which requires d32 | ||
| • This correlation is applicable only when the drop size is smaller than the hole diameter | ||
| • No particular method for the prediction of exponent n is proposed | ||
| Batey et al.44 |  |
• The constriction factor, (1 − ξ), is the average fraction of the column cross-sectional area occupied by the column internals. It must be experimentally measured by determining the column volume with and without the internal plates and their associated supports |
| • C1 = 0.05333 and C2 = 43.3 for 30% tributyl phosphate + 70% kerosene (d) and 2 M nitric acid (c) | ||
| • C1 = 0.146 and C2 = 71.7 for 20% tributyl phosphate + 80% kerosene (d) and 3 M nitric acid (c) | ||
| Thornton32 |  |
For Af > 0.012 m s−1 |
• ε is the average frictional power dissipation per unit mass of the mixed phases and is calculated by the following equation:  |
||
| Zhu et al.45 |  |
• n can be calculated by the following equation:  |
• d32 can be calculated by the following equation:  |
||
| Khajenoori et al.27 |  |
• This correlation is proposed for a horizontal pulsed sieve-plate column |
3. Experimental investigation
3.1. Description of the equipment
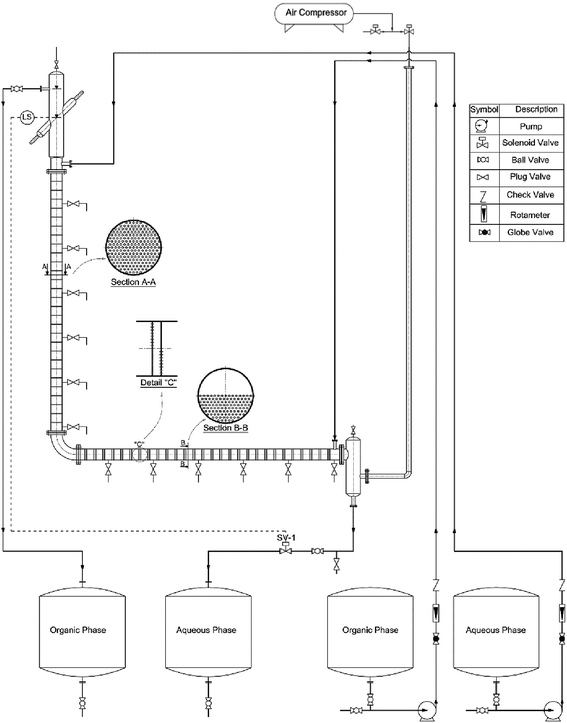
A diagram of the setup employed in this study is illustrated in Fig. 1. The setup consisted of a vertical and a horizontal active part, an upper and lower settler, four tanks, two dosing pumps, two rotameters, and an air pulsating system. The horizontal and vertical section housed 24 pairs of sieve plates and 29 individual sieve plates, respectively. The main characteristics of the setup are listed in Table 4.| a Spacing between two individual plates in a pair.b Spacing between two pairs in a cell. | ||
|---|---|---|
| Material used for settlers, column, and pulsator | Glass | |
| Material used for plates | Stainless steel | |
| Main parts of the column | Horizontal section | Vertical section |
| Active part length of the column (cm) | 146 | 146 |
| Active part internal diameter of the column (cm) | 6 | 6 |
| Upper settler internal diameter (cm) | — | 9 |
| Lower settler internal diameter (cm) | 9 | — |
| Upper settler length (cm) | — | 90 |
| Lower settler length (cm) | 60 | — |
| Hole pitch (mm) | 4 | 4 |
| Hole diameter (mm) | 2 | 2 |
| Plate thickness (mm) | 1 | 1 |
| Spacing between two plates (cm) | 1a, 5b | 5 |
| Free area fraction (—) | 0.11 | 0.22 |
3.2. Liquid–liquid system
The chemical systems used in this study are toluene–water, butyl acetate–water, and n-butanol–water with 3 vol% acetone in the dispersed phase as a solute transfer agent. These systems have been suggested by the EFCE as the official test chemical systems for liquid–liquid studies.46 The physical properties of the chemicals are presented in Table 5.| Physical properties | Systems used without mass transfer | Systems used with mass transfer feed: organic phase + 3% vol. acetone | ||||
|---|---|---|---|---|---|---|
| Ta–Wb | BAc–W | Bd–W | T–Ae–W | BA–A–W | B–A–W | |
| a T: toluene.b W: water.c BA: butyl acetate.d B: n-butanol.e A: acetone. | ||||||
| ρc (kg m−3) | 998 | 997.6 | 985.6 | 998 | 997.6 | 985.6 |
| ρd (kg m−3) | 864 | 880 | 846 | 865.2 | 881.4 | 847.8 |
| μc (mPa s) | 0.963 | 1.0274 | 1.429 | 0.963 | 1.0274 | 1.429 |
| μd (mPa s) | 0.586 | 0.734 | 3.36 | 0.571 | 0.729 | 3.34 |
| σ (mN m−1) | 35.4 | 13.5 | 1.9 | 30.1 | 13.2 | 1.5 |
3.3. Experimental procedure
For the prevention of solubility during the experiments, both phases were initially saturated. The column was filled with water, and then the dispersed and continuous phase flow rates along with the pulsation frequency and amplitude were adjusted to the intended values. The experimental ranges of the dispersed and continuous phases flow rates were considered from 1.5 to 7 l h−1 and from 1.75 to 9 l h−1, respectively, and the range of the pulsation intensity (amplitude × frequency) was from 0.4 to 1.3 cm s−1.The holdup was determined using the displacement method. Accordingly, when the column was operated in the steady state, the pulsation and the outlet and inlet valves were closed, and the holdups of the horizontal and vertical parts were separately determined. In the horizontal section, the holdup was calculated by measuring the arc length of the part of the environment wetted by light liquid. The cord length at the interface, Li, was determined as below:
 | (8) |
 | (9) |
 | (10) |
In the vertical section, variation of the interface height was determined, and then the holdup was measured by eqn (11):
 | (11) |
4. Results and discussion
4.1. Flow regime transition in a HVPSPC
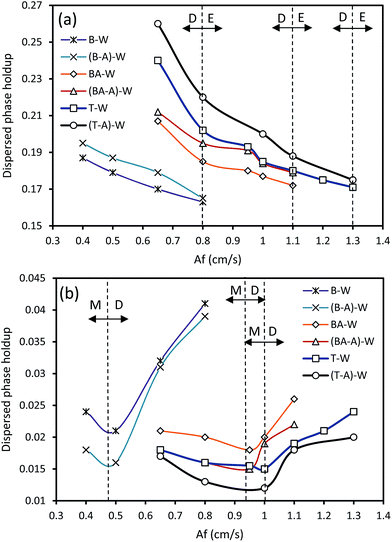
As discussed in Section 2, it is crucial to determine where a particular regime changes to another regime to evaluate the performance of a separation process. The transition from one regime to another is a function of variation in the pulsation or flow rates of a given chemical system along with the geometry of the column.Since it has been proved that the dispersion regime provides the highest mass transfer performance, we attempted to demonstrate the dispersion region in a HVPSPC. Therefore, to determine the transition from one type of regime to another, variation of the holdup versus pulsation intensity was studied because the holdup values depend on whether the operating regime is the mixer-settler, dispersion or emulsion regime. Fig. 2 depicts the influence of the pulsation intensity on the dispersed phase holdup at constant flow rates of both phases for some experiments. It is clear that the horizontal pulsed columns operate in the mixer-settler regime at a lower Af than that of the vertical columns. Therefore, in the range of Af considered in this study, the mixer-settler regime occurs in the vertical section of the column at lower pulsation intensities, whereas the horizontal section operates in the dispersion regime. As can be seen in Fig. 2a, with the increasing Af, the holdup decreases due to the decrease in the residence time of the dispersed phase droplets. However, with further increase in Af, the inertial and shear forces on the droplets and, consequently, the drop breakage significantly increase, and then an emulsion is formed with a uniform drop size distribution in each inter-plate space. The dispersed phase droplets are pushed away along with the bulk liquid during the downward portion of the pulsation movement. Therefore, the maximum throughput of the column significantly declines with the increasing Af, tending to zero. Accordingly, the transition from the dispersion to the emulsion regime in the horizontal section is depicted in Fig. 2a (D–E dashed lines), which was determined based on the variations of the holdup and mean drop sizes in the horizontal section of the column. It is also found that the systems with higher interfacial tension have higher holdup values, which leads to lower Af regions of the flow regime transition. Moreover, as can be seen in Fig. 2b, when Af increases, the holdup declines in the vertical section until the least value is achieved, corresponding to the transition from the mixer-settler regime to the dispersion regime (M–D dashed lines). The minimum holdup values are found to be a function of the operating parameters and vary for different systems with different physical properties. It has also been found that the systems with lower interfacial tension have higher holdup values and consequently the flow regime transition occurs at a lower Af region, corresponding to the position of the minimum holdup, and vice versa. In fact, at a low pulsation intensity, the vertical section of the column operates in the mixer-settler regime, in which the column acts like a series of settlers and mixers, and heavy and light liquids completely separate from each other in each compartment during the quiescent portion of the pulsation.14 The dispersion regime follows the mixer-settler regime and can be specified by the non-uniform distribution of the drop diameters along with seldom coalescence of the droplets.
Because the maximum throughput of the horizontal section of the column is lower than that of the vertical section, the upper limit constraint, which can be defined for the setup, is the transition to the emulsion regime in the horizontal section. In this case, the capacity of the column significantly decreases and the column cannot practically operate. Therefore, an optimum Af range can be defined for the operation of the HVPSPC in which both sections operate in the dispersion regime, leading to the enhancement of the extraction efficiency.
Although the regime transitions gradually occur in a particular range of pulsation intensities, it is favorable to approximately consider the regime transitions as particular points and determine them for all chemical systems. Therefore, the transition Af is evaluated for each set of operational conditions and the resulting correlation for estimating (Af)t is derived as follows:
(1) Transition from the mixer-settler regime to the dispersion regime in the vertical section:
 | (12) |
(2) Transition from the dispersion regime to the emulsion regime in the horizontal section:
 | (13) |
Eqn. (12) and (13) are modified forms of the Kumar and Hartland's21 correlation. If Af ≥ (Af)t,v and Af ≤ (Af)t,h, it is expected that the dispersion regime occurs in both sections of the column, which consequently leads to higher throughput and enhancement of the mass transfer performance.
4.2. Determination of the characteristic velocity
Many correlations have been proposed to predict the characteristic velocity to relate the slip velocity and holdup. Four models have been employed to determine V0. The operating conditions and characteristic velocities along with the parameters of the models proposed by Míšek,37 Letan and Kehat,36 Richardson and Zaki,34 and Gayler and Pratt28 are shown in Table 6. The average absolute relative error (AARE) is used to evaluate the predictive abilities of the models. AARE can be calculated by eqn (14).
 | (14) |
| System | Operating conditions | Column section | Pratt model28 | Richardson and Zaki model34 | Letan and Kehat model36 | Míšek model37 | |||||||
|---|---|---|---|---|---|---|---|---|---|---|---|---|---|
| V0 (cm s−1) | % AARE | V0 (cm s−1) | n | % AARE | V0 (cm s−1) | β | % AARE | V0 (cm s−1) | β | % AARE | |||
| T–W | Af = 1.1 cm s−1, Qc = 3 l h−1, Qd = 1.5–7 l h−1 | H | 0.31 | 7.48 | 0.45 | −2.52 | 0.41 | 0.47 | −5.04 | 0.64 | 0.48 | −3.46 | 0.59 |
| V | 1.72 | 6.64 | 1.89 | −2.67 | 0.4 | 1.93 | −6.52 | 0.62 | 1.93 | −6.05 | 0.58 | ||
| BA–W | Af = 0.95 cm s−1, Qc = 3 l h−1, Qd = 2.7–7 l h−1 | H | 0.3 | 6.75 | 0.44 | −2.24 | 1.02 | 0.45 | −3.83 | 0.95 | 0.47 | −2.74 | 0.69 |
| V | 1.89 | 6.11 | 2.01 | −2.71 | 0.92 | 2.1 | −5.53 | 0.88 | 2.11 | −5.8 | 0.64 | ||
| B–W | Af = 0.65 cm s−1, Qc = 3 l h−1, Qd = 2–7.5 l h−1 | H | 0.3 | 8.41 | 0.52 | −2.12 | 1.17 | 0.64 | −3.75 | 0.64 | 0.67 | −2.62 | 1.17 |
| V | 0.96 | 7.2 | 1.09 | −2.73 | 1.11 | 1.12 | −6.26 | 0.57 | 1.15 | −6.11 | 1.09 | ||
| T–A–W | Af = 1.1 cm s−1, Qc = 3 l h−1, Qd = 1.5–7 l h−1 | H | 0.26 | 8.18 | 0.37 | −1.9 | 1.14 | 0.43 | −4.14 | 1.11 | 0.45 | −3.32 | 1.21 |
| V | 1.87 | 7.53 | 1.96 | −2.81 | 1.05 | 2.12 | −6.87 | 1.1 | 2.12 | −8.61 | 1.14 | ||
| BA–A–W | Af = 0.95 cm s−1, Qc = 3 l h−1, Qd = 2.7–7 l h−1 | H | 0.32 | 7.25 | 0.65 | −2.06 | 0.85 | 0.76 | −5.05 | 1.27 | 0.78 | −4.08 | 0.73 |
| V | 2.35 | 6.79 | 2.41 | −2.87 | 0.77 | 2.44 | −7.5 | 1.15 | 2.51 | −7.4 | 0.71 | ||
| B–A–W | Af = 0.65 cm s−1, Qc = 3 l h−1, Qd = 2–7.5 l h−1 | H | 0.29 | 5.73 | 0.48 | −2.48 | 0.96 | 0.53 | −5.13 | 0.66 | 0.56 | −4.17 | 0.87 |
| V | 1.17 | 5.65 | 1.32 | −2.95 | 0.95 | 1.42 | −7.91 | 0.56 | 1.43 | −8.11 | 0.85 | ||
According to Table 6 and the results obtained from the study of Napeida et al.40 and Asadollahzadeh et al.,41 the available models for relating the slip velocity and holdup approximately provide almost similar predictions. In this study, the Richardson and Zaki model was considered to determine the characteristic velocity due to its accuracy.
4.3. Influence of the operating parameters on the characteristic velocity
The influence of the pulsation intensity on the characteristic velocity is depicted in Fig. 3 under the conditions of no mass transfer. As the pulsation intensity increases, as shown in Fig. 3, two different behaviors in the curves are observed: V0 increases in the horizontal section, whereas the characteristic velocity decreases in the vertical section. Moreover, it was found that V0 increases with the reduction and enhancement of the interfacial tension in the horizontal and vertical sections, respectively. This behavior of V0 with the changing Af and σ is due to the different holdup values in each section of the column. Increasing Af results in higher drop breakage and shear stress, resulting in higher relative velocity between the two phases. Therefore, the characteristic velocity increases with higher Af in the horizontal section. However, in the vertical section, increasing Af results in the reduction of buoyancy forces and lower rising velocity of the drops, which increases the residence time of the dispersed phase droplets in the column and as a consequence, the dispersed phase holdup increases. Thus, V0 declines in the vertical section based on eqn (2) with the enhancement of the holdup associated with the increasing Af. Moreover, at higher pulsation intensities, the variation of V0 becomes gradual due to the fact that further drop breakage into smaller droplets is restricted.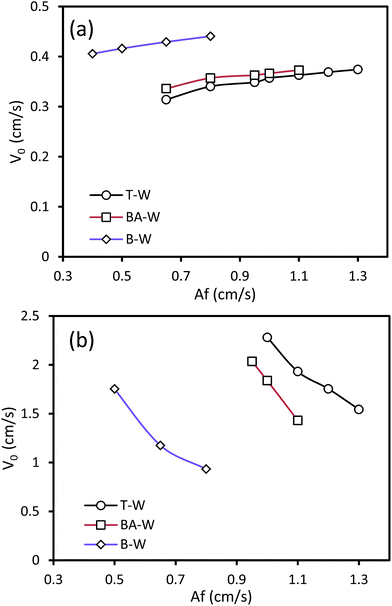 | ||
| Fig. 3 Effect of the pulsation intensity on the characteristic velocity at Qc = 3 l h−1 and Qd = 3.5 l h−1: (a) horizontal section and (b) vertical section. | ||
The influence of the dispersed phase flow rate on the characteristic velocity is given in Fig. 4 for some of the experiments. It can be observed that the characteristic velocity increases with the increasing dispersed phase velocity. According to the definition of Vs, when the dispersed phase flow rate and, consequently, the superficial velocity of the dispersed phase increase, the slip and characteristic velocity will increase. Increasing Qd tends to the enhancement of holdup along with the higher superficial velocity of the dispersed phase drops. However, the influence of the superficial velocity growth on V0 is superior, resulting in higher values of V0. Note that the influence of the dispersed phase flow rate on V0 is stronger than that of the pulsation intensity, due to the greater impact of the superficial velocity as compared to that of the pulsation intensity.
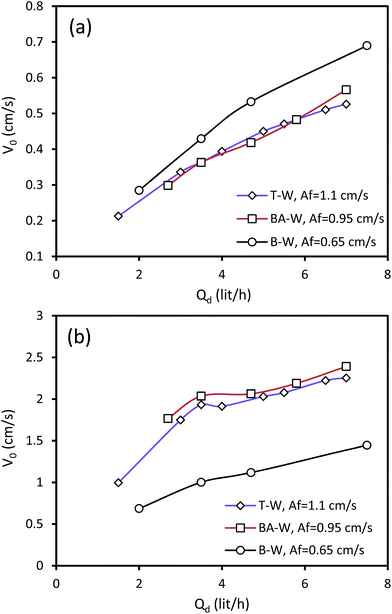 | ||
| Fig. 4 Effect of the dispersed phase flow rate on the characteristic velocity at Qc = 3 l h−1: (a) horizontal section and (b) vertical section. | ||
The variation of the characteristic velocity versus the continuous phase flow rate is illustrated in Fig. 5. It was found that higher Qc leads to a slight enhancement of the characteristic velocity in the horizontal section of the column, whereas it decreases V0 in the vertical section. The flow rate of the continuous phase increases along with the enhancement of the continuous phase superficial velocity; this results from the increase in the characteristic velocity. However, when Qc increases, the drag forces between the two phases increase, and the drop movement will, therefore, be restricted, which results in the higher residence time and holdup in the vertical section. The effect of holdup is dominant in the vertical section, which results in the reduction of the characteristic velocity with the increasing continuous phase flow rate. Furthermore, it is clear that there is a gradual change in the characteristic velocity and it directly varies with the continuous phase velocity. It can be observed that the impact of Qc on the characteristic velocity is less significant than that of Qd.
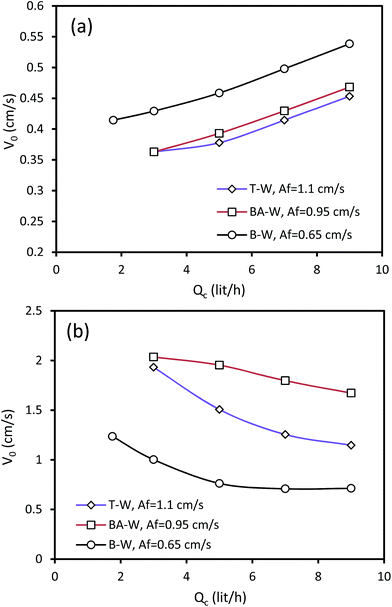 | ||
| Fig. 5 Effect of the continuous phase flow rate on the characteristic velocity at Qd = 3.5 l h−1: (a) horizontal section and (b) vertical section. | ||
4.4. Influence of the mass transfer d → c on the characteristic velocity
The influence of the acetone transfer d → c on the characteristic velocity is shown in Fig. 6. The presence of mass transfer has two distinctive impacts on the characteristic velocity: acetone transfer d → c decreases V0 in the horizontal section and increases it in the vertical section. It is found that mass transfer creates concentration differences, which results in the formation of a surface tension gradient at the interface. When mass transfer occurs in the d → c direction, the concentration of acetone at the top of the drops is higher than that at the bottom of the drops. This interfacial tension gradient causes interfacial movements in the same direction of the inner circulation of the drops, which intensifies the drop coalescence and decreases the drop breakage. Therefore, interfacial deformation declines and the drops become more stable in the presence of mass transfer d → c. Based on the above discussion, mass transfer in the d → c direction leads to formation of larger drops, which can be attributed to the Marangoni convection induction of local differences in the acetone concentration. In the horizontal section, larger drops result in higher holdup values, which decrease the characteristic velocity. However, the formation of larger drops leads to the reduction of the holdup in the vertical section due to more intense buoyancy forces, which reduces the residence time of droplets in the column.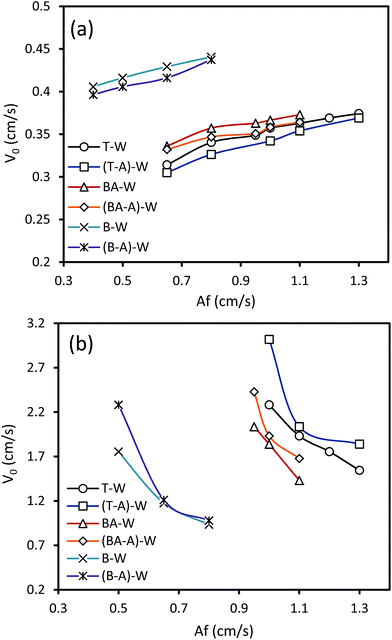 | ||
| Fig. 6 Effects of mass transfer on the characteristic velocity at Qc = 3 l h−1 and Qd = 3.5 l h−1: (a) horizontal section and (b) vertical section. | ||
Furthermore, it is found that the presence of mass transfer does not significantly alter the effects of the operating parameters on the characteristic velocity in a HVPSPC.
4.5. Predictive correlations for the characteristic velocity
The experimental data of the characteristic velocities in the horizontal and vertical sections were compared with the correlations developed by Khajenoori et al.27 and Thornton,30 respectively. Fig. 7 shows the predictive ability of these correlations. Comparing the experimental data with those calculated by the correlation of Khajenoori et al.27 for horizontal pulsed columns shows a noticeable deviation. This may be due to the fact that their correlation is not properly dimensionless, which causes miscalculation. However, by modifying their correlation constant from 0.013 to 0.047, an AARE of 28.6% is achieved with the experimental data obtained from this study, as shown in Fig. 7a. The correlation of Thornton30 also shows significant deviation from the experimental data. However, by applying the Schmidt and Miller31 correction to the Thornton's correlation, modifying the constant from 0.6 to 0.172, an AARE of 34% is obtained for toluene–water and butyl acetate–water. However, this poorly predicts the experimental data for the n-butanol–water system with an AARE of more than 340%, as shown in Fig. 7b. This may be because this correlation is proposed for Af > 1.2 cm s−1 and is not appropriate for lower pulsation intensities.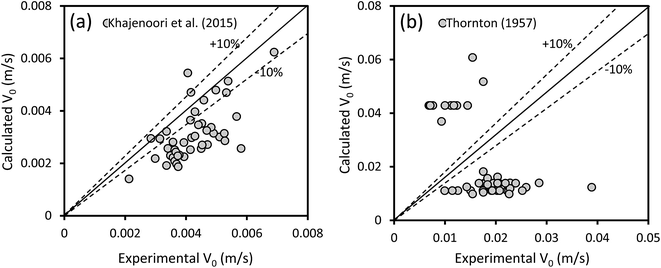 | ||
| Fig. 7 (a) Comparison of the experimental data of the characteristic velocity in the horizontal section with those obtained from the correlation of Khajenoori et al.27 and (b) comparison of the experimental data of the characteristic velocity in the vertical section with those obtained from the correlation of Thornton.30 | ||
Some previous correlations are difficult to employ because they require a priori knowledge, and the correlations proposed by Thornton30 and Khajenoori et al.27 cannot satisfactorily predict the experimental data in an HVPSPC; therefore, we propose new correlations to predict the characteristic velocity in terms of operating parameters, such as pulsation intensity, superficial velocities of the phases, and physical properties. Eqn (15) is proposed for the horizontal section of the column by using the analytical dimensionless method:
 | (15) |
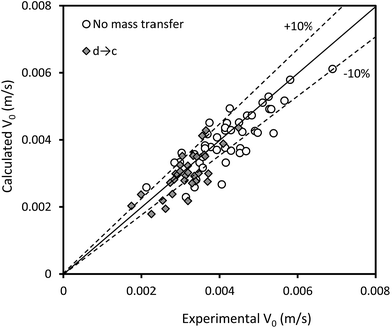 | ||
| Fig. 8 Comparison of the experimental characteristic velocities with those calculated by eqn (15). | ||
Another correlation to predict the characteristic velocity in the vertical section of the column is proposed by the dimensional analysis method as follows:
 | (16) |
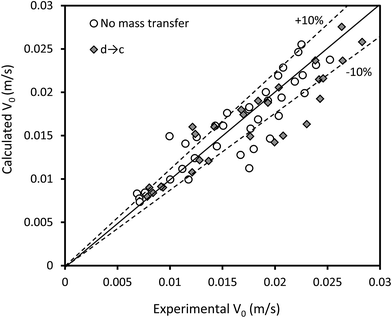 | ||
| Fig. 9 Comparison of the experimental characteristic velocities with those calculated by eqn (16). | ||
5. Conclusions
It is important to evaluate where a particular region changes to another to evaluate the performance of an extraction process. In this study, the regime transitions and characteristic velocities in a novel extractor, called a horizontal–vertical pulsed sieve-plate column (HVPSPC), have been investigated. Regarding the operating regime, it is found that there is a particular range of pulsation intensity in which both sections of the column can operate in the dispersion regime, resulting in higher column performance. Two correlations are proposed for estimating the regime transition in the column: one for the transition from the mixer-settler regime to the dispersion regime in the vertical section, and another for the transition from the dispersion regime to the emulsion regime in the horizontal section.Regarding the evaluation of the characteristic velocity, a number of available correlations for the determination of V0 were compared, and the effects of operating parameters, such as the pulsation intensity and flow rates of phases on V0, were investigated. The results show that as Af, Qc, and Qd increase, the value of the characteristic velocity increases in the horizontal section. Increasing interfacial tension leads to a reduction of V0, and the presence of mass transfer (d → c) leads to the formation of larger drops and higher holdup values, corresponding to the reduction of V0 in the horizontal section. However, different behavior is observed in the vertical section. It is found that V0 decreases with the increasing Af and Qc, whereas increasing Qd has the reverse effect, leading to higher values of V0. The results can be justified with respect to the variations of the holdup and superficial velocities. Furthermore, new correlations of V0 in terms of the physical properties and operating parameters are proposed, which have satisfactory predictive ability with average absolute relative errors (AAREs) ranging from 9.81% to 11.15%.
Nomenclature
| A | Amplitude of pulsation, m |
| Af | Pulsation intensity, m s−1 |
| C0 | Discharge coefficient for the flow through the perforations in a sieve plate (0.6) |
| D | Column diameter, m |
| do | Hole diameter, m |
| f | Frequency of pulsation, Hz |
| g | Acceleration due to gravity (9.81 m s−2) |
| h | Plate spacing, m |
| H | Column length, m |
| Q | Volumetric flow rate, m3 s−1 |
| V0 | Characteristic velocity, m s−1 |
| Vc | Superficial velocity of the continuous phase, m s−1 |
| Vd | Superficial velocity of the dispersed phase, m s−1 |
| Vs | Slip velocity, m s−1 |
| Vs∞ | Terminal velocity of a single drop in an infinite medium, m s−1 |
| z | Coalescence coefficient |
Greek symbols
| Δ | Average velocity of all material past the pulse plates averaged over the entire pulse cycle, m s−1 |
| α | Fractional free area |
| ε | Power dissipated per unit mass of fluid, W kg−1 |
| φ | Holdup |
| μ | Viscosity, N s m−2 |
| ξ | Mean fraction of the column cross-sectional area occupied by the column internals |
| ρ | Density, kg m−3 |
| Δρ | Density difference between two phases, kg m−3 |
| σ | Interfacial tension between two phases, N m−1 |
Subscripts
| h | Horizontal section |
| v | Vertical section |
| t | Transition between different the regimes |
References
- A. Warade, R. Gaikwad, R. Sapkal and V. Sapkal, Leonardo J. Sci., 2011, 79–94 Search PubMed.
- R. L. Yadav and A. W. Patwardhan, Chem. Eng. J., 2008, 138, 389–415 CrossRef CAS.
- A. R. Hemmati, M. Shirvani, M. Torab-Mostaedi and A. Ghaemi, RSC Adv., 2015, 5, 63025–63033 RSC.
- A. J. Melnyk, S. Vijayan and D. R. Woods, Can. J. Chem. Eng., 1992, 70, 417–425 CrossRef CAS.
- A. A. Hussain, T. B. Liang and M. J. Slater, Chem. Eng. Res. Des., 1988, 66, 541–554 CAS.
- J. Procházka and M. M. Hafez, Collect. Czech. Chem. Commun., 1972, 37, 3725–3734 CrossRef.
- D. Logsdail and J. Thornton, React. Technol., 1959, 1, 15–24 CAS.
- V. Vdovenko and S. Kulikov, Radiokhimiya, 1966, 8, 525–533 CAS.
- L. Zeng, Y. Zhang, C. Bukirwa, W. Li and Y. Yang, RSC Adv., 2015, 5, 89959–89970 RSC.
- M. Asadollahzadeh, M. Torab-Mostaedi, R. Torkaman and J. Safdari, RSC Adv., 2016, 6, 82496–82504 RSC.
- M. Asadollahzadeh, M. Torab-Mostaedi, S. Shahhosseini and A. Ghaemi, RSC Adv., 2015, 5, 95967–95980 RSC.
- T. Sato, K. Sugihara and I. Taniyama, Kagaku Kogaku, 1963, 27, 583–588 CrossRef.
- R. H. Sobotik and D. M. Himmelblau, AIChE J., 1960, 6, 619–624 CrossRef CAS.
- O. H. Koski, Pulsed Extraction Column, US Pat. 3,108,859, 1963, p. 6.
- G. Sege and F. Woodfield, Chem. Eng. Prog., 1954, 50, 396–402 CAS.
- L. D. Smoot, B. W. Mar and A. L. Babb, Ind. Eng. Chem., 1959, 51, 1005–1010 CrossRef CAS.
- G. A. Sehmel and A. L. Babb, Ind. Eng. Chem. Process Des. Dev., 1963, 2, 38–42 CAS.
- R. Berger, W. Leuckel and D. Wolf, Chem. Ind., 1978, 760–764 CAS.
- H. Haverland, Untersuchungen zur Tropfendispergierung in flüssigkeitspulsierten Siebboden-Extraktionskolonnen, TU Clausthal, 1988 Search PubMed.
- M. Torab-Mostaedi, J. Safdari, M. A. Moosavian and M. Ghannadi-Maragheh, Chem. Eng. Process., 2009, 48, 1249–1254 CrossRef CAS.
- A. Kumar and S. Hartland, Chem. Eng. Process., 1988, 23, 41–59 CrossRef CAS.
- K. Sreenivasulu, D. Venkatanarasaiah and Y. B. G. Varma, Bioprocess Eng., 1997, 17, 189–195 CrossRef CAS.
- A. Kumar and S. Hartland, Chem. Eng. Res. Des., 1983, 61, 248–252 CAS.
- L. Boyadzhiev and M. Spassov, Chem. Eng. Sci., 1982, 37, 337–340 CrossRef CAS.
- L. S. Tung and R. H. Luecke, Ind. Eng. Chem. Process Des. Dev., 1986, 25, 664–673 CAS.
- T. Miyauchi and H. Oya, AIChE J., 1965, 11, 395–402 CrossRef CAS.
- M. Khajenoori, J. Safdari, A. H. Asl and M. H. Mallah, Chem. Eng. Technol., 2015, 38, 1783–1792 CrossRef CAS.
- R. Gayler and H. R. C. Pratt, Trans. Inst. Chem. Eng., 1951, 29, 110–115 CAS.
- R. L. Gayler, N. W. Roberts and H. R. C. Pratt, Trans. Inst. Chem. Eng., 1953, 31, 57–68 CAS.
- J. Thornton, Trans. Inst. Chem. Eng., 1957, 35, 316–330 Search PubMed.
- H. Schmidt and H. Miller, KFK-Nachr., 1982, 14, 154–165 CAS.
- D. Logsdail and J. Thornton, Trans. Inst. Chem. Eng., 1957, 35, 331–342 Search PubMed.
- J. Godfrey and M. Slater, Chem. Eng. Res. Des., 1991, 69, 130–141 CAS.
- J. Richardson and W. Zaki, Trans. Inst. Chem. Eng., 1954, 32, 38–58 Search PubMed.
- M. J. Slater, Can. J. Chem. Eng., 1984, 62, 218–219 CrossRef.
- R. Letan and E. Kehat, AIChE J., 1965, 11, 804–809 CrossRef CAS.
- T. Míšek, Collect. Czech. Chem. Commun., 1963, 28, 1631–1644 CrossRef.
- A. Hamidi, M. van Berlo, K. C. Luyben and L. A. van der Wielen, J. Chem. Technol. Biotechnol., 1999, 74, 244–249 CrossRef CAS.
- A. D. Giraldo-Zuniga, J. S. R. Coimbra, L. A. Minim and E. E. Garcia Rojas, J. Food Eng., 2006, 72, 302–309 CrossRef.
- M. Napeida, A. Haghighi Asl, J. Safdari and M. Torab-Mostaedi, Chem. Eng. Res. Des., 2010, 88, 703–711 CrossRef CAS.
- M. Asadollahzadeh, M. Torab-Mostaedi, S. Shahhosseini and A. Ghaemi, Chem. Eng. Process., 2016, 100, 65–78 CrossRef CAS.
- T. Misek and J. Marek, Brains Chem. Eng., 1970, 15, 202–207 Search PubMed.
- J. Grace, T. Wairegi and T. Nguyen, Trans. Inst. Chem. Eng., 1976, 54, 167–173 CAS.
- W. Batey, T. Arthur, P. Thompson and J. Thornton, Proc. Int. Solvent Extr. Conf., 1983, 1, 166–167 Search PubMed.
- S. Zhu, B. Zhang, Z. Shen and J. Wang, J. Chem. Ind. Eng., 1982, 1, 12 Search PubMed.
- T. Míšek, R. Berger and J. Schröter, EFCE Publ. Ser., 1985, 46, 1 Search PubMed.
| This journal is © The Royal Society of Chemistry 2017 |

