 Open Access Article
Hierarchical macropore/nano surface regulates stem cell fate through a ROCK-related signaling pathway†
Houhua Pan abc,
Youtao Xiea,
Zequan Zhanga,
Kai Lia,
Dandan Hua,
Xuebin Zheng*a and
Tingting Tang*b
aKey Laboratory of Inorganic Coating Materials, Shanghai Institute of Ceramics, Chinese Academy of Sciences, 1295 Dingxi Road, Shanghai 200050, PR China. E-mail: xbzheng@mail.sic.ac.cn
bShanghai Key Laboratory of Orthopaedic Implants, Department of Orthopaedic Surgery, Shanghai Ninth People's Hospital, Shanghai JiaoTong University, School of Medicine, Shanghai 200011, PR China. E-mail: ttt@sjtu.edu.cn
cUniversity of Chinese Academy of Sciences, 19 Yuquan Road, Beijing 100049, PR China
First published on 25th January 2017
Abstract
A hierarchical macropore/nano implant surface has been considered as an effective approach to endow biomaterials with better osteogenic performance and long-term stability. The involvement of rho-associated kinase (ROCK) in hierarchical surface-induced osteogenesis, which might originate from the synergistic effect of macropores and nanostructures on cytoskeleton distribution, has previously been demonstrated. However, the underlying intracellular mechanisms are still largely unknown, and thus, this precludes the precise understanding of its cell surface interaction. In this study, it has been further proved that a ROCK-related signaling pathway might be important in translating the surface cues into BMSC fate. Results showed that different bone marrow stromal cell (BMSC) cytoskeleton distributions and corresponding ROCK activity, consequently exerted distinct effects on the FAK-ERK1/2 signaling pathway, which was finally responsible for the BMSC osteogenic differentiation performance. This study has indicated the probable role of ROCK-regulated cytoskeleton tension and its downstream signaling pathway in mediating the signals from topography cues for desirable osteogenic differentiation and furthermore, a probably distinct mechanotransduction process concerning different scales of topographies has been proposed, which might provide insights for use in advanced biomaterial surface design to attain better osteogenesis.
Introduction
Precise control of bone mesenchymal stem cell (BMSCs) differentiation to the desired lineage is a crucial issue in promoting quick formation of sound bone along an orthopedic metal implant. In recent years, information has accumulated on the importance of the physical factors that are always present in the cells' environment, being more durable, which can influence stem cell behavior with potency that rivals that of their biochemical counterpart.1,2 Among all the physical factors, one of the biggest concerns is the surface topography design of the implant surface. Ideal implant surfaces have always been believed to contain hierarchical structures. Natural bones are born with hierarchical structures, thus biomaterials that mimic hierarchical structures are supposed to direct the fate of BMSC in a similar way to what happens in the in vivo situation thus yielding better biological performance.3–5In previous work, hierarchical macropore/nano surfaces have been successfully fabricated by a combination of plasma sprayed coating and further alkaline or hydrothermal treatment, which provides abundant topographical cues on both the macro, micro and nano scale, and have indeed been proved to have better performance in triggering osteogenic differentiation. The probable involvement of rho-associated kinase (ROCK)-regulated cytoskeleton tension in enhancing MC3T3 cell osteogenesis, which might originate from the synergistic effect of macropores and nanotextures on its cytoskeleton distribution has recently been indicated.6–9 However, how the cytoskeleton status links to osteogenesis, that is, the detailed intracellular mechanism determining the osteogenic response on the hierarchical macropore/nano surface, is still largely unknown, which as a result precludes the precise understanding of its biological effect and increases the doubts about its clinical risk. Thus, it is necessary to further elucidate the detailed mechanism of the cell surface interaction on the hierarchically macroporous surface.
Mechanotransduction is the process by which influence exerted on cells by the extracellular surface properties are modulated by the endogenic force in cells and finally transmitted into the nucleus to induce adaptive cellular functional changes.10,11 Intracellular mechanotransduction is mostly initiated by cytoskeleton reorganization, transferred by cytoskeleton tension and translated by numerous signaling pathways.12,13 Focal adhesions (FAs) play an important role as a platform between the extracellular and intracellular environment and large amounts of kinase is located in FAs.14 There, focal adhesion kinase (FAK) behaves as a multifunctional intracellular effector which has been reported to play a pivotal role as an important activator of numerous signaling pathways, such as the extracellular signal-regulated kinase (ERK1/2) signaling pathway which is commonly considered to be an important regulator of osteogenesis.15,16 Focal adhesion is linked to actin through a specific protein, thus the FAs and FAK-related signaling pathway are likely to be managed by cytoskeleton tension.17 Seo et al.18 demonstrated that maturation of FAs as well as phosphorylation of FAK of cells on the micropatterned topography were regulated by the RhoA/ROCK pathway, which controlled cytoskeleton tension by regulating myosin activity. Xu et al.19 also reported a “signaling network” composed of RhoA/ROCK, cytoskeleton, and FAK that drives the mechanical stimuli-induced differentiation of mesenchymal stem cells. However, despite these studies, little of the existing research concentrated on BMSCs on a hierarchical surface which may exhibit distinct effects compared to normal surfaces, and the intrinsic difference between macro/micro/nano scales on intracellular mechanotransduction process were also seldom involved.
Informed by this knowledge, this study was dedicated to an in depth investigation and research into the detailed mechanism involving the mechanotransduction process by envisaging a situation where ROCK-regulated cytoskeleton tension and its downstream FAK-ERK1/2 signaling pathway might be decisive for the osteogenic commitment of BMSCs on the hierarchically macroporous surface. It would also be intriguing to see whether nano and macroporous structures in this study exerted their influence on intracellular mechanotransduction in a different way, which would finally distinguish the exact role and effect of these two partners. By inspecting the detailed cell surface interaction mechanism, more sophisticated knowledge of the effect of the hierarchical macropore/nano surface on titanium implants, was expected to be found, which would then provide insights for design of advanced bone biomaterials in the future.
Experiments
2.1 Sample preparation
Pure titanium foils (Ti) foils (TA1, Φ 10 mm × 2 mm and Φ 34 mm × 2 mm, Shenyang Zhonghang Titanium Co., Ltd) were used and modified as described previously.9 In brief, samples were firstly polished and some of these were as the control (PT). Then the rest of the samples treated with vacuum plasma spraying to fabricate the plasma sprayed titanium coating (TPS). PT and TPS samples were then subjected to hydrothermal treatment with 2.5 M sodium hydroxide solution at 15 °C for 15 h to generate the nano-modified Ti surface (NT) and nano-modified plasma sprayed coating (NTPS), respectively. The surface topography was inspected using field-emission scanning electron microscopy (Hitachi S-4800, Japan).2.2 Cell isolation and culture
Rat bone mesenchymal stem cells (BMSCs) were obtained from the bone marrow of four week old, male Sprague Dawley rats acquired from the Ninth People's Hospital Animal Center (Shanghai, China). Briefly, after deep euthanasia and cervical dislocation, both the femora and tibiae were dissected aseptically and soft tissues were detached, then the BMSCs were obtained by flushing the bone marrow from their tibias and femora bones. The BMSCs collected were seeded in culture dishes containing high glucose Dulbecco's modified Eagle's medium (Gibco BRL, Grand Island, USA) supplemented with 10% fetal bovine serum (HyClone) and 1% penicillin/streptomycin (Invitrogen). The medium was replaced after five days' culture, and then renewed every three days. BMSCs were passaged when reaching 80–90% confluence. BMSCs at passage 3–5 were used for the research in this study.2.3 Specific protein adsorption
A portion (1 ml) of normal culture medium mentioned previously, was added to each specimen in a 24-well plate and three replicates were used for each group. After 3 h of immersion, all the samples were transferred to new plates and washed gently with phosphate buffered saline (PBS). Adsorbed protein on the samples was detached using 500 μL of 1% sodium dodecyl sulfate (SDS) solution after shaking for 1 h. Then the fibronectin and vitronectin concentrations in the collected SDS solutions were assayed using enzyme-linked immunosorbent assay (ELISA) kits (Sigma).2.4 Cell morphology
Cells (2 × 10⁴ cells per well) were seeded on each sample in a 24-well plate using normal culture medium and three replicates were used for each group. After 24 h of incubation, specimens were gently washed with PBS, fixed in 2% glutaraldehyde (Sigma) at 4 °C overnight, and then dehydrated in a graded series of ethanol (30%, 50%, 70%, 90%, 100%, 100%) for 10 min each, and dried at 37 °C. Samples were sputter-coated with gold and then the cell morphology was observed using SEM. The final SEM picture was chosen as a typical representation of the cell observations.2.5 Alkaline phosphatase activity and matrix mineralization assay
Cells (5 × 10⁴ cells per well) were seeded on samples in a 48-well plate and three replicates were used for each group. To determine alkaline phosphatase (ALP) activity, after 7 and 14 days, the cells on specimens were treated with a 0.2% Triton X-100 solution during three standard freeze–thaw cycles. Then an ALP assay kit (Jiancheng, Nanjing, China) was used to determine the ALP activity. For the extracellular matrix (ECM) mineralization assay, after incubation for 14 or 21 days, cells were fixed for 15 min with 4% paraformaldehyde and then stained with an Alizarin Red staining kit (Sigma) for 10 min. Then, samples were thoroughly washed with distilled water to remove unbound stain. Finally, 10% cetylpyridinum chloride in 10 mM sodium phosphate (pH 7) was used to dissolve the remaining stain on the samples and the absorbance was measured at 590 nm.2.6 Western blotting
Cells (3 × 10⁵ cells per well) were seeded on samples in a 6-well plate and three replicates were used for each group. After three days, cells were lysed using radioimmunoprecipitation assay (RIPA) buffer with 1% protease inhibitor. Then equal amounts of extracts were separated using 10% sodium dodecyl sulfate-polyacrylamide gel electrophoresis (SDS-PAGE), and then transferred onto a poly(vinylidene fluoride) membrane (Millipore). After being blocked for 1 h with blotto (5% non-fat milk powder in PBS plus 0.1% Tween 20), membranes were incubated with the specific primary antibodies [Cell Signalling Technology (CST)] overnight at 4 °C, and then treated with the secondary antibody conjugated with horseradish peroxidase (CST) for 1 h at room temperature. Finally the blots were incubated in chemiluminescent reagents and then levels of the proteins of interest were detected (Thermo Scientific, Waltham, MA). In this study, levels of ROCK, pMYPT1, FAK, pFAK, ERK, protein kinase RNA-like endoplasmic reticulum kinase (pERK) and glyceraldehyde 3-phosphate dehydrogenase (GAPDH) were detected. The final western blot was chosen as a typical representative of all the blots obtained.2.7 Quantitative real-time PCR
Gene expressions in this study were examined using a quantitative real-time quantitative polymerase chain reaction (RT-qPCR). Cells (3 × 10⁵ cells per well) were seeded in a 6-well plate and three replicates were used for each group. After incubation for a certain number of days, total RNA was isolated using trizol reagent (Life Technologies), and reactions were performed using an ABI 7500 Real-Time PCR System (Applied Biosystems, USA) with a PCR kit (TaKaRa). In this study, the gene expressions of integrin β1, integrin α2, integrin α5 was assayed at day 3 and gene expressions of Runx2, type I collagen (COL I), and osteocalcin (OC) were evaluated at day 7, 14 and 21, respectively. All the values were normalized to GAPDH and presented as fold changes relative to those of the PT surface. Primes used in this study are listed in ESI Table 1.†2.8 Signaling pathway inhibition
ROCK, FAK and ERK were inhibited using a ROCK-specific inhibitor Y-27632 (Sigma, 10 μM), a FAK-specific inhibitor PF573228 (Sigma, 100 nM) and an ERK-specific inhibitor U0126 (Sigma, 10 μM). Inhibitors were added to standard culture media and renewed every two days. Experiments in the absence and presence of the inhibitors were performed as described in Section 2.6 and Section 2.7.2.9 Statistical analysis
All experiments were repeated three times independently, and data were expressed as the mean ± standard deviation. The statistical differences were determined using a one-way analysis of variance (ANOVA) followed by Student–Newman–Keuls post hoc tests or Student's t test and p < 0.05 was considered to be statistically significant.Results
3.1 Surface characterization and cell morphology
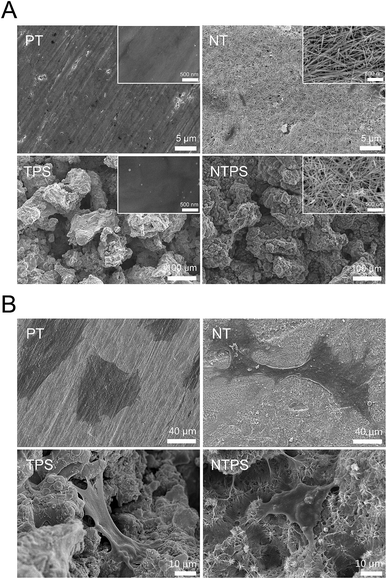
The topography of different surfaces is displayed in Fig. 1A and the insets are of higher magnification showing the nanoscale detail. The PT possessed no apparent micro or nano cues. After hydrothermal treatment, a nanowire texture (NT) appeared with diameters of approximately 20–50 nm. The TPS surface was composed of irregularly molten particles presenting a rough macroporous morphology on the whole, and nanoscale features could hardly be seen in the magnified image. For the NTPS sample, it was composed of both the macroporous topography observable at a lower magnification and the nanowire topography which could be seen at the higher magnification, which is a hierarchical macropore/nanowire surface topography. The BMSC morphology on different topographies were then examined (Fig. 1B). After incubation for 24 h, the BMSCs displayed dramatically different shapes on different surfaces. Generally a round morphology presented on the PT surface, with a less spread body and few filopodia. After introducing nanowires, there was enhanced cell spread and multi-directionally stretched morphology could be observed. Cells on the TPS surface were observed with an elongated body and limited long filopodia clinging to the relatively smooth coating surface, being endowed with a three-dimensionally (3-D) distributed and strained body with a large curved membrane. For the NTPS surface, a synergistic cytoskeleton distribution was observed. Unlike the merely spread body on NT or elongated and impending cytoskeleton on TPS, multidirectional outspread as well as cytoskeleton adapting to the rough surface were observed simultaneously. Considerable filopodia or lamellipodia could also be seen illustrating good interaction with the nanowire topography beneath. Meanwhile, some irregular protuberances on the membrane indicated that the cytoskeleton deformation was exerted by a rough surface beneath.3.2 Influence of different topographies on BMSC cell differentiation
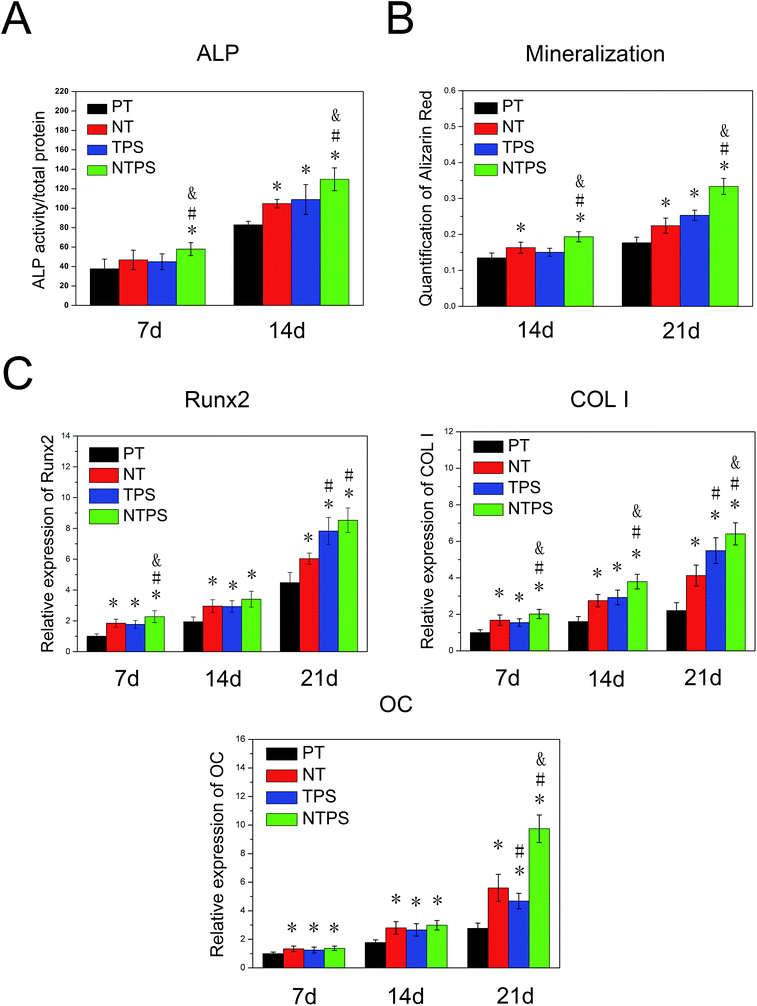
To assess the osteogenic tendency of BMSCs on different samples, ALP secretion and extracellular mineralization were quantitatively assayed and osteogenesis-related genes expressions including Runx2, COL I and OC were monitored using RT-qPCR. The results obtained demonstrated that the greatest ALP secretion and extracellular mineralization were obtained for the BMSCs on NTPS (Fig. 2A and B). For the osteogenesis-related gene expressions, all the targeted genes exhibited higher expression on the four surfaces with a prolonged culture time. In general, results also showed a similar trend with the NTPS surface leading to higher osteogenic gene expressions (Fig. 2C).3.3 Protein adsorption and integrin expression
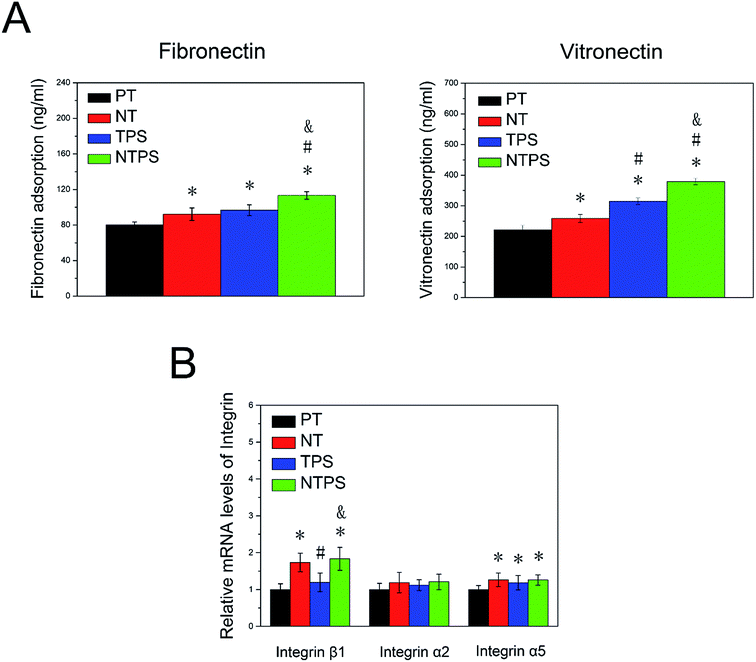
Because the BMSC morphology and differentiation behavior exhibited significant differences between these surfaces, we were committed to looking into the detailed mechanism. As the specific protein with arginylglycylaspartic acid (RGD) sequence adsorbed on the surface initiated the cell material interaction, the specific proteins including fibronectin and vitronectin adsorption on different samples were assayed (Fig. 3A). More fibronectin and vitronectin was adsorbed on NT and TPS compared to PT, however, the addition of nanowire into TPS contributed to further increase the protein adsorption of NTPS. To investigate if the membrane integrin was differentially expressed for cells on different surfaces, three subunits of integrin were assayed using RT-qPCT after two days. The NT and NTPS surface apparently increased the expression of integrin β1 rather than α2 and α5 when compared to PT, whereas little change was exhibited on the TPS surface (Fig. 3B).3.4 Influence of the different topographies on ROCK, FAK and ERK1/2 activity
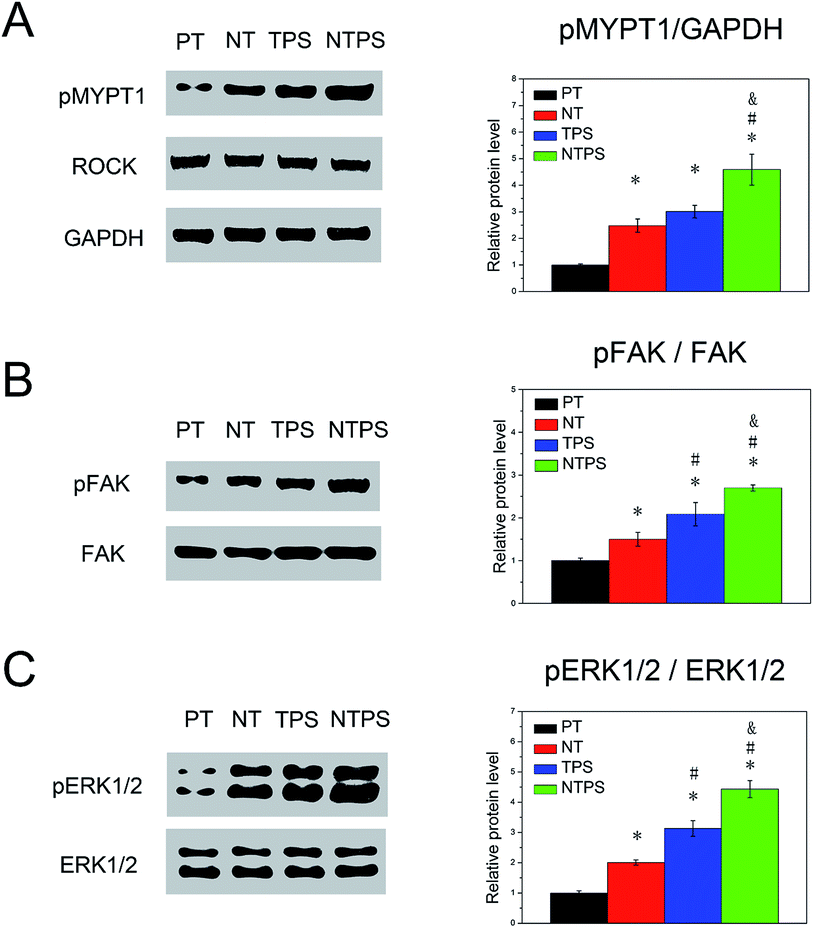
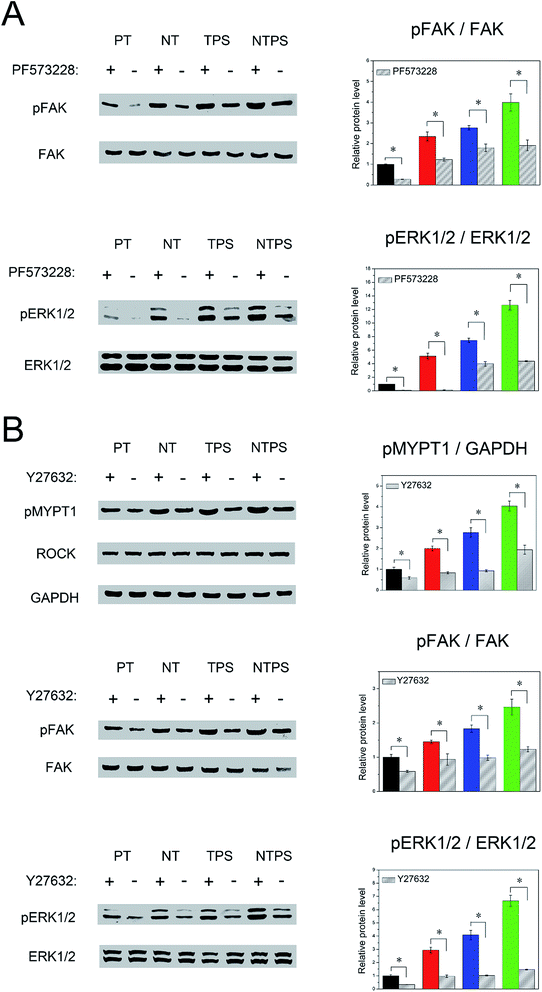
To examine whether BMSC morphology and cytoskeleton distribution were related to ROCK activity, phosphorylation of MYPT1, which is known to be one of ROCK's substrates, was assayed using western blots. As shown in Fig. 4A, NT and TPS both contributed to ROCK activation, whereas a higher ROCK activity was presented on NTPS. To investigate whether FAK and ERK1/2 were activated, phosphorylation of FAK and ERK1/2 were assayed using western blots. Results showed that increased pFAK and pERK1/2 levels could be observed on NT and TPS, whereas the NTPS surface gave rise to higher levels (Fig. 4B and C). In summary, similar trends were exhibited, with cells on the NTPS possessing higher ROCK activity as well as up-regulated FAK and ERK1/2 phosphorylation.3.5 Role of ROCK, FAK, and ERK1/2 in BMSC differentiation on different topographies
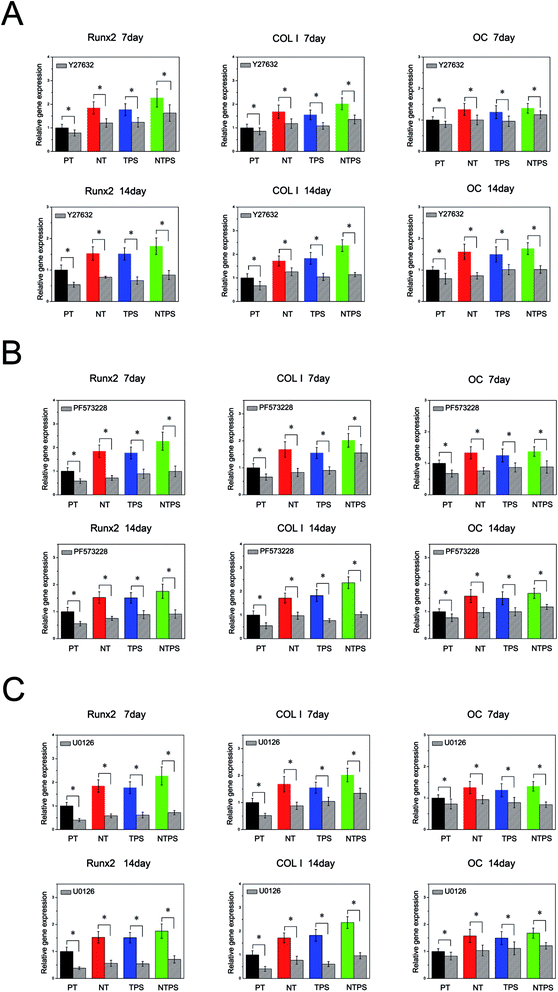
Because ROCK, FAK and ERK1/2 all showed a positive relationship with BMSC differentiation behavior, they were further inhibited to verify their involvement in BMSC differentiation. Firstly ROCK activation was inhibited with inhibitor Y27632 at 10 μM to assess the role of ROCK in BMSC differentiation. The osteogenesis-related gene expressions in the absence and presence of the inhibitor are shown in Fig. 5A. Y27632 exerted a dramatic inhibitory effect on BMSC differentiation on all four surfaces. Runx2, COL I and OC gene expressions significantly decreased in the existence of the ROCK inhibitor compared with the control. Also, the promoting effects of NT, TPS and NTPS on BMSC differentiation were largely removed. These results confirmed the role of ROCK in regulating BMSC differentiation. Next, FAK and ERK1/2 activation were both inhibited with PF573228 or U0126, to observe their influence. Similar trends to the ones obtained with ROCK inhibition were observed (Fig. 5B and C). Osteogenic gene expressions were significantly depressed for all the surfaces in the presence of inhibitor compared with the control, which revealed the involvement of FAK and ERK1/2 in topography-induced cell differentiation.3.6 Relationship between ROCK, FAK and ERK1/2 in the topography evoked mechanotransduction
As ROCK, FAK and ERK1/2 have been proved to participate in BMSC osteogenic fate decision, it was of interest to verify their mutual relationships. Firstly FAK was inhibited to observe its influence on ERK1/2 activity. After inhibition, FAK and ERK1/2 phosphorylation was largely downregulated for all groups (Fig. 6A). Finally, we wondered whether ROCK could regulate the FAK-ERK1/2 signaling pathway. Y27632 was subjected to all the samples, and after inhibition, phosphorylation of MYPT1, FAK and ERK1/2 was assayed. Decreased pMYPT1, pFAK and pERK1/2 level were both observed on all four surfaces (Fig. 6B). These results confirmed the upstream role of ROCK to the FAK-ERK1/2 signaling pathway.Discussion
A hierarchical macropore/nano surface has been shown to provide an excellent strategy for better osteogenic performance, and which tends is an ideal and innovative candidate for bone implant surface construction. However, because of the confusion about the detailed underlying mechanism, a clear understanding of the cell surface interaction was still unknown and this understanding is necessary for its further development. Previous work has proved that synergistic cytoskeleton distribution and increased ROCK activity might be responsible for its enhancing effect on MC3T3 osteogenic differentiation.9 This study further confirmed the role of the ROCK-FAK-ERK1/2 signaling pathway in the enhanced osteogenesis and indicated that the cytoskeleton tension-mediated intracellular mechanotransduction might play a pivotal role in the BMSC osteogenic fate commitment on the hierarchically macroporous surface, which could increase the awareness of the intrinsic characteristics of the hierarchical macro/nano surface.Cell surface interaction has been believed to be initiated from protein adsorption onto the implant surface. Nano-textures with probably an increased surface energy and hydrophilia are supposed to benefit protein adsorption especially some specific protein with an RGD sequence such as fibronectin, vitronectin and laminin.20,21 These adsorbed proteins then combine with integrins in cell membrane, which then assemble to form focal adhesion and are responsible for cell spread and migration.22,23 To confirm this, total protein, fibronectin and vitronectin adsorption were assayed as well as the three subunits of integrins in this study. Similar trends of considerable increase of protein adsorption were observed on the NT and NTPS surfaces when compared to PT and TPS, respectively, which confirmed the effective role of nanostructure on protein adsorption. For the TPS surface, although increased protein adsorption was also observed, it is probably mostly attributed to the large surface area of the rough macroporous structure, which means that the ability of protein adsorption of the TPS surface might hardly change and the adsorbed protein in the unit area might increase little when compared with PT. This hypothesis was partly verified by the integrin expression results whereas greatly enhanced integrin β1 expression could be seen on NT and NTPS surfaces but on the TPS. Next the BMSC morphologies on different topographies were observed, which were proved to correspond with the protein adsorption and integrin expression results. Well developed and multi-directional cytoskeleton distribution was observed on NT and this was probably because of its increased integrin expression, whereas the elongated body with poor spreading behavior and limited filopodia was exhibited on the TPS surface, which might be explained by the limited adhesion sites resulting from less expression of integrins.8 Nevertheless, cells on the TPS surface still came about large cytoskeleton deformation in terms of its 3-D distributed cell body and large curved membrane adapting to the rough macroporous topography beneath.24,25 The hierarchical NTPS surface naturally integrated the effects of the NT and TPS surface and synergistic cytoskeletal distribution was obtained with cells spreading well all around and simultaneously influenced by the coating's rough macroporous topography, which has also been observed for MC3T3 cells in a previous study.9
There has been a collection of evidence supporting the fact that the cell osteogenic fate is closely related to the cell morphology and cytoskeleton status directed by the underlying topography.26–28 A previous study has also proved the synergistic cytoskeleton distribution of MC3T3 cells on an hierarchical surface accompanied by enhanced ROCK activity finally led to improved osteogenesis.9 Thus, it was first wondered whether the hierarchical surface exerts the same influence on BMSCs. Results showed that a higher ROCK activity was observed on NTPS compared to the moderate levels of NT and TPS, which was in agreement with the characteristics of the cytoskeleton distribution. Next BMSC osteogenic differentiation on different topographies was examined. All the designed surface topographies, especially the NTPS surface, showed remarkable promotion on the BMSC osteogenic differentiation compared to the PT surface. To further study the correlation between ROCK and BMSC osteogenic differentiation, cells on all the samples were subjected to ROCK inhibition by Y27632. Removal of ROCK activity overruled the topography management of the BMSC osteogenic lineage orientation. All these results together have proved the key role of ROCK in topography induced BMSC differentiation, which was similar to the observation on MC3T3 cells.9 ROCK has been known to play an important role in cell contraction and generation of intracellular tension through regulating myosin activity by inhibiting myosin light chain phosphatase.18,29,30 Thus, the analysis result of ROCK activity in this study indicated the key role of cytoskeleton tension in BMSC osteogenic differentiation on an hierarchical surface.
Physical factors may direct stem cell differentiation via intracellular signaling pathways.31 Focal adhesion is known to be a comprehensive platform linking the “stem cell niche” to the intracellular environment in which FAK acts as a key signal transducer of the extracellular physical cues into biochemical signals through mechanotransduction.32 FAK is usually believed to be autophosphorylated at the Y397 site and followed by phosphorylation of the Src family tyrosine kinases.33 The Src family tyrosine kinases have been reported to activate mitogen-activated protein kinases (MAPK) family members, and then ERK1/2 acts as a pivotal trigger of release of downstream signaling molecules such as the transcription factor Runx2, which finally manipulates BMSC osteogenic fate.15,16 As focal adhesion is linked with the cytoskeleton, it was hypothesized that in this study the enhanced BMSC differentiation on the NTPS surface was initiated from enhanced ROCK activity as well as increased cytoskeleton tension and transferred by the FAK-ERK1/2 signaling pathway. To confirm this, the role of FAK and ERK and BMSC differentiation on different topographies were first examined. Western blotting results showed that cells on all the modified surfaces, especially the NTPS surface, were correlated with largely increased pFAK and pERK1/2 levels. In order to verify the roles of FAK and ERK1/2 in BMSC osteogenic differentiation inducement, inhibition of FAK and ERK1/2 was then applied to all samples. The specific inhibition of both FAK and ERK1/2 negated the upregulation of osteogenic markers on all topographies, explicitly demonstrating the involvement of FAK and ERK1/2 in induced BMSC differentiation. Because ROCK, FAK and ERK1/2 have been proved to be involved in BMSC differentiation, further study was performed to confirm the mutual interactions of ROCK, FAK and ERK1/2. A down-regulated pERK1/2 level was observed in the presence of PF573228, and employment of Y27632 successfully depressed both pFAK and pERK1/2 levels across all surfaces, which together confirmed the decisive role of ROCK in the FAK-ERK signaling pathway. Combining all these results, it was finally proved that the ROCK-FAK-ERK1/2 signaling pathway regulates BMSC osteogenic performance on an hierarchical surface, which also indicated that cytoskeleton tension-mediated mechanotransduction transduce topography cues into the BMSC osteogenic behaviors.
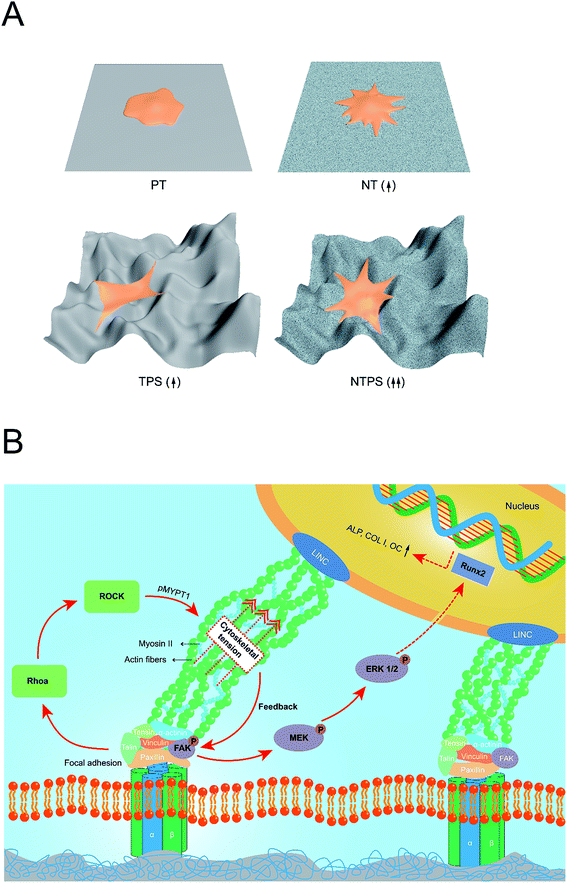
There have been several reports concerning the effect of surface cues on cytoskeleton tension and FAK-related signaling pathway, especially in nanostructures.14,16,32,34 However, few studies have concentrated on hierarchical structures especially to investigate whether different scales of surfaces play the same role in intracellular tension and activation of the related signaling pathway. In this study, the TPS surface with less integrin expression accompanied by probably inferior focal adhesion formation possessed a similarly enhanced pFAK level. This enhanced pFAK level on TPS might be attributed to the enhanced cytoskeleton tension activity but is not dependent on the integrin expression level, as revealed by higher ROCK activity. As focal adhesion and actin fibers are linked through a specific protein and work as a whole, the impending and strained body and the large curved membrane might generate elevated cytoskeleton tension and an extra pulling force on focal adhesion.35,36 FAK that undergoes tyrosine phosphorylation under force, has been supposed to change the configuration with increasingly applied tension and expose its cryptic sites, which makes it easier for autophosphorylation.2,37 Also, as kinases have been believed to be activated by exposure of cryptic specific peptide sequences, the 3-D distributed cytoskeleton with a large curved membrane might change the focal adhesion conformation as well as the cytoskeleton-FA pulling angle and consequently make it more accessible for cryptic specific peptide sequences of FAK, which also leads to enhanced activation of FAK.17,38 Furthermore, when introducing nanowire structures, the dual effect of NT and TPS on cytoskeleton distribution may come to confluence and a synergistic effect is obtained, manifesting a well-spread 3-D cytoskeleton as well as higher ROCK activity and increased cytoskeleton tension followed by more activation of the FAK-ERK1/2 signaling pathway, which eventually determined the BMSC osteogenic fate. A schematic was produced, which is shown in Fig. 7 gives a better idea of the whole mechanotransduction process. This study has presented a comprehensive comparison of nanoscale, macroscale and hierarchical macro/nano scale surfaces to give a glimpse of the “surface-cytoskeleton-signaling pathway” mechanotransduction process directing cell fate specification on specific implant surface.
Conclusion
In this study, the key role of the ROCK-regulated FAK-ERK1/2 signaling pathway in BMSC osteogenic fate on hierarchical macropore/nano surface has been proved. Synergistic cytoskeleton distribution accompanied by elevated ROCK activity was obtained on the hierarchical surface, which leads to higher cytoskeleton tension and activation of the FAK-ERK1/2 signaling pathway and eventually facilitate BMSC osteogenic differentiation on the hierarchical surface. Furthermore, a distinct mechanotransduction process might also exist which concerns the different scales of topography. The probable role of cytoskeleton tension-mediated mechanotransduction in regulating hierarchically macroporous surface-induced osteogenesis might give a further understanding of its cell surface interaction mechanism, which will provide an insight for the optimal design of desirable orthopedic implants in the future.Acknowledgements
This work was supported by the National Natural Science Foundation of China (Grant No. 51502328).References
- L. Z. Zhao, L. Liu, Z. F. Wu, Y. M. Zhang and P. K. Chu, Biomaterials, 2012, 33, 2629–2641 CrossRef CAS PubMed.
- W. L. Murphy, T. C. McDevitt and A. J. Engler, Nat. Mater., 2014, 13, 547–557 CrossRef CAS PubMed.
- L. Z. Zhao, S. L. Mei, P. K. Chu, Y. M. Zhang and Z. F. Wu, Biomaterials, 2010, 31, 5072–5082 CrossRef CAS PubMed.
- J. Tan and W. M. Saltzman, Biomaterials, 2004, 25, 3593–3601 CrossRef CAS PubMed.
- K. Kubo, N. Tsukimura, F. Iwasa, T. Ueno, L. Saruwatari, H. Aita, W. A. Chiou and T. Ogawa, Biomaterials, 2009, 30, 5319–5329 CrossRef CAS PubMed.
- W. C. Xue, X. Y. Liu, X. B. Zheng and C. X. Ding, Biomaterials, 2005, 26, 3029–3037 CrossRef CAS PubMed.
- Y. T. Xie, X. B. Zheng, L. P. Huang and C. X. Ding, J. Mater. Sci., 2012, 47, 1411–1417 CrossRef CAS.
- Y. T. Xie, H. Y. Ao, S. G. Xin, X. B. Zheng and C. X. Ding, Mater. Sci. Eng., C, 2014, 38, 272–277 CrossRef CAS PubMed.
- H. H. Pan, Y. T. Xie, K. Li, D. D. Hu, J. Zhao, X. B. Zheng and T. T. Tang, RSC Adv., 2015, 5, 101834–101842 RSC.
- Q. Liu, W. Wang, L. Zhang, L. Z. Zhao, W. Song, X. H. Duan and Y. M. Zhang, Biomaterials, 2014, 35, 6206–6218 CrossRef CAS PubMed.
- A. W. Holle and A. J. Engler, Curr. Opin. Biotechnol., 2011, 22, 648–654 CrossRef CAS PubMed.
- A. Mammoto and D. E. Ingber, Curr. Opin. Cell Biol., 2009, 21, 864–870 CrossRef CAS PubMed.
- H. W. Lv, L. S. Li, M. Y. Sun, Y. Zhang, L. Chen, Y. Rong and Y. L. Li, Stem Cell Res. Ther., 2015, 6, 1–11 CrossRef CAS PubMed.
- C. Y. Tay, C. G. Koh, N. S. Tan, D. T. Leong and L. P. Tan, Nanomedicine, 2013, 8, 623–638 CrossRef CAS PubMed.
- Y. R. V. Shih, K. F. Tseng, H. Y. Lai, C. H. Lin and O. K. Lee, J. Bone Miner. Res., 2011, 26, 730–738 CrossRef CAS PubMed.
- B. K. K. Teo, S. T. Wong, C. K. Lim, T. Y. S. Kung, C. H. Yap, Y. Ramagopal, L. H. Romer and E. K. F. Yim, ACS Nano, 2013, 7, 4785–4798 CrossRef CAS PubMed.
- A. S. Khalil, A. W. Xie and W. L. Murphy, ACS Chem. Biol., 2014, 9, 45–56 CrossRef CAS PubMed.
- C. H. Seo, K. Furukawa, K. Montagne, H. Jeong and T. Ushida, Biomaterials, 2011, 32, 9568–9575 CrossRef CAS PubMed.
- B. Y. Xu, G. B. Song, Y. Ju, X. Li, Y. H. Song and S. Watanabe, J. Cell. Physiol., 2012, 227, 2722–2729 CrossRef CAS PubMed.
- B. G. Keselowsky, D. M. Collard and A. J. Garcia, J. Biomed. Mater. Res., Part A, 2003, 66, 247–259 CrossRef PubMed.
- P. Roach, D. Farrar and C. C. Perry, J. Am. Chem. Soc., 2006, 128, 3939–3945 CrossRef CAS PubMed.
- D. V. Iwamoto and D. A. Calderwood, Curr. Opin. Cell Biol., 2015, 36, 41–47 CrossRef CAS PubMed.
- M. C. Sun, J. Deng, Z. C. Tang, J. D. Wu, D. Li, H. Chen and C. Y. Gao, Colloids Surf., B, 2014, 122, 134–142 CrossRef CAS PubMed.
- M. Estevez, E. Martinez, S. J. Yarwood, M. J. Dalby and J. Samitier, J. Biomed. Mater. Res., Part A, 2015, 103, 1659–1668 CrossRef PubMed.
- E. Martinez, E. Engel, J. A. Planell and J. Samitier, Ann. Anat., 2009, 191, 126–135 CrossRef CAS PubMed.
- D. Zhang and K. A. Kilian, Biomaterials, 2013, 34, 3962–3969 CrossRef CAS PubMed.
- D. Jhala and R. Vasita, Polym. Rev., 2015, 55, 561–595 CrossRef CAS.
- K. Kolind, K. W. Leong, F. Besenbacher and M. Foss, Biomaterials, 2012, 33, 6626–6633 CrossRef CAS PubMed.
- R. Guan, X. Xu, M. Chen, H. Hu, H. Ge, S. Wen, S. Zhou and R. Pi, Eur. J. Med. Chem., 2013, 70, 613–622 CrossRef CAS PubMed.
- T. Ozdemir, L. C. Xu, C. Siedlecki and J. L. Brown, Integr. Biol., 2013, 5, 1407–1416 RSC.
- J. Hao, Y. L. Zhang, D. Jing, Y. Shen, G. Tang, S. S. Huang and Z. H. Zhao, Acta Biomater., 2015, 20, 1–9 CrossRef PubMed.
- W. Q. Chen, Y. Shao, X. Li, G. Zhao and J. P. Fu, Nano Today, 2014, 9, 759–784 CrossRef CAS PubMed.
- D. W. Hamilton and D. M. Brunette, Biomaterials, 2007, 28, 1806–1819 CrossRef CAS PubMed.
- Y. Ogino, R. W. Liang, D. B. S. Mendonca, G. Mendonca, M. Nagasawa, K. Koyano and L. F. Cooper, J. Cell. Physiol., 2016, 231, 568–575 CrossRef CAS PubMed.
- V. Vogel and M. Sheetz, Nat. Rev. Mol. Cell Biol., 2006, 7, 265–275 CrossRef CAS PubMed.
- C. Huang, J. X. Dai and X. A. Zhang, Biochim. Biophys. Acta, Gen. Subj., 2015, 1850, 1261–1266 CrossRef CAS PubMed.
- A. M. Pasapera, I. C. Schneider, E. Rericha, D. D. Schlaepfer and C. M. Waterman, J. Cell Biol., 2010, 188, 877–890 CrossRef CAS PubMed.
- X. L. Liu and S. T. Wang, Chem. Soc. Rev., 2014, 43, 2385–2401 RSC.
Footnote |
| † Electronic supplementary information (ESI) available. See DOI: 10.1039/c6ra26509j |
| This journal is © The Royal Society of Chemistry 2017 |

