 Open Access Article
Creative Commons Attribution 3.0 Unported Licence
F-TiO2/P(VDF-HFP) hybrid films with enhanced dielectric permittivity and low dielectric loss†
Enjie Yu,
Qilong Zhang *,
Nuoxin Xu and
Hui Yang
School of Materials Science and Engineering, State Key Lab Silicon Mat, Zhejiang University, Hangzhou 310027, PR China. E-mail: mse237@zju.edu.cn
First published on 16th January 2017
Abstract
In this study, self-assembly flower-like TiO2 (F-TiO2) particles with an average diameter of 400 nm are synthesized via a facile one-pot solvothermal method. P(VDF-HFP)-based composites with F-TiO2 particles of different volume ratio as fillers are prepared. Microstructure and thermal analyses confirm that F-TiO2 does not change the crystallization process of the polymer matrix, but disrupts the crystallization degree of P(VDF-HFP). Dielectric properties measured at various frequencies and temperatures indicate that the addition of the F-TiO2 fillers enhances the dielectric constant of the composites, while the dielectric loss and electric conductivity do not significantly increase. The dielectric permittivity of the polymer nanocomposites is enhanced by 200% over that of the P(VDF-HFP) matrix at a filler content of 20 vol% while maintaining a rather low dielectric loss (0.043 at 1 kHz). Especially, the F-TiO2/P(VDF-HFP) composites exhibit low electric conductivity (≤10−11 S cm−1) at low frequencies. All the improved performances suggest an easy method to fabricate nanocomposites having potential electrical applications.
Introduction
Energy storage plays an important role in the field of mobile electronic devices, hybrid cars, and electric pulse equipment.1,2 Capacitors are one of the vital energy storage devices used in the modern electrical and electronics industry, whose advantages are fast charge/discharge speed, anti-aging cycle, stable performance, and so on. A capacitor stores energy through enriching the charge field between two plates, without substance diffusion. Capacitor dielectric material can be divided into two categories: ceramics and polymers. Common ceramic materials, such as barium titanate (BaTiO3), have a high dielectric constant, but low breakdown strength, high sintering temperature, brittleness, and high density. While polymers such as polyethylene and epoxy resin have high breakdown strength, flexibility and low density, but the low dielectric constant limits their energy density.3 Polymer–ceramic nanocomposites can combine the desirable properties of both polymers and ceramics to afford an excellent dielectric performance.4,5 Through certain methods, required composites can be designed and prepared to adapt to various kinds of demands, such as flexible and light capacitors for wearable devices.Ferroelectric or relaxor ferroelectric ceramic particles are generally used as fillers in polymer composites due to their high dielectric constants.6–10 However, these traditional giant dielectric materials always lead to reduction of energy storage efficiency, because of the large remnant polarization and high coercive electric field. In addition, the huge contrast in dielectric constants between the filler and the matrix may cause inhomogeneity of the electric fields and deterioration of the bulk dielectric properties finally.11–13 Hence, nonferroelectric materials with moderate dielectric constants, such as TiO2, Al2O3 and ZrO2, have been noted and investigated recently.14–18 However, the dielectric permittivity of nonferroelectric-filled composites is usually lower than that of their ferroelectric-filled counterparts. The morphology of fillers also plays a vital part in the dielectric properties of the composites according to new studies.19 Wu et al. utilized three-dimensional zinc oxide (ZnO) superstructures as fillers in the fabrication of inorganic-polymer composites. The result indicated the flower-like and walnut-like ZnO particles could significantly improve the dielectric constants of the polymer composites; however, the dielectric loss of nanocomposites increases drastically to 0.8 at 1 kHz.20 Some researchers improved the BaTiO3 filler in the polymer matrix through coating hydantoin epoxy resin21 or embedding in TiO2 fibers.22 To improve breakdown strength and energy density, Wang et al. designed sandwich-structured dielectric nanocomposites to block the growth of electrical trees effectively.23 In our previous study,24 flower-like TiO2 structure with an average diameter of ∼2.2 μm was prepared via a solvothermal process. And the flower-like TiO2 structure, which is self-assembled by numerous nanopetals, was incorporated into a P(VDF-HFP) polymer matrix. Similarly, the prepared films showed enhanced dielectric constant, but the dielectric loss of the composites is up to 1.05, with 20 vol% F-TiO2 loading at 100 Hz frequency.
We would like to investigate more deeply TiO2/P(VDF-HFP) nanocomposites for reducing the dielectric loss and shrinking the nanostructure size of TiO2 fillers to allow for a wider range of applications. Here, we try a new preparation method to obtain smaller and entirely different self-assembled F-TiO2 structure to decrease the dielectric loss. A flower-like TiO2 structure with an average diameter of 400 nm, self-assembled by bundles, was prepared via a direct solvothermal process. And then the prepared F-TiO2 particles were incorporated into a P(VDF-HFP) matrix by the solution blending method.25 The microstructure, thermal stability, and surface morphology of as-synthesized fillers as well as the composites are investigated systematically. In addition, the dielectric properties of the composites are also presented, which can indicate the influence of F-TiO2 on the polymer matrix. Hybrid films with low dielectric loss, low electric conductivity and enhanced dielectric permittivity were obtained.
Experimental
Materials
Tetrabutyl titanate (TBT), N,N-dimethylformamide (DMF), lithium acetate dihydrate and titanium oxide (anatase) were all of analytical grades and purchased from Aladdin Industrial Corporation, China. Acetic acid and ethanol were supplied by Sinopharm Chemical Reagent Co. Ltd, China. Poly(vinylidene fluoride-co-hexafluoropropylene) [P(VDF-HFP)] pellets were provided by Sigma-Aldrich. All chemicals were used as received without any further purification.Synthesis of flower-like TiO2 particles
In a typical synthesis, 0.6 g of lithium acetate dihydrate was dissolved in 50 mL of organic solvent containing 12 mL DMF and 18 mL acetic acid. After addition of 6 mL of TBT, the solution was transferred into a Teflon-lined stainless steel autoclave, and heated in an oven at 200 °C for 20 h. Finally, the product was collected and washed thoroughly with ethanol several times, and finally dried in a vacuum oven at 60 °C overnight. The as-synthesized flower-like TiO2 particles were further annealed in air at 350 °C for 3 h.Preparation of TiO2/P(VDF-HFP) composites
The typical procedures for the preparation of TiO2/P(VDF-HFP) composites were carried out as follows. P(VDF-HFP) was first dissolved in DMF, and the mixture was stirred for 4 h at room temperature. Then a required amount of TiO2 was dispersed in the solution by sonication for 1 h. After vigorously stirring at room temperature for 24 h, the uniform suspension was put in a vacuum dryer with pumping vacuum for 1 h to remove bubbles in the suspension. Then the suspension was poured on a clean glass plate and cast with a casting film machine at 80 °C. The film was dried in the casting film machine at 80 °C for 30 min and finally dried at 60 °C for 12 h to remove the residual solvent. Composites containing different volume fractions (5%, 10%, 15% and 20%) of TiO2 particles were prepared. The composite films were about 30–40 μm in thickness. For comparison, pure P(VDF-HFP) film was also prepared.Characterization
The crystalline phases of as-prepared powders and composites were identified by X-ray diffraction (XRD, EMPYREAN, PANalytical Co., The Netherlands) analysis with Cu Kα radiation. A field emission scanning electron microscopy (FESEM, S-4800, Hitachi Ltd, Japan) instrument was used to observe the morphology of the particles. HRTEM images were obtained with a transmission electron microscopy (TEM, Tecnai G2 F20, FEI Co., Netherlands) instrument operated at an accelerating voltage of 200 kV. The cross-sectional morphology of the films was observed using a FESEM (SU-70, Hitachi Ltd, Japan) instrument with all the samples freeze-fractured in liquid nitrogen before testing. Differential scanning calorimetry (DSC) was conducted using a PerkinElmer DSC-7 analyzer between 80 and 220 °C with a heating/cooling rate of 10 °C min−1 under a nitrogen atmosphere. Prior to electrical measurements, copper electrodes of 150 nm in thickness were evaporated on both surfaces of the films using a mask with 20 mm diameter eyelets. The dielectric properties of the samples were measured using a Novocontrol Alpha-N high resolution dielectric analyzer (GmbH Concept 40) in the frequency range of 1 to 107 Hz at several temperatures between −25 and 125 °C.Results and discussion
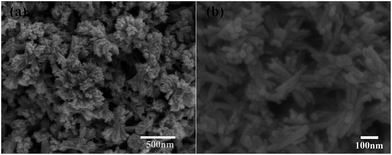
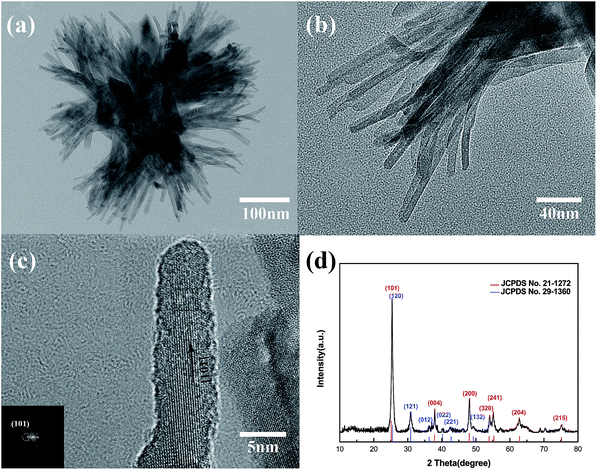
Fig. 1 shows the morphology of the solvothermal products. The as-prepared particles exhibit a flower-like morphology and they are uniform in shape and size with an average diameter of ca. 400 nm. It is found that the flower-like particles are composed of bundles in different orientations, and the bundles are linked at the middle organized into quasi-spheres. Detailed observations reveal that several nanorods with almost consistent orientation form the bundles and unfold at the heads. The flower-like structures would not collapse into scattered nanorods even after prolonged sonication or grinding and still retain the entire morphology independent of each other, proving that they are not random aggregations but ordered self-assemblies.26 Obviously, flower-like structure with smaller size is beneficial to prepare thin films.Fig. 2(a) shows a TEM image of the as-prepared particles. The TEM image of an individual as-prepared particle clearly reveals that the flower-like structure is self-assembled by bundles. According to Fig. 2(b), the diameter of bundles is about 80–100 nm, while that of nanorods is approximately 5–10 nm. The HRTEM image of the TiO2 nanorods is depicted in Fig. 2(c), in which the lattice fringes are clearly observed. The lattice fringes in a TiO2 nanorod are continuous; therefore each individual nanorod may be single-crystalline. The most obvious lattice fringe of 0.35 nm is attributed to (101) plane of the anatase phase, which is parallel to the longitudinal axis of the nanorod.27 Based on the above observations and the XRD analysis, the growth direction of the nanorods, which is equivalent to longitudinal axis for nanorods, is determined to be the [101] direction. Some lattice fringes of other phases can be observed in the HRTEM image, which belong to brookite. This can be verified by the XRD pattern in Fig. 2(d). Most diffraction peaks are assigned to anatase TiO2, marked by red lines in the figure, except for the peak at around 31° that might come from the trace impurity of brookite. The standard diffraction pattern of brookite phase is indicated by blue lines in Fig. 2(d), and they are fitted on the small peaks of impurity phase. Furthermore, because of the existence of brookite, the strongest peak at around 25° shifts from the (101) peak of the anatase phase. Therefore, the anatase phase is the main phase of the as-prepared TiO2, with a small amount of brookite phase impurity.
Fig. 3 presents the XRD patterns of flower-like TiO2 particles, pure P(VDF-HFP) and F-TiO2/P(VDF-HFP) composites with different volume fractions of F-TiO2. Three diffraction peaks at 2θ = 17.7°, 18.3° and 19.9° could be observed in the XRD pattern of pure P(VDF-HFP), corresponding to the diffractions in α-phase crystal planes (100), (020) and (110).28,29 Due to the closeness of the peaks, being at 2θ = 17.7° and 18.3°, and relatively low crystallinity, they can hardly be distinguished. Diffraction peaks from both anatase TiO2 fillers and P(VDF-HFP) matrix can be observed simultaneously in the XRD patterns of the composite films. Comparing the XRD patterns of F-TiO2 and of the composite films, the diffraction peaks of TiO2 are unchanged, implying that F-TiO2 keeps the original structure after incorporation into the composite films. With an increase of TiO2 content, the total intensity of α-P(VDF-HFP) characteristic peaks decreases gradually. This phenomenon indicates that the incorporation of TiO2 might play a major role in the crystallization behavior of the P(VDF-HFP) matrix.
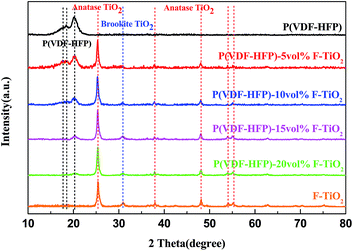 | ||
| Fig. 3 XRD patterns of flower-like TiO2 (F-TiO2) particles, pure P(VDF-HFP) and F-TiO2/P(VDF-HFP) composites with different volume fractions of F-TiO2. | ||
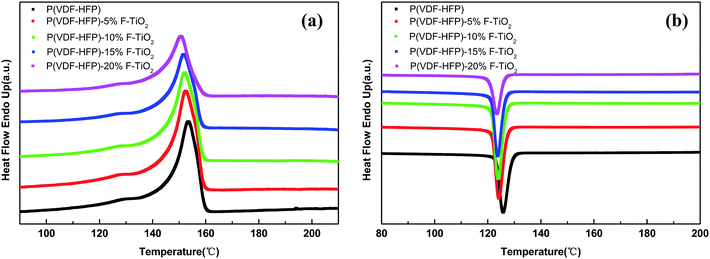
Fig. 4 shows results of DSC analysis, which was conducted to further investigate the influence of F-TiO2 particles on the crystallization behavior of the P(VDF-HFP) matrix. Fig. 4(a) and (b) show the heating and cooling curves of samples. According to Fig. 4(a), each sample exhibits only one single melting peak, the position of which shifts toward lower temperatures with increasing TiO2 content. The crystallinity (χc) of P(VDF-HFP) in the composites with F-TiO2 could be calculated according to the following formula:
| Sample | P(VDF-HFP) | 5 vol% F-TiO2 | 10 vol% F-TiO2 | 15 vol% F-TiO2 | 20 vol% F-TiO2 |
|---|---|---|---|---|---|
| Tm (°C) | 153.52 | 152.55 | 152.12 | 151.82 | 150.65 |
| χc (%) | 29.32 | 30.91 | 31.66 | 27.48 | 24.63 |
Fig. 5 shows the freeze-fractured cross sections of pure P(VDF-HFP) and the composite with 20 vol% F-TiO2 loading. As can be seen, the cross section of pure P(VDF-HFP) is smooth and dense. The cross section of the F-TiO2/P(VDF-HFP) composite hardly has pores and cracks, with some shallow pits due to the freeze-fracture process. Thus addition of F-TiO2 particles does not deteriorate the film quality of the composites. In addition, if there are particle agglomerates in the film, heterogeneous color distribution can be observed because of the contrast difference between TiO2 and polymers under SEM. This can be proved by high-magnification imaging as shown in Fig. S1 (ESI†). The loading particles can be observed homogeneously dispersed in the matrix without agglomeration. The thicknesses of both films are 20–30 μm, similar to those of the films with other F-TiO2 loadings. Because of the homogeneous distribution of the F-TiO2, the film with 20 vol% F-TiO2 loading can retain great flexibility. According to the picture in the upper right corner of Fig. 5(b), the film with 20 vol% F-TiO2 loading can be simply curled, implying that the film is still flexible.34
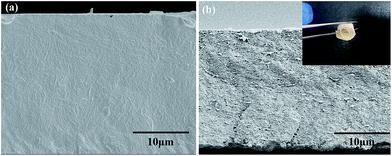 | ||
| Fig. 5 SEM images of (a) pure P(VDF-HFP) and (b) F-TiO2/P(VDF-HFP) composite with 20 vol% F-TiO2 loading. | ||
Fig. 6 presents the variations of the dielectric constant (εr), dielectric loss tangent (tan![[thin space (1/6-em)]](https://www.rsc.org/images/entities/char_2009.gif) δ) and electrical conductivity (σ) of P(VDF-HFP) and F-TiO2/P(VDF-HFP) composites with various F-TiO2 volume fractions as a function of frequency at room temperature. As illustrated in Fig. 6(a), the dielectric constant of the composites decreases with increasing frequency for all samples, and increases with increasing F-TiO2 content over the whole frequency range. Furthermore, the frequency dependence becomes stronger with an increase of F-TiO2 content in the composites, which is a typical characteristic of interfacial polarization.35 The frequency dependence behaviour suggests that the addition of the F-TiO2 strengthens the interfacial polarization effect of the composites. The dielectric constant of the 20 vol% sample can reach 29.6 at 1 Hz frequency, while that of the pure P(VDF-HFP) sample is 12.1. It is worth noticing that the dielectric constant of the 15 vol% sample is 27.5 at 1 Hz frequency, just slightly lower than that of the 20 vol% sample. What is more, the dielectric constant of the composite with 15 vol% F-TiO2 is higher than that of the composite with 20 vol% F-TiO2 at 10–1000 Hz frequencies, lower content and higher permittivity. This may mean that the addition of F-TiO2 above 20 vol% will not enhance the dielectric properties of the composites; instead it will have a deleterious effect on the mechanical properties. The dielectric loss tangent of P(VDF-HFP) and its composites also shows a strong dependence on the F-TiO2 content and the frequency, as presented in Fig. 6(b). For each sample, the dielectric loss tangent decreases with increasing frequency for 1–104 Hz frequency range, and increases with increasing frequency for 104 to 106 Hz frequency range. The dielectric loss tangent shows an increasing trend with increasing F-TiO2 content, because of more sources of space charge carriers in the system that are induced by the inorganic fillers.36 However, the dielectric loss tangent of the composite with 5 vol% F-TiO2 particles is even lower than that of the pure P(VDF-HFP) at all frequencies. For example, the dielectric loss tangent of the composite with 5 vol% F-TiO2 particles is 0.026 at 100 Hz frequency, whereas that of pure P(VDF-HFP) is 0.03. Moreover, the dielectric loss of each sample is lower than 0.1 at middle frequency (102 to 105 Hz). And the dielectric loss of the composite with 20 vol% F-TiO2 loading is 0.0748 at 100 Hz frequency. This is far below the 1.05 that we obtained in our previous work, as expected. This phenomenon can be interpreted by dipole orientation which also makes a contribution to the dielectric loss, confined by F-TiO2 fillers.37 The complex trend of dielectric loss with frequency may also be caused by the balance between space charge carriers and dipole orientation.38 Space charge carriers make the dominant contribution to the dielectric loss at low frequencies, while dipole orientation plays the main role at high frequencies. It is worth mentioning that the dielectric loss of composites with F-TiO2 fillers is even lower than that of pure P(VDF-HFP) at frequencies below 10 Hz and above 105 Hz. Fig. 6(c) shows that the electric conductivity of each sample increases with the increasing frequency, which is a typical trend of an insulator. Meanwhile, the electric conductivity increases with increasing F-TiO2 content, just like the trend of the dielectric loss tangent. Especially, the electric conductivity of each sample is lower than 10−11 S cm−1 at low frequencies, implying excellent insulation of the nanocomposites.39 As we know, the energy storage density normally is decided by the dielectric constant and the breakdown strength. A Weibull plot of the breakdown strength of the composites is shown in Fig. S2 (ESI†). All of the F-TiO2/P(VDF-HFP) composites could withstand a high electric field of over 75 MV m−1. And the breakdown strength of the composites decreases with increasing F-TiO2 loading. This is a common phenomenon for inorganic/polymer dielectric composites. Breakdown strength at the cumulative failure probability of 0.632 is usually regarded as the characteristic breakdown strength, as shown in Table S1 (ESI†).
δ) and electrical conductivity (σ) of P(VDF-HFP) and F-TiO2/P(VDF-HFP) composites with various F-TiO2 volume fractions as a function of frequency at room temperature. As illustrated in Fig. 6(a), the dielectric constant of the composites decreases with increasing frequency for all samples, and increases with increasing F-TiO2 content over the whole frequency range. Furthermore, the frequency dependence becomes stronger with an increase of F-TiO2 content in the composites, which is a typical characteristic of interfacial polarization.35 The frequency dependence behaviour suggests that the addition of the F-TiO2 strengthens the interfacial polarization effect of the composites. The dielectric constant of the 20 vol% sample can reach 29.6 at 1 Hz frequency, while that of the pure P(VDF-HFP) sample is 12.1. It is worth noticing that the dielectric constant of the 15 vol% sample is 27.5 at 1 Hz frequency, just slightly lower than that of the 20 vol% sample. What is more, the dielectric constant of the composite with 15 vol% F-TiO2 is higher than that of the composite with 20 vol% F-TiO2 at 10–1000 Hz frequencies, lower content and higher permittivity. This may mean that the addition of F-TiO2 above 20 vol% will not enhance the dielectric properties of the composites; instead it will have a deleterious effect on the mechanical properties. The dielectric loss tangent of P(VDF-HFP) and its composites also shows a strong dependence on the F-TiO2 content and the frequency, as presented in Fig. 6(b). For each sample, the dielectric loss tangent decreases with increasing frequency for 1–104 Hz frequency range, and increases with increasing frequency for 104 to 106 Hz frequency range. The dielectric loss tangent shows an increasing trend with increasing F-TiO2 content, because of more sources of space charge carriers in the system that are induced by the inorganic fillers.36 However, the dielectric loss tangent of the composite with 5 vol% F-TiO2 particles is even lower than that of the pure P(VDF-HFP) at all frequencies. For example, the dielectric loss tangent of the composite with 5 vol% F-TiO2 particles is 0.026 at 100 Hz frequency, whereas that of pure P(VDF-HFP) is 0.03. Moreover, the dielectric loss of each sample is lower than 0.1 at middle frequency (102 to 105 Hz). And the dielectric loss of the composite with 20 vol% F-TiO2 loading is 0.0748 at 100 Hz frequency. This is far below the 1.05 that we obtained in our previous work, as expected. This phenomenon can be interpreted by dipole orientation which also makes a contribution to the dielectric loss, confined by F-TiO2 fillers.37 The complex trend of dielectric loss with frequency may also be caused by the balance between space charge carriers and dipole orientation.38 Space charge carriers make the dominant contribution to the dielectric loss at low frequencies, while dipole orientation plays the main role at high frequencies. It is worth mentioning that the dielectric loss of composites with F-TiO2 fillers is even lower than that of pure P(VDF-HFP) at frequencies below 10 Hz and above 105 Hz. Fig. 6(c) shows that the electric conductivity of each sample increases with the increasing frequency, which is a typical trend of an insulator. Meanwhile, the electric conductivity increases with increasing F-TiO2 content, just like the trend of the dielectric loss tangent. Especially, the electric conductivity of each sample is lower than 10−11 S cm−1 at low frequencies, implying excellent insulation of the nanocomposites.39 As we know, the energy storage density normally is decided by the dielectric constant and the breakdown strength. A Weibull plot of the breakdown strength of the composites is shown in Fig. S2 (ESI†). All of the F-TiO2/P(VDF-HFP) composites could withstand a high electric field of over 75 MV m−1. And the breakdown strength of the composites decreases with increasing F-TiO2 loading. This is a common phenomenon for inorganic/polymer dielectric composites. Breakdown strength at the cumulative failure probability of 0.632 is usually regarded as the characteristic breakdown strength, as shown in Table S1 (ESI†).
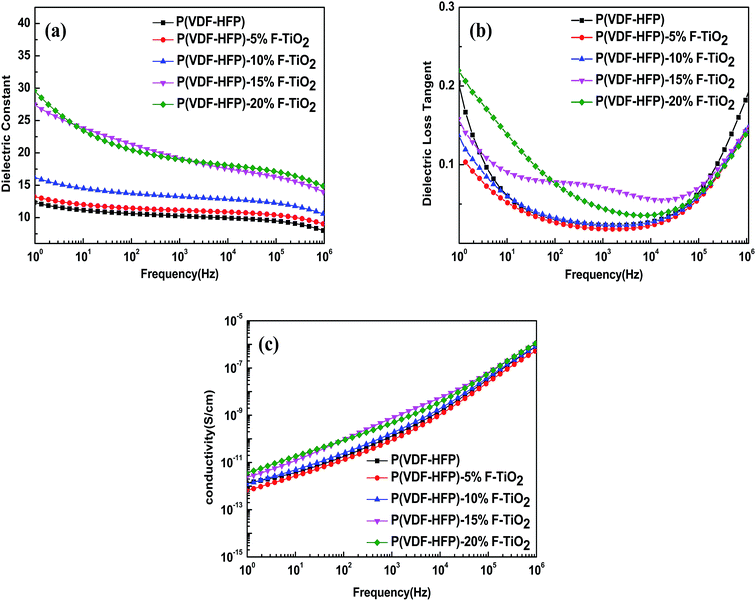 | ||
| Fig. 6 Frequency dependence of (a) dielectric constant, (b) dielectric loss and (c) conductivity of P(VDF-HFP) and TiO2/P(VDF-HFP) composites with different volume ratios of TiO2. | ||
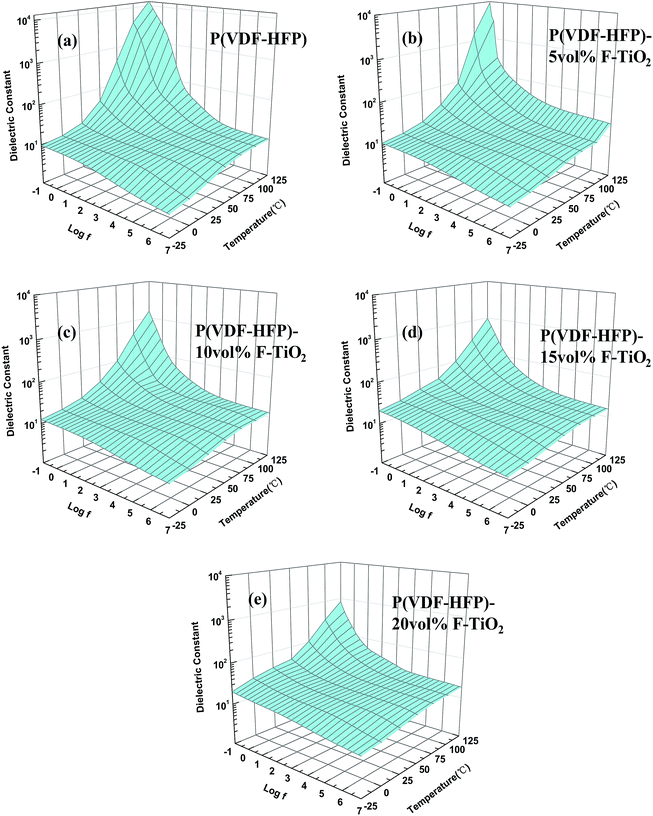
Fig. 7 shows the frequency dependence of the dielectric constant of P(VDFHFP) and TiO2/P(VDF-HFP) composites at various temperatures. Obviously, each sample presents a similar shape of 3-D curved surface. The dielectric constant of the samples increases with increasing temperature and increasing frequency, resulting in a landslide shape. This is caused by the movement of molecular chains increasing with increasing temperature, which will enhance orientation polarization. It leads to more induced charges, resulting in higher dielectric constants. The dielectric constant increases with increasing F-TiO2 particle content except at high temperatures and high frequencies. However, the dielectric constant decreases with increasing F-TiO2 particle content at high temperature and high frequency. Hence, the shape of the curved surface becomes flatter with increasing F-TiO2 content as shown in Fig. 7. This implies that the addition of F-TiO2 increases the interfacial polarization between TiO2 fillers and P(VDF-HFP) and reduces the orientation polarization from the movement of molecular chains. Therefore, F-TiO2 particles not only enhance the dielectric constant, but also elevate the temperature and the frequency stability of the dielectric constant. Considering the complex work environments of electronic devices, the dielectric stability is also an important parameter of the TiO2/P(VDF-HFP) composites. And the composites with nanometer grade F-TiO2 show very good dielectric stability, which was not pronounced in our previous studies.
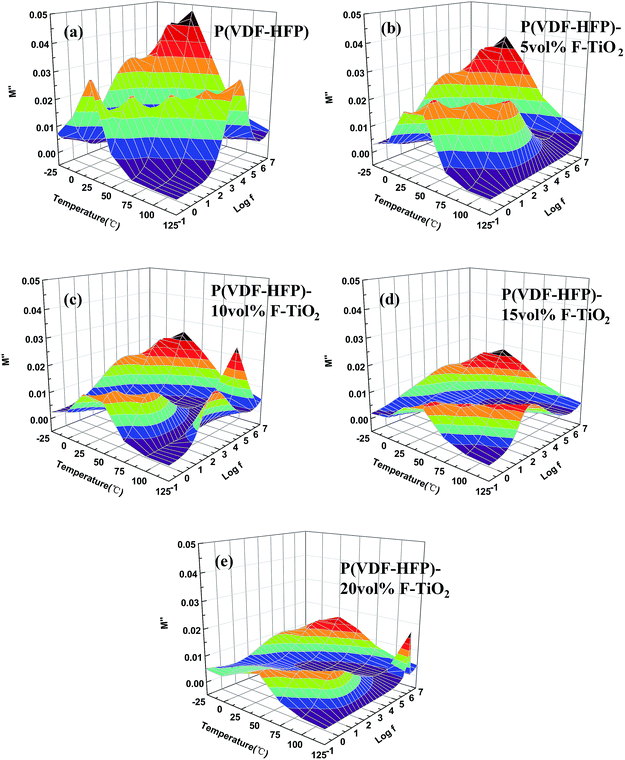
Electric modulus formalism is used to analyze the dielectric relaxation behaviors for an in-depth knowledge of the polarization of composites. The electric modulus formalism can minimize the parasitic effect of electrode polarization and reflect the relaxation existing in different energy environments.40 The imaginary part of the electric modulus (M′′), which takes the form of loss curves, is usually adopted to interpret the bulk relaxation properties. The frequency dependence of M′′ at various temperatures is shown in Fig. 8. A relaxation peak can be observed at high frequency and low temperature. This peak corresponds to the αa relaxation, which is related to the segmental motions in the amorphous region of P(VDF-HFP).41 Another peak present at lower frequencies and higher temperatures is associated with the interfacial polarization. And the peak frequency increases with increasing temperature, because of the reduction of the relaxation time at high temperature.42 The relaxation peak intensity of the F-TiO2/P(VDF-HFP) composites reduces with increasing TiO2 content, because the introduction of F-TiO2 particles confines the charge aggregation at the crystal/amorphous boundaries in the P(VDF-HFP) matrix. According to the M′′ spectra, we further analyze the polarization behaviors, and learn that the addition of F-TiO2 suppresses the charge aggregation to reduce the dielectric loss tangent.
Conclusions
In summary, small-size self-assembly flower-like TiO2 particles have been synthesized via a facile one-pot solvothermal method and P(VDF-HFP)-based nanocomposites with F-TiO2 particles as fillers have been prepared. Thermal and microstructural analyses show that the introduction of F-TiO2 fillers does not disrupt the crystallization process of the polymer matrix. According to dielectric measurements, the addition of the F-TiO2 fillers enhances the dielectric constant of the composites, while the dielectric loss does not significantly improve with increasing F-TiO2 filler content, even decreasing at some filler contents. For example, the dielectric permittivity of polymer nanocomposites was enhanced by 200% over the P(VDF-HFP) matrix at a filler content of 20 vol% while maintaining a rather low dielectric loss (0.043 at 1 kHz). Especially, the F-TiO2/P(VDF-HFP) composites exhibit low electric conductivity (≤10−11 S cm−1) at low frequencies. A detailed study concerning the temperature- and frequency-dependent dielectric properties of P(VDF-HFP)-based composites incorporating F-TiO2 particles indicates that interfacial polarization between F-TiO2 fillers and P(VDF-HFP) matrix is strengthened and orientation polarization from movement of molecular chains is confined, resulting in more stable dielectric properties. Our work can provide a feasible strategy of preparing high-performance polymer composites for electrical and electronic applications.Acknowledgements
The authors gratefully acknowledge the financial support from the National Key Scientific Research Project (no. 2016YFB0401501) and the Fundamental Research Funds for the Central Universities (no. 2015QNA4007).Notes and references
- J. J. Li, I. S. Seok, B. J. Chu, F. Dogan, Q. M. Zhang and Q. Wang, Adv. Mater., 2009, 21(2), 217–221 CrossRef CAS.
- Z. M. Dang, J. K. Yuan, J. W. Zha, T. Zhou, S. T. Li and G. H. Hu, Prog. Mater. Sci., 2011, 57(4), 660–723 CrossRef.
- M. Rahimabady, M. S. Mirshekarloo, K. Yao and L. Lu, Phys. Chem. Chem. Phys., 2013, 15(38), 16242–16248 RSC.
- M. Arbatti, X. Shan and Z. Y. Cheng, Adv. Mater., 2007, 19(10), 1369–1372 CrossRef CAS.
- X. R. Xiao, N. X. Xu, Y. C. Jiang, Q. L. Zhang, E. J. Yu and H. Yang, RSC Adv., 2016, 6(73), 69580–69585 RSC.
- L. Y. Xie, X. Y. Huang, C. Wu and P. K. Jiang, J. Mater. Chem., 2011, 21(16), 5897–5906 RSC.
- Z. M. Dang, H. Y. Wang and H. P. Xu, Appl. Phys. Lett., 2006, 89(11), 112902 CrossRef.
- H. X. Tang, Y. R. Lin, C. Andrews and H. A. Sodano, Nanotechnology, 2011, 22(1), 15702–15709 CrossRef PubMed.
- H. Luo, C. Chen, K. C. Zhou, X. F. Zhou, Z. Wu and D. Zhang, RSC Adv., 2015, 5(84), 68515–68522 RSC.
- Y. Bai, Z. Y. Cheng, V. Bharti, H. S. Xu and Q. M. Zhang, Appl. Phys. Lett., 2000, 76(25), 3804–3806 CrossRef CAS.
- Z. Li, L. A. Fredin, P. Tewari, S. A. DiBenedetto, M. T. Lanagan, M. A. Ratner and T. J. Marks, Chem. Mater., 2010, 22(18), 5154–5164 CrossRef CAS.
- K. Yu, Y. J. Niu, Y. Bai, Y. C. Zhou and H. Wang, Appl. Phys. Lett., 2013, 102(10), 102903 CrossRef.
- G. Q. Zhang, D. Brannum, D. X. Dong, L. X. Tang, E. Allahyarov, S. D. Tang, K. Kodweis, J. K. Lee and L. Zhu, Chem. Mater., 2016, 28(13), 4646–4660 CrossRef CAS.
- P. H. Hu, J. J. Wang, Y. Shen, Y. H. Lin and C. W. Nan, J. Mater. Chem., 2013, 1(39), 12321–12326 RSC.
- B. Balasubramanian, K. L. Kraemer, S. R. Valloppilly, S. Ducharme and D. J. Sellmyer, Nanotechnology, 2011, 22, 405605 CrossRef PubMed.
- P. Khodaparast and Z. Ounaies, IEEE Trans. Dielectr. Electr. Insul., 2013, 20, 166–176 CrossRef CAS.
- M. N. Tchoul, S. P. Fillery, H. Koerner, L. F. Drummy, F. T. Oyerokun and P. A. Mirau, Chem. Mater., 2010, 22, 1749–1759 CrossRef CAS.
- B. Chu, M. Lin, B. Neese and Q. J. Zhang, J. Appl. Phys., 2009, 105, 14103 CrossRef.
- R. Sun, Z. D. Luo, D. W. Zhang, Y. Liu, Z. P. Wang, J. N. Li, J. H. Bian, Y. X. Li, X. H. Hu, J. H. Gao and Y. D. Yang, J. Phys. Chem. C, 2016, 120, 11769–11776 Search PubMed.
- W. Wu, X. Y. Huang, S. T. Li, P. K. Jiang and T. Toshikatsu, J. Phys. Chem. C, 2012, 116, 24887–24895 CAS.
- H. Luo, D. Zhang, C. Jiang, X. Yuan, C. Chen and K. C. Zhou, ACS Appl. Mater. Interfaces, 2015, 7(15), 8061–8069 CAS.
- X. Zhang, W. W. Chen, J. J. Wang, Y. Shen, L. Gu, Y. H. Lin and C. W. Nan, Nanoscale, 2016, 6, 6701–6709 RSC.
- Y. F. Wang, J. Cui, Q. B. Yuan, Y. J. Niu, Y. Y. Bai and H. Wang, Adv. Mater., 2015, 27(42), 6658–6663 CrossRef CAS PubMed.
- N. X. Xu, L. Hu, Q. L. Zhang, X. R. Xiao, H. Yang and E. J. Yu, ACS Appl. Mater. Interfaces, 2015, 7, 27373–27381 CAS.
- H. B. Wu, H. H. Hng and X. W. Lou, Adv. Mater., 2012, 24(19), 2567–2571 CrossRef CAS PubMed.
- X. J. Sun, J. W. Wang, Y. Xing, Y. Zhao, X. C. Liu, B. Liu and S. Y. Hou, CrystEngComm, 2011, 13, 367–370 RSC.
- J. Li and D. Xu, Chem. Commun., 2010, 46, 2301 RSC.
- A. M. Stephan, K. S. Nahm, M. A. Kulandainathan, G. Ravi and J. Wilson, Eur. Polym. J., 2006, 42(8), 1728–1734 CrossRef CAS.
- V. Tomer, E. Manias and C. A. Randall, J. Appl. Phys., 2011, 110, 044107 CrossRef.
- L. L. Sun, B. Li, Z. G. Zhang and W. H. Zhong, Eur. Polym. J., 2010, 46, 2112–2119 CrossRef CAS.
- S. H. Liu, J. W. Zhai, J. W. Wang, S. X. Xue and W. Q. Zhang, ACS Appl. Mater. Interfaces, 2014, 6, 1533–1540 CAS.
- K. Yang, X. Y. Huang, L. J. Fang, J. L. He and P. K. Jiang, Nanoscale, 2014, 6, 14740–14753 RSC.
- X. R. Xiao, H. Yang, N. X. Xu, L. Hu and Q. L. Zhang, RSC Adv., 2015, 5, 79342–79347 RSC.
- Q. G. Chi, J. Sun, C. H. Zhang, G. Liu, J. Q. Lin, Y. N. Wang, X. Wang and Q. Q. Lei, J. Mater. Chem. C, 2014, 2, 172–177 RSC.
- D. Yu, N. X. Xu, L. Hu, Q. L. Zhang and H. Yang, J. Mater. Chem. C, 2015, 3, 4016–4022 RSC.
- G. S. Wang, Y. Y. Wu, X. J. Zhang, Y. Li, L. Guo and M. S. Cao, J. Mater. Chem. A, 2014, 2, 8644–8651 CAS.
- T. C. Wang, H. H. Li, F. Wang, J. M. Schultz and S. Yan, Polym. Chem., 2011, 2, 1688–1698 RSC.
- L. Y. Xie, X. Y. Huang, Y. H. Huang, K. Yang and P. K. Jiang, ACS Appl. Mater. Interfaces, 2013, 5, 1747–1756 CAS.
- N. Suzuki, Y. Kamachi, Y. D. Chiang, K. C.-W. Wu, S. Ishihara, K. Sato, N. Fukata, M. Matsuura, K. Maekawa, H. Tanabe, K. Ariga and Y. Yamauchi, CrystEngComm, 2013, 15, 4404–4407 RSC.
- G. Ioannou, A. Patsidis and G. C. Psarras, Composites, Part A, 2011, 42, 104–110 CrossRef.
- G. A. Kontos, A. L. Soulintzis, P. K. Karahaliou, G. C. Psarras, S. N. Georga, C. A. Krontiras and M. N. Pisanias, eXPRESS Polym. Lett., 2007, 1, 781–789 CrossRef CAS.
- L. Y. Xie, X. Y. Huang, B. W. Li, C. Y. Zhi, T. Tanaka and P. K. Jiang, Phys. Chem. Chem. Phys., 2013, 15, 17560–17569 RSC.
Footnote |
| † Electronic supplementary information (ESI) available. See DOI: 10.1039/c6ra26772f |
| This journal is © The Royal Society of Chemistry 2017 |

