 Open Access Article
The effect of acid/alkali treatment on the catalytic combustion activity of manganese oxide octahedral molecular sieves†
Ming Sun *,
Bentian Zhang,
Hengfa Liu,
Binbin He,
Fei Ye,
Lin Yu,
Changyong Sun and
Hongli Wen
Key Laboratory of Clean Chemistry Technology of Guangdong Regular Higher Education Institutions, School of Chemical Engineering and Light Industry, Guangdong University of Technology, 510006 Guangzhou, P. R. China. E-mail: sunmgz@gdut.edu.cn; Fax: +86-20-39322231; Tel: +86-20-39322202
First published on 16th January 2017
Abstract
Manganese oxide octahedral molecular sieves (OMS-2) are a type of widely applied catalyst for its excellent catalytic properties and competitive price. We use CH3COOH and KOH to modify the microstructure, the concentration of K+, the acidity, the redox properties and the oxygen vacancies of the OMS-2 materials. The acid-treated OMS-2 displays superior catalytic combustion activities in dimethyl ether combustion (T10 of 170 °C and T90 of 230 °C, Ea of 64.7 kJ mol−1) and toluene combustion (T10 of 170 °C and T90 of 194 °C, Ea of 62.4 kJ mol−1), whereas the alkali treatment imposes a negative effect on the catalytic activity. The superior activity of the acid-treated OMS-2 can be ascribed to the richer surface oxygen, higher oxygen mobility and redox properties, and stronger acidic sites of the catalyst.
1. Introduction
MnO2 presents a wide diversity of morphologies and crystal structures, including α-, β-, γ-, δ-, ε-MnO2, etc. Among these polymorphic forms, manganese oxide octahedral molecular sieves (OMS-2), namely the cryptomelane structure of α-MnO2, has attracted special attention for its outstanding properties such as low cost, multiple sources, porous structure, mixed valance of Mn, and notable redox activity.1,2 This material has found wide application in the field of catalysis and electrochemistry (supercapacitors, lithium-ion batteries, fuel cells, etc.3,4). As for the application in catalysis, especially in the domain of environmental science, the OMS-2 catalyst has been extensively studied for oxidation of CO, O3 and soot,5–8 and the volatile organic carbon compounds (formaldehyde and acetaldehyde,9,10 ethanol,11 benzene,12 toluene,13–15 hexachlorobenzene,16 ethyl acetate,17,18 o-xylene,19 etc.).To improve the catalytic activity of the OMS-2 material, doping with the transition metal or noble metal (Fe, Co, Ni, Cu, Ce, Ag, Pd, Zr10,20–27), is one of the most effective approaches. The doping measurement can modify the surface/structure properties of OMS-2, especially the redox activity, which could lead to an enhancement in the catalytic performance. In this study, we used a facile way to modify the OMS-2 material. The OMS-2 catalyst was simply treated with the solution of inorganic acid (CH3COOH, HAc) or alkali (KOH). The treatment protocol is fixed by considering the following evidences: (1) the OMS-2 contains 2 × 2 tunnel structure with K+ in the tunnel, and the K+ concentration can affect the catalytic and electrochemical activity.28,29 Therefore, it is possible to adjust the catalytic property through the substitution of K+ by other alkali metal ions (Li, Na, Cs) or H+.17,18,21,30,31 (2) The etching by acid. Metal oxides have some special O-terminated facets which could react with H+. The post etching process has been applied to obtain high performance γ-MnO2-like material by selective dissolution of LaMnO3 with HNO3,32 to create with newly formed oxygen defect over the surface of La0.5Sr0.5CoO3,33 to produce highly defective CeO2 by HNO3,34 to modify the micro-surface of Cu2O forming pinhole or zigzag with acetic acid,35 and to restructure Co3O4 from polycrystalline microspheres to single-crystalline polyhedra by HAc,36 etc. Through the acid/alkali treatment, we aimed to control the K+ concentration and to modify the OMS-2 structure forming defects or oxygen vacancies, thus achieving an enhanced catalytic activities.
Catalytic combustion is an important technology used widely in the field of energy-transforming and environmental protection. Catalytic combustion could promote the combustion efficiency and decrease the discharge of CO and hydrocarbons in the combustion of methane,37 LPG or dimethyl ether (DME). Catalytic combustion is also an effective technology to eliminate volatile organic compounds (VOCs). Among the materials for catalytic combustion, manganese oxides have been considered as the promising low-temperature catalyst. To evaluate the effect of the acid/alkali treatment on OMS-2, herein, we applied the OMS-2 catalysts in the catalytic combustion of DME and toluene, respectively, and discussed the relationship between surface/structure properties and their catalytic performance.
2. Experimental
All of the chemical reagents were of analytical grade and were used as received without further purification. KMnO4, MnSO4·H2O, HNO3 (68%), CH3COOH (HAc), KOH were all purchased from Guangzhou Chemical Reagent Company.2.1 Catalysts preparation
The OMS-2 material was prepared by a refluxing methods as reported previously.38 The KMnO4 solution was added into an acidified MnSO4 solution to achieve a MnO4−/Mn2+ molar ratio of 0.76. The mixtures were then refluxed at 100 °C for 24 h. After the reaction, the product was filtered, washed with deionized water thoroughly, and then dried at 60 °C overnight to get final sample.2.2 Materials characterization
The X-ray diffraction patterns (XRD) were characterized with a MSAL-XDII X-ray diffractometer (40 kV, 20 mA, Cu Kα radiation) at a scan rate of 5° min−1. The data were collected at a 0.01° step from 10° to 80°. The scanning electron microscopy (SEM) images were obtained by using SU8020 instrument. The high-resolution transmission electron microscopy (HRTEM) images were recorded on a FEI Tecnai G20 operating at an accelerating voltage of 200 kV. Temperature programmed reduction of hydrogen (H2-TPR) and oxygen desorption (O2-TPD) measurement were carried out on a Micromeritics AutoChem 2920 chemisorption analyzer equipped with a TCD detector. For TPR test, about 30 mg of sample was loaded in a U-shaped tube and pretreated at 200 °C in a flow of Ar for 1 h. After cooling to room temperature, the catalyst was then heated at a rate of 10 °C min−1 to 600 °C in a flowing mixture of H2 and Ar (50 mL min−1, 5 vol% H2/Ar). For TPD test, 100 mg of catalyst was pretreated under He atmosphere at 300 °C for 30 min, and then cooled to room temperature, followed by exposing to O2 for 30 min. Then, it was blown using He to remove the physically absorbed oxygen and subsequently heated to 900 °C in flowing He. Ammonia temperature-programmed desorption (NH3-TPD) measurement was carried out by a Quantachrome instrument. For NH3-TPD, 100 mg of the sample was preheated in a flow of dry N2 at 350 °C for 1 h in a fixed-bed quartz flow reactor. After preheating, NH3 adsorption was done at room temperature by passing 1000 ppm NH3 in N2 gas mixture at a flow rate of 150 mL min−1 for 90 min. The sample was then flushed with a steady flow of N2 to remove the surface physically adsorbed NH3. After the flushing, the catalyst was heated under a flow of N2 from room temperature to 450 °C with a temperature ramp of 10 °C min−1. X-ray photoelectron spectroscopy (XPS) data was obtained by a VG MultiLab 2000 electron spectrometer with an Mg Kα X-ray source. The spectra were calibrated using the carbon peak. The spectra were deconvoluted using the XPSPEAK software. The element compositions were analyzed by inductively coupled plasma-atomic emission spectroscopy (ICP-AES, PROFILE SPEC).2.3 Catalytic activity
The catalytic combustion of DME was tested at atmospheric pressure in a continuous flow fixed-bed quartz reactor (8 mm i.d.). 100 mg of the catalyst was loaded in the middle of the reactor supported by quartz wool. The catalysts (40–60 meshes) were pretreated for 1 h with 20% O2 in He at 250 °C, followed by cooling to the reaction temperature in the same gas. A gas mixture of DME, oxygen and helium were co-feed into the reactor with the volume ratio of 1![[thin space (1/6-em)]](https://www.rsc.org/images/entities/char_2009.gif) :
:![[thin space (1/6-em)]](https://www.rsc.org/images/entities/char_2009.gif) 10
10![[thin space (1/6-em)]](https://www.rsc.org/images/entities/char_2009.gif) :
:![[thin space (1/6-em)]](https://www.rsc.org/images/entities/char_2009.gif) 40, and the total gas hourly space velocity (GHSV) was fixed at 30
40, and the total gas hourly space velocity (GHSV) was fixed at 30![[thin space (1/6-em)]](https://www.rsc.org/images/entities/char_2009.gif) 000 h−1. The out-flow gas was analyzed using Agilent 6820 gas chromatograph, with a methyl silicone capillary column (ATSE-30) connected to a flame ionization detector.
000 h−1. The out-flow gas was analyzed using Agilent 6820 gas chromatograph, with a methyl silicone capillary column (ATSE-30) connected to a flame ionization detector.
The catalytic combustion of toluene was tested in a similar equipment. The loading catalyst was also 100 mg. The concentration of toluene was 4 g m−3 and the GHSV was 20![[thin space (1/6-em)]](https://www.rsc.org/images/entities/char_2009.gif) 000 h−1. The catalytic activity is characterized by parameter T10 and T90, indicating the temperature at which DME or toluene conversion reaches 10% and 90%, respectively.
000 h−1. The catalytic activity is characterized by parameter T10 and T90, indicating the temperature at which DME or toluene conversion reaches 10% and 90%, respectively.
3. Results and discussion
3.1 Structure and surface properties of the OMS-2 catalysts
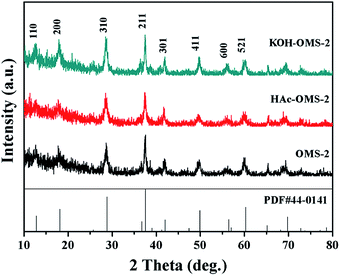
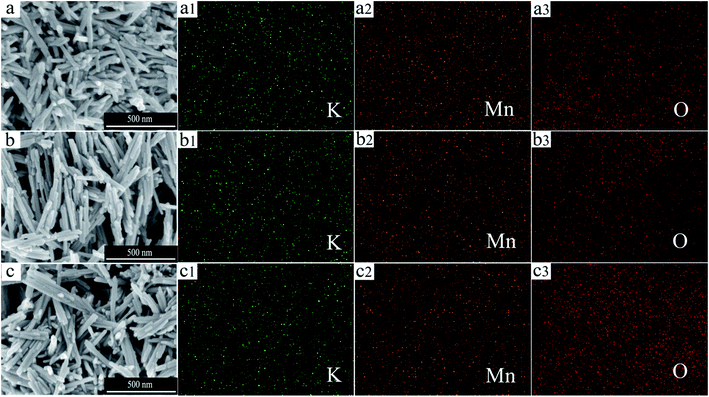
The crystal structure and the phase purity of the catalysts were investigated by XRD as shown in Fig. 1. All the patterns match well with the tetragonal cryptomelane structures of α-MnO2 (JCPDS 44-0141). After the acid or alkali treatment, no obvious difference among these XRD peaks is observed, indicating that these treatments do not affect the phase structure of the OMS-2 catalysts.The typical SEM images and the element-mapping results for OMS-2, HAc–OMS-2, and KOH–OMS-2 are displayed in Fig. 2. All of the samples display nanorods morphologies regardless of the acid or the alkali treatment. The element-mapping results show the uniform and continuous dispersion of the K, Mn and O elements. However, the relative content of K is different: for OMS-2, it is 5.5% (wt.); for KOH–OMS-2, it rises to 8.6% (wt.); for HAc–OMS-2, it decreases to 4.5% (wt.).
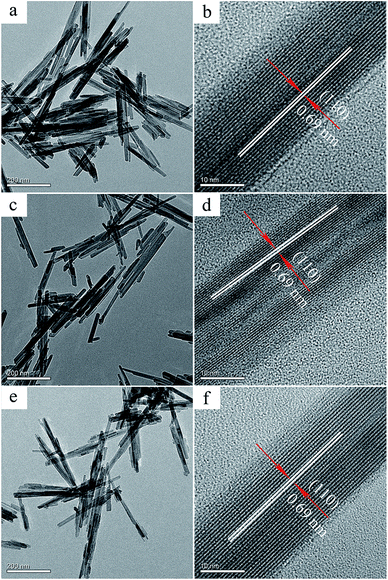
TEM images reveal that the three catalysts are characterized by the morphology of nanorods (Fig. 3), which is consistent with the results of the SEM. The lattice fringes in the HRTEM images show d-spacing of 0.69 nm, corresponding to the (110) facet of α-MnO2. By careful inspection, it can be found that the lattice fringes of the OMS-2 and KOH–OMS-2 are more clear than those of the HAc–OMS-2, indicating that the former two catalysts are highly crystallized, while the HAc–OMS-2 has poor crystal structure with many defects as displayed in Fig. S1 (ESI†).
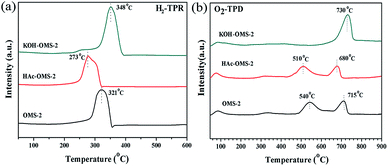
The H2-TPR characterizations were applied to examine the surface and bulk oxygen reducibility of the MnO2 catalysts, and the result is presented in Fig. 4a. All the three catalysts display overlapping reduction peaks, which contain the reduction of MnO2 to Mn2O3 and then to MnO.39,40 The temperatures of the reduction peak for the OMS-2, HAc–OMS-2 and KOH–OMS-2 are ca. 321 °C, 273 °C and 348 °C, respectively. The reduction temperature of the MnO2 reflects its reducibility,6 therefore, the reducibility of the OMS-2 decreases in the order of HAc–OMS-2> OMS-2> KOH–OMS-2. The amounts of H2 consumption are summarized in Table 1. Compared with the OMS-2 catalyst, the H2 consumption of HAc–OMS-2 drops, however, it rises in the case of KOH–OMS-2. The smaller H2 consumption means the lower average oxidation state (AOS), indicating that there is more Mn3+ in the HAc–OMS-2 than the two other catalysts.
| Samples | H2-TPR peak/°C | H2 consumption mmol g−1 | O2-TPD peak/°C | NH3-TPD | |
|---|---|---|---|---|---|
| Position/°C | Peak area (a.u.) | ||||
| OMS-2 | 321 | 7.8 | 540/715 | 230/284 | 2357 |
| HAc–OMS-2 | 273 | 6.5 | 510/680 | 241/289 | 2583 |
| KOH–OMS-2 | 348 | 8.6 | 730 | 202/278 | 1299 |
The O2-TPD tests were conducted to explore the oxygen species involved in the catalytic combustion reaction (Fig. 4b). Generally, three oxygen desorption peaks are detected in the O2-TPD profiles of the OMS-2 catalysts except that of the KOH–OMS-2: low temperature (LT, <200 °C), medium temperature (MT, 400–600 °C), and high temperature (HT, >600 °C), which can be ascribed to the surface oxygen species or chemisorbed oxygen molecule, the surface lattice oxygen related with Mn(III), and the bulk lattice oxygen related with Mn(IV),6,22,40 respectively. Among the three OMS-2 catalysts, the HAc–OMS-2 has a relatively lower desorption peak for the MT and HT peaks. In the case of KOH–OMS-2, the MT peak disappears and the HT peak becomes stronger, delayed at least 15 °C compared with the OMS-2 catalyst. In conclusion, the temperature of O2 desorption for the HAc–OMS-2 catalyst was the lowest, suggesting that it possesses the most loosely bound and active oxygen species.
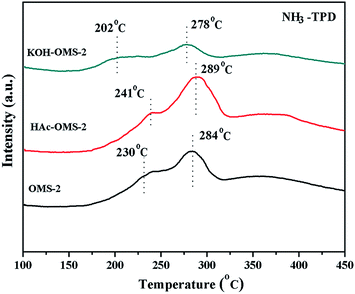
The surface acidity of the MnO2 is known to be related with its catalytic activity, and NH3-TPD experiments were performed to explore the surface acidity (Fig. 5 and Table 1). For the three OMS-2 catalysts, two continuous desorption peaks of NH3 can be observed from 170 °C to 320 °C. The desorption peak temperature indicates the binding strength between acid sites and NH3 molecule,41 therefore, the lower temperature corresponds to weak acidic site, and the higher temperature stands for strong acidic site. Compared with the origin OMS-2 catalyst, the HAc treated OMS-2 has a relatively higher desorption temperature of NH3 and larger desorption peak area, revealing that the acid strength, especially the strong acid, rises after the acid treatment. Whereas, after the KOH treatment, the acidity of OMS-2 decreases significantly as shown by the small desorption peak area and the low peak position. The OMS-2 is reported to have Brönsted acid sites and Lewis acid sites, the former are originated from acidic hydroxyl groups attached to metal oxides (Mn–OH), and the latter is regarded as empty orbitals of metal ions in the MnO2.42 During the process of HAc treatment, the K in the tunnel of OMS-2 is gradually exchanged by H+ as proved by the ICP result (Table 2), and the H+ exchange increases the Brönsted acid sites.31 In another aspect, the acid treatment creates more oxygen vacancy sites over the OMS-2 material as justified by the XPS results (Fig. 6) in latter chapter. The Lewis acid sites increases with the rise of oxygen vacancy sites.43 In general, the acid treatment enhances the Brönsted/Lewis acid sites of the OMS-2 catalysts. In contrast, the KOH treatment decreases the Brönsted acid sites by the reaction of protons with hydroxide.
| K/Mn (mol) | XPS | DME combustion activity and Ea | Toluene combustion activity and Ea | ||||||||
|---|---|---|---|---|---|---|---|---|---|---|---|
| Bulka | Surfaceb | Mn3+/Mn4+c (mol) | Oads/Olattc (mol) | AOSd | T10 (°C) | T90 (°C) | Ea (kJ mol−1) | T10 (°C) | T90 (°C) | Ea (kJ mol−1) | |
| a Obtained from the ICP results.b Calculated from the XPS results.c Based on the fitting result of the XPS.d Calculated with the formula: AOS44 = 8.95–1.13 × ΔEs, where the ΔEs is the splitting energy of the Mn 3s. | |||||||||||
| OMS-2 | 0.10 | 0.15 | 0.83 | 0.58 | 3.75 | 187 | 256 | 70.4 | 178 | 203 | 66.3 |
| HAc–OMS-2 | 0.095 | 0.13 | 1.58 | 0.76 | 3.62 | 170 | 230 | 64.7 | 170 | 194 | 62.4 |
| KOH–OMS-2 | 0.21 | 0.36 | 0.68 | 0.27 | 3.88 | 200 | 267 | 72.4 | 190 | 210 | 68.0 |
The XPS characterization was used to study the surface properties of the OMS-2 catalysts. The XPS result is displayed in Fig. 6 and Table 2. As shown in Table 2, the surface K/Mn molar ratio of OMS-2 is 0.15. After HAc treatment, it drops to 0.13. However, after the alkali treatment, the K/Mn rises to 0.36. The bulk K/Mn molar ratios of the three OMS-2 catalysts tested by ICP are also presented in Table 2, and they exhibit a similar trend.
The average oxidation state (AOS) of Mn in the OMS-2 catalysts were calculated based on the Mn 3s spectra (Fig. 6a) and listed in (Table 2). The calculated AOS increases in the sequence of HAc–OMS-2 (3.62) < OMS-2 (3.75) < KOH–OMS-2 (3.88), further confirming that there is more Mn3+ in the acid-treated OMS-2 than in the two other catalysts. The calculated Mn 3s results match well with the TPR tests.
Fig. 6b shows the Mn 2p3/2 spectra of the OMS-2 catalysts. Slight difference in the binding energy (BE) of the Mn 2p3/2 is observed among the three catalysts. For OMS-2, the peak of Mn 2p3/2 locates at ca. 642.42 eV. After acid or alkali treatment, the BE shifts to the high energy, especially for the alkali-treated OMS-2, the BE moves to 641.87 eV, demonstrating that there is a larger amount of higher valence Mn in the KOH–OMS-2 catalyst. This result agrees well with the AOS result. Similar phenomena was reported by Suib et al.45 about the Cu doped manganese oxide. The prepared CuMnOx-B sample exhibited the most active performance for CO oxidation, and the Mn 2p3/2 shifted to lower energy side. The Mn 2p3/2 spectra is fitted into two peaks. One is around 642.0 eV, and the other is ca. 643.3 eV, and they are ascribed to the Mn3+ and Mn4+ species, respectively. The Mn 2p result indicates the co-existence of Mn3+ and Mn4+ in the catalysts. As shown in Table 2, the HAc–OMS-2 catalyst possess the highest Mn3+/Mn4+ atomic ratio (1.58), followed by OMS-2 (0.83), while KOH–OMS-2 has the lowest Mn3+/Mn4+ atomic ratio (0.68).
Fig. 6c displays the O 1s results of the catalysts. The O 1s spectra is deconvoluted into two subpeaks. The binding energy at 529.8 eV corresponds to the lattice oxygen species (Olatt), and the binding energy at 531.3 eV can be assigned to surface adsorbed oxygen (Oads). The Oads/Olatt molar ratios are summarized in Table 2. From Table 2, we can see that the Oads/Olatt molar ratios of the catalysts decreases in the order of HAc–OMS-2 (0.76) > OMS-2 (0.58) > KOH–OMS-2 (0.27). This might be related to the poor crystal structure with more surface defects of HAc–OMS-2 as observed in HRTEM (Fig. 3d and S1†). The O 1s binding energy of the OMS-2, HAc–OMS-2, and KOH–OMS-2 locates at 529.9, 529.9, and 529.4 eV, respectively. Noted that the O 1s BE of KOH–OMS-2 shifts to lower energy side, and this confirms that there is more lattice oxygen species in the KOH–OMS-2 catalyst. The surface adsorbed oxygen is relevant to the surface oxygen vacancy.41,46 Therefore, it can be deduced from the above results that the density of the surface oxygen vacancy is the highest in the HAc–OMS-2 among the three catalysts.
3.2 Catalytic performance and discussion
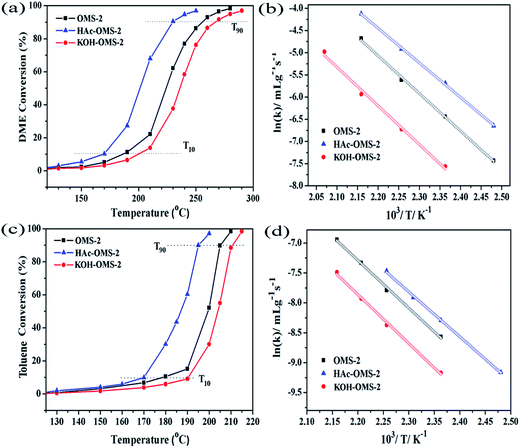
To examine how the acid/alkali treatment influence the catalytic property of the OMS-2 catalysts, catalytic combustion of new energy dimethyl ether (DME) and typical air pollutant toluene were performed. The DME catalytic combustion activity over the three catalysts with a GHSV of 30![[thin space (1/6-em)]](https://www.rsc.org/images/entities/char_2009.gif) 000 mL g−1 h−1 is presented in Fig. 7 and Table 2, the combustion activities follow the sequence of HAc–OMS-2 > OMS-2 > KOH–OMS-2. The KOH–OMS-2 exhibits the lowest catalytic activity, and its T10 and T90 is 200 °C and 267 °C, respectively. After the acid treatment, a significant decreases (about 30 °C) in T10 and T90 is discovered for the HAc–OMS-2 catalyst. The HAc–OMS-2 exhibits the highest catalytic activity among the three catalysts with a T10 of 170 °C and a T90 of 230 °C. For comparison, the performance of DME combustion previously reported are summarized in Table S1 (ESI†). From the Table S1,† we can see that the performance (T10 and T90) of the HAc–OMS-2 is comparable to those of the reported catalyst. These results clearly show that the acid treatment on the OMS-2 has positive effect on the catalytic performance. However, the alkali treatment brings negative effluence on the catalytic performance.
000 mL g−1 h−1 is presented in Fig. 7 and Table 2, the combustion activities follow the sequence of HAc–OMS-2 > OMS-2 > KOH–OMS-2. The KOH–OMS-2 exhibits the lowest catalytic activity, and its T10 and T90 is 200 °C and 267 °C, respectively. After the acid treatment, a significant decreases (about 30 °C) in T10 and T90 is discovered for the HAc–OMS-2 catalyst. The HAc–OMS-2 exhibits the highest catalytic activity among the three catalysts with a T10 of 170 °C and a T90 of 230 °C. For comparison, the performance of DME combustion previously reported are summarized in Table S1 (ESI†). From the Table S1,† we can see that the performance (T10 and T90) of the HAc–OMS-2 is comparable to those of the reported catalyst. These results clearly show that the acid treatment on the OMS-2 has positive effect on the catalytic performance. However, the alkali treatment brings negative effluence on the catalytic performance.
The catalytic combustion of toluene over these catalysts was also conducted to study that the OMS-2 material has wide application as combustion catalyst (Fig. 7c and Table 2). As shown in Table 2, the order of the toluene combustion is identical to that of the DME combustion. Among them, HAc–OMS-2 shows the best catalytic performance with a T10 and T90 of 170 °C and 194 °C, respectively. The OMS-2 is less active with the T10 of 178 °C and the T90 of 203 °C. The KOH–OMS-2 exhibits the lowest catalytic activity, giving the T10 of 190 °C and the T90 of 210 °C. Some of the reported metal oxide catalysts for toluene combustion are listed in Table S2 (ESI†). Apparently, the performance of the HAc–OMS-2 catalyst is comparable to those of the reported catalyst.
Based on the above experiments, the acid-treated OMS-2 displayed superior catalytic combustion activities, no matter in the DME combustion or in the toluene combustion, while, the alkali-treated OMS-2 showed inferior performance. The effects of important properties related to the catalytic functions are discussed below:
The activation of oxygen is important for the oxidation reaction.53 Based on the O2-TPD results, the HAc–OMS-2 has the lowest desorption temperature of oxygen species, meaning that its oxygen species could be more readily released. The surface lattice oxygen related with Mn(III) is considered to play a key role in the catalytic oxidation reaction.46 The HAc–OMS-2 demonstrates the superior oxygen species mobility, resulting in an outstanding performance for DME and toluene combustion. Similar results have been reported for phenyl volatile organic compounds combustion over MnOx catalyst.53
The surface adsorbed oxygen species have higher mobility than the lattice oxygen, thus contributing a lot to the catalytic performance at low temperature.10,40 The more the surface adsorbed oxygen, the better the catalytic activity. Based on the O 1s results, the Oads/Olatt molar ratios of the catalysts decreased in the order of HAc–OMS-2 (0.76) > OMS-2 (0.58) > KOH–OMS-2 (0.27), which is in good agreement with the sequence of the catalytic combustion activities (HAc–OMS-2 > OMS-2 > KOH–OMS-2). The importance of the surface adsorbed oxygen species have also been addressed in the catalytic decomposition of gaseous ozone,41 formaldehyde oxidation,46 CO oxidation,54,55 acetaldehyde oxidation,10 and toluene oxidation.56,57
Briefly, the acid treatment is an effective approach to enhance the catalytic combustion of OMS-2 material. In fact, if we substitute HAc with HCl, similar result can be obtained (the activity, the redox properties, ESI, Fig. S2–S5†). This result show that we could use inorganic acid to etch OMS-2 achieving the purpose of the control of catalytic activity.
4. Conclusion
In summary, the acid and alkali treated OMS-2 materials were prepared and evaluated as the catalysts for DME and toluene combustion. The acid treatment significantly enhanced the catalytic performance, whereas, the alkali treatment decreased the catalytic activity. The HAc–OMS-2 catalyst had richer surface oxygen, higher oxygen mobility and redox activity, and stronger acidic sites, leading to an improvement on the catalytic combustion activity. The acid etching/dissolution might be an effective way to enhance the catalytic activity of manganese oxides or other metal oxides.Acknowledgements
This work was financially supported by the National Natural Science Foundation of China (21306026, 21576054), the Scientific Program of Guangdong Province (2014A010106030, 2016A010104017, 2016B020241003), the Foundation of Higher Education of Guangdong Province (2015KTSCX027).References
- S. L. Suib, Acc. Chem. Res., 2008, 41, 479–487 CrossRef CAS PubMed
.
- Y. Q. Deng, T. Zhang, C. T. Au and S. F. Yin, Appl. Catal., A, 2013, 467, 117–123 CrossRef CAS
.
- S. Liu, X. Liu, J. Zhao, Z. Tong, J. Wang, X. Ma, C. Chi, D. Su, X. Liu and Y. Li, RSC Adv., 2016, 6, 85222–85229 RSC
.
- C. Ji, H. Ren and S. Yang, RSC Adv., 2015, 5, 21978–21987 RSC
.
- H. C. Genuino, M. S. Seraji, Y. T. Meng, D. Valencia and S. L. Suib, Appl. Catal., B, 2015, 163, 361–369 CrossRef CAS
.
- J. Jia, P. Zhang and L. Chen, Catal. Sci. Technol., 2016, 6, 5841–5847 CAS
.
- M. Özacar, A. S. Poyraz, H. C. Genuino, C.-H. Kuo, Y. Meng and S. L. Suib, Appl. Catal., A, 2013, 462–463, 64–74 CrossRef
.
- L. Wang, Y. Wu, N. Feng, J. Meng, H. Wan and G. Guan, RSC Adv., 2016, 6, 50288–50296 RSC
.
- J. H. Zhang, Y. B. Li, L. Wang, C. B. Zhang and H. He, Catal. Sci. Technol., 2015, 5, 2305–2313 CAS
.
- Y. Li, Z. Fan, J. Shi, Z. Liu, J. Zhou and W. Shangguan, Catal. Today, 2015, 256, 178–185 CrossRef CAS
.
- C. Almquist, M. Krekeler and L. Jiang, Chem. Eng. J., 2014, 252, 249–262 CrossRef CAS
.
- J. Hou, Y. Li, M. Mao, X. Zhao and Y. Yue, Nanoscale, 2014, 6, 15048–15058 RSC
.
- H. Sun, S. Chen, P. Wang and X. Quan, Chem. Eng. J., 2011, 178, 191–196 CrossRef CAS
.
- V. P. Santos, S. S. T. Bastos, M. F. R. Pereira, J. J. M. Órfão and J. L. Figueiredo, Catal. Today, 2010, 154, 308–311 CrossRef CAS
.
- H. Sun, Z. Liu, S. Chen and X. Quan, Chem. Eng. J., 2015, 270, 58–65 CrossRef CAS
.
- Y. Yang, J. Huang, S. Z. Zhang, S. W. Wang, S. B. Deng, B. Wang and G. Yu, Appl. Catal., B, 2014, 150, 167–178 CrossRef
.
- V. P. Santos, M. F. R. Pereira, J. J. M. Orfao and J. L. Figueiredo, Appl. Catal., B, 2009, 88, 550–556 CrossRef CAS
.
- V. P. Santos, O. S. G. P. Soares, J. J. W. Bakker, M. F. R. Pereira, J. J. M. Órfão, J. Gascon, F. Kapteijn and J. L. Figueiredo, J. Catal., 2012, 293, 165–174 CrossRef CAS
.
- Y. Wu, R. Feng, C. Song, S. Xing, Y. Gao and Z. Ma, Catal. Today, 2017, 281, 500–506 CrossRef CAS
.
- H. Yin, X. Dai, M. Zhu, F. Li, X. Feng and F. Liu, J. Hazard. Mater., 2015, 296, 221–229 CrossRef CAS PubMed
.
- X. Meng, J. Q. Zhang, B. H. Chen, Z. Q. Jing and P. Q. Zhao, Catal. Sci. Technol., 2016, 6, 890–896 CAS
.
- L. L. Zhang, J. J. Tu, L. Lyu and C. Hu, Appl. Catal., B, 2016, 181, 561–569 CrossRef CAS
.
- V. P. Santos, S. A. C. Carabineiro, J. J. W. Bakker, O. S. G. P. Soares, X. Chen, M. F. R. Pereira, J. J. M. Órfão, J. L. Figueiredo, J. Gascon and F. Kapteijn, J. Catal., 2014, 309, 58–65 CrossRef CAS
.
- M. Sun, L. Yu, F. Ye, G. Q. Diao, Q. Yu, Z. F. Hao, Y. Y. Zheng and L. X. Yuan, Chem. Eng. J., 2013, 220, 320–327 CrossRef CAS
.
- G. D. Yadav and R. K. Mewada, Catal. Today, 2012, 198, 330–337 CrossRef CAS
.
- M. Ousmane, G. Perrussel, Z. Yan, J. M. Clacens, F. De Campo and M. Pera-Titus, J. Catal., 2014, 309, 439–452 CrossRef CAS
.
- T. Zhang, Y. Q. Deng, W. F. Zhou, C. T. Au and S. F. Yin, Chem. Eng. J., 2014, 240, 509–515 CrossRef CAS
.
- J. Hou, L. Liu, Y. Li, M. Mao, H. Lv and X. Zhao, Environ. Sci. Technol., 2013, 47, 13730–13736 CrossRef CAS PubMed
.
- Y. Yuan, C. Zhan, K. He, H. Chen, W. Yao, S. Sharifi-Asl, B. Song, Z. Yang, A. Nie, X. Luo, H. Wang, S. M. Wood, K. Amine, M. S. Islam, J. Lu and R. Shahbazian-Yassar, Nat. Commun., 2016, 7, 13374 CrossRef CAS PubMed
.
- J. Liu, V. Makwana, J. Cai, S. L. Suib and M. Aindow, J. Phys. Chem. B, 2003, 107, 9185–9194 CrossRef CAS
.
- R. Kumar, S. Sithambaram and S. L. Suib, J. Catal., 2009, 262, 304–313 CrossRef CAS
.
- W. Si, Y. Wang, Y. Peng and J. Li, Angew. Chem., Int. Ed., 2015, 54, 7954–7957 CrossRef CAS PubMed
.
- Y. Peng, W. Si, J. Luo, W. Su, H. Chang, J. Li, J. Hao and J. Crittenden, Environ. Sci. Technol., 2016, 50, 6442–6448 CrossRef CAS PubMed
.
- F. Liang, Y. Yu, W. Zhou, X. Xu and Z. Zhu, J. Mater. Chem. A, 2015, 3, 634–640 CAS
.
- Q. Hua, D. Shang, W. Zhang, K. Chen, S. Chang, Y. Ma, Z. Jiang, J. Yang and W. Huang, Langmuir, 2011, 27, 665–671 CrossRef CAS PubMed
.
- H. Zhou, B. Lv, L. Wang, D. Wu and Y. Xu, CrystEngComm, 2015, 17, 1848–1855 RSC
.
- W. Hu, J. Lan, Y. Guo, X.-M. Cao and P. Hu, ACS Catal., 2016, 6, 5508–5519 CrossRef
.
- R. Jothiramalingam, B. Viswanathan and T. K. Varadarajan, Catal. Commun., 2005, 6, 41–45 CrossRef CAS
.
- J. Hou, Y. Li, M. Mao, L. Ren and X. Zhao, ACS Appl. Mater. Interfaces, 2014, 6, 14981–14987 CAS
.
- V. P. Santos, M. F. R. Pereira, J. J. M. Orfao and J. L. Figueiredo, Appl. Catal., B, 2010, 99, 353–363 CrossRef CAS
.
- J. B. Jia, P. Y. Zhang and L. Chen, Appl. Catal., B, 2016, 189, 210–218 CrossRef CAS
.
- J. Luo, Q. Zhang, J. Garcia-Martinez and S. L. Suib, J. Am. Chem. Soc., 2008, 130, 3198–3207 CrossRef CAS PubMed
.
- L. Sun, Q. Cao, B. Hu, J. Li, J. Hao, G. Jing and X. Tang, Appl. Catal., A, 2011, 393, 323–330 CrossRef CAS
.
- V. R. Galakhov, M. Demeter, S. Bartkowski, M. Neumann, N. A. Ovechkina, E. Z. Kurmaev, N. I. Lobachevskaya, Y. M. Mukovskii, J. Mitchell and D. L. Ederer, Phys. Rev. B: Condens. Matter Mater. Phys., 2002, 65, 1131021–1131024 CrossRef
.
- E. C. Njagi, C. H. Chen, H. Genuino, H. Galindo, H. Huang and S. L. Suib, Appl. Catal., B, 2010, 99, 103–110 CrossRef CAS
.
- Z. Wang, W. Z. Wang, L. Zhang and D. Jiang, Catal. Sci. Technol., 2016, 6, 3845–3853 CAS
.
- Q. Ye, H. Lu, J. Zhao, S. Cheng, T. Kang, D. Wang and H. Dai, Appl. Surf. Sci., 2014, 317, 892–901 CrossRef CAS
.
- J. Hou, Y. Li, L. Liu, L. Ren and X. Zhao, J. Mater. Chem. A, 2013, 1, 6736 CAS
.
- F. Cheng, T. Zhang, Y. Zhang, J. Du, X. Han and J. Chen, Angew. Chem., Int. Ed., 2013, 52, 2474–2477 CrossRef CAS PubMed
.
- D. A. Tompsett, S. C. Parker and M. S. Islam, J. Am. Chem. Soc., 2014, 136, 1418–1426 CrossRef CAS PubMed
.
- L.-C. Wang, Y.-M. Liu, M. Chen, Y. Cao, H.-Y. He and K.-N. Fan, J. Phys. Chem. C, 2008, 112, 6981–6987 CAS
.
- L. Li, X. H. Feng, Y. Nie, S. G. Chen, F. Shi, K. Xiong, W. Ding, X. Q. Qi, J. S. Hu, Z. D. Wei, L. J. Wan and M. R. Xia, ACS Catal., 2015, 5, 4825–4832 CrossRef CAS
.
- G. L. Zhou, H. Lan, H. Wang, H. M. Xie, G. Z. Zhang and X. X. Zheng, J. Mol. Catal. A: Chem., 2014, 393, 279–288 CrossRef CAS
.
- P. Venkataswamy, K. N. Rao, D. Jampaiah and B. M. Reddy, Appl. Catal., B, 2015, 162, 122–132 CrossRef CAS
.
- Q. Ye, J. Zhao, F. Huo, D. Wang, S. Cheng, T. Kang and H. Dai, Microporous Mesoporous Mater., 2013, 172, 20–29 CrossRef CAS
.
- F. Wang, H. Dai, J. Deng, G. Bai, K. Ji and Y. Liu, Environ. Sci. Technol., 2012, 46, 4034–4041 CrossRef CAS PubMed
.
- F. Shi, F. Wang, H. Dai, J. Dai, J. Deng, Y. Liu, G. Bai, K. Ji and C. T. Au, Appl. Catal., A, 2012, 433–434, 206–213 CrossRef CAS
.
- J. Zhang, C. Zhang and H. He, J. Environ. Sci., 2015, 35, 69–75 CrossRef PubMed
.
- K. Jirátová, J. Mikulová, J. Klempa, T. Grygar, Z. Bastl and F. Kovanda, Appl. Catal., A, 2009, 361, 106–116 CrossRef
.
- B. Y. Bai and J. H. Li, ACS Catal., 2014, 4, 2753–2762 CrossRef CAS
.
- Z. P. Qu, Y. B. Bu, Y. Qin, Y. Wang and Q. Fu, Chem. Eng. J., 2012, 209, 163–169 CrossRef CAS
.
Footnote |
| † Electronic supplementary information (ESI) available. See DOI: 10.1039/c6ra27700d |
| This journal is © The Royal Society of Chemistry 2017 |

