 Open Access Article
Highly efficient removal of Cu(II) from aqueous solution using a novel magnetic EDTA functionalized CoFe2O4
Zhiyan Zou ,
Zhou Shi
 and
Lin Deng
 *
*
Key Laboratory of Building Safety and Energy Efficiency, Ministry of Education, Department of Water Engineering and Science, College of Civil Engineering, Hunan University, Changsha 410082, PR China. E-mail: denglinlyn@126.com; Tel: +86 73188821441
First published on 17th January 2017
Abstract
CoFe2O4 exhibits excellent chemical stability and saturation magnetization; consequently, it has been prepared for and applied to contaminant adsorption. However, the material demonstrated a relatively low adsorption capacity due to agglomeration and the lower amount of active sites for pollutants. In this study, we have developed a facile one-pot route to synthesize EDTA functionalized superparamagnetic CoFe2O4 nanoparticles (denoted as EDTA-MNP) to adsorb Cu(II) ions from aqueous solution. The physico-chemical properties of the obtained materials were characterized by scanning electron microscopy (SEM), X-ray diffraction (XRD), vibrating sample magnetometer (VSM) analysis, Fourier transform infrared (FTIR) spectroscopy, X-ray photoelectron spectroscopy (XPS) and the Brunauer–Emmett–Teller (BET) surface area method. Then, the effects of EDTA mass in EDTA-MNP, adsorbent dosage, initial solution pH, temperature and coexisting cations were measured systematically through batch experiments to evaluate the adsorption performance of Cu(II) ions onto EDTA-MNP nanoparticles. The results indicated that the adsorption efficiency of the CoFe2O4 for Cu(II) was negligible, while the value for EDTA-MNP was highly improved, which was due to the special affinity of carboxylic groups on the EDTA-MNP surface for Cu(II) in solution. Kinetic experiments suggested that the pseudo-second-order model showed the best correlation with the adsorption data. Equilibrium data were best described by the Langmuir model, and the estimated maximum adsorption capacity of EDTA-MNP was 73.26 mg g−1 at 323 K, displaying a higher efficiency for Cu(II) removal than previously reported adsorbents. The present work indicated that the EDTA-MNP composite can be an effective and potential adsorbent for removing Cu(II) ions from aqueous solution, and it also provided a very effective way to improve the adsorption affinity of metallic contaminants onto ferrite or other metal oxides.
1. Introduction
The increasing level of heavy metals discharged into the aquatic system as industrial waste, is a serious environmental problem and does great harm to human health, living resources, and ecological systems due to their toxic and non-degradable nature.1,2 It has become very urgent to find appropriate techniques to scavenge heavy metals from wastewater. Copper (Cu(II)) generated from various industries including metal finishing, electroplating, paint, textile and paper, is one of the most toxic ions due to its poisonousness to the human body and its abundant and naturally-occurrence in the environment especially in wastewaters.3–5 Therefore, in recent years, numerous contaminant remediation methods have been employed for the elimination of Cu(II) from wastewater including chemical precipitation, electrolysis, ion exchange, reverse osmosis, membrane separation and adsorption.1,3,6,7 Among these techniques, adsorption is one of the promising and widely used methods for Cu(II) containing wastewater purification because of its cost effectiveness, high efficiency, stability characteristics, and easy implementation as well as the availability of diverse adsorbents.2,7–10Some traditional adsorbents such as chitosan,1,2 activated carbon,11 kaolinite,12 zeolite,13 diatomite,14 and alumina15 have been applied for Cu(II) removal. However, most of these adsorbents are not the ideal choices for their low adsorption capacity, low selectivity, or difficulty of separation from the solution in application. Presently, the development of nanomaterials provides a good alternative and fascinating area of interest for the extraction of Cu(II) from industrial effluents due to its unique characteristics of high specific surface area, greater number of active sites, low diffusion resistance for adsorbates.5,10 Some cost-effective nanomaterials such as carbon nanotubes,16 TiO2-nano-rods,17 alumina nanopowders,18 etc., have been successfully employed for adsorption of Cu(II) ions from aqueous solutions.
Literature survey shows that spinel ferrites is becoming the research hotspot lately in various fields including bio-medicine, rechargeable batteries, sensors and magnetic devices because of their high magnetic permeability, high thermal, mechanical and excellent chemical stabilities.19,20 Meanwhile, they have an incomparable advantage and can be easily separated from solution by an external magnetic field. Consequently, they and their derivatives have been prepared and applied as adsorbents for contaminant elimination.20–23 Nevertheless, the adsorption capacities of these adsorbents for Cu(II) were not so satisfactory, possibly because of the agglomeration of the nanomaterials.24,25 To maximize the performance of spinel ferrites as adsorbents, further modification is necessary.26 Scientific workers tried to improve their adsorption capacity by functionalizing spinel ferrites with inorganic species,26 polymer grafting,27 or organic ligands.28–30 Ethylenediaminetetraacetic acid (EDTA) is a hexadentate ligand that provides both carboxylate and amine functions. The immobilization of EDTA on different supporting materials (chitosan,31 silica gel,32 polystyrene,33 and so forth) for metal ions adsorption purposes has received a great deal of attention recently. Results of the studies suggested that the adsorption efficiency of EDTA-grafted materials highly depended on the nature of the base material and anchored intermediates used as linkage between EDTA and supporting material.
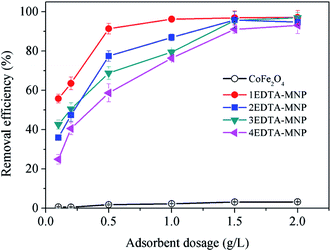
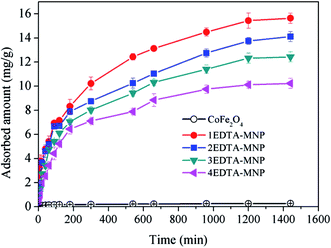
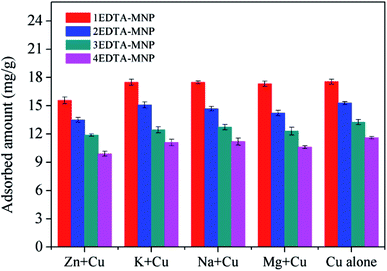
In this work, EDTA functionalized superparamagnetic CoFe2O4 nanoparticles (denoted as EDTA-MNP) synthesized by a facile hydro-thermal method was innovatively employed for Cu(II) removal from aqueous solution. The objective of the present study was devoted to investigate and characterize the effect of EDTA mass in the composite on the adsorption capacity of EDTA-MNP for Cu(II), which was, to the best of our knowledge, not reported previously. For this purpose, (a) experiments were carried out to evaluate the effect of EDTA mass on the adsorption capacity of EDTA-MNP for Cu(II), (b) scanning electron microscope (SEM), X-ray diffraction (XRD), vibrating sample magnetometer (VSM) analysis, and the Brunauer–Emmett–Teller (BET) surface area method were used investigate the properties of the adsorbents, such as microstructure, surface morphology, magnetism and surface area of the adsorbents, (c) batch adsorption experiments were performed and their kinetic and isotherms were studied systematically, and (d) the interaction mechanism between Cu(II) and the functional groups on the adsorbent surface involved in the adsorption were analyzed and interpreted using Fourier transform infrared spectroscopy (FT-IR) and X-ray photoelectron spectroscopy (XPS).
2. Materials and methods
2.1 Chemicals
All chemicals including CoCl2·6H2O, FeSO4·7H2O, ammonia, NaOH, HNO3, ethylene glycol, absolute ethanol, ethylenediaminetetraaceticacid disodium salt (EDTA-Na2), copper nitrate dihydrate were purchased from Sinopharm Chemical Reagent Co., Ltd., China. All analytical reagents were grade and used as received without any further purification. Ultrapure water was used throughout the study.2.2 EDTA-MNP synthesis
In a typical synthesis, 1EDTA-MNP nanoparticles were prepared through hydrothermal route. Briefly, a solution of FeSO4·7H2O and CoCl2·6H2O with a molar ratio of 2![[thin space (1/6-em)]](https://www.rsc.org/images/entities/char_2009.gif) :
:![[thin space (1/6-em)]](https://www.rsc.org/images/entities/char_2009.gif) 1 was mixed well along with 0.25 mmol of EDTA-Na2 in the solution of 60 mL ethylene glycol and 40 mL doubly distilled water, followed by the addition of 4 mL ammonia solution. A constantly continuous stirring for 1 h by a magnetic stirrer was carried out to get a homogeneous mixture. Subsequently the obtained solution was transferred into the Teflon-lined autoclave. The autoclave was heated to and maintained at 180 °C for 24 h in an oven and then cooled down to room temperature naturally. The collected black precipitation was washed for several times with doubly distilled water and absolute ethanol to remove any unreacted component. Finally the products were dried at 60 °C overnight. In this study, 2EDTA-MNP, 3EDTA-MNP and 4EDTA-MNP were prepared through the same procedure by addition of 0.5, 1.5 and 2 mmol of EDTA-Na2 in the first step of the synthetic process, respectively. The pure CoFe2O4 was synthesized without the addition of EDTA-Na2.
1 was mixed well along with 0.25 mmol of EDTA-Na2 in the solution of 60 mL ethylene glycol and 40 mL doubly distilled water, followed by the addition of 4 mL ammonia solution. A constantly continuous stirring for 1 h by a magnetic stirrer was carried out to get a homogeneous mixture. Subsequently the obtained solution was transferred into the Teflon-lined autoclave. The autoclave was heated to and maintained at 180 °C for 24 h in an oven and then cooled down to room temperature naturally. The collected black precipitation was washed for several times with doubly distilled water and absolute ethanol to remove any unreacted component. Finally the products were dried at 60 °C overnight. In this study, 2EDTA-MNP, 3EDTA-MNP and 4EDTA-MNP were prepared through the same procedure by addition of 0.5, 1.5 and 2 mmol of EDTA-Na2 in the first step of the synthetic process, respectively. The pure CoFe2O4 was synthesized without the addition of EDTA-Na2.
2.3 Characterization
The morphologies of EDTA-MNP were characterized by scanning electron microscopy (JSM-6360LV). The specific surface area and pore structure of the adsorbents were calculated by nitrogen adsorption and desorption at 77 K using an ASAP 2020 (Micromeritics) volumetric adsorption analyzer. The degassing time and temperature for isotherm measurements were 10 h and 150 °C, respectively. Magnetic properties of the material were recorded on a vibrating sample magnetometer (Quantum Design, MPMS-XL-7). XRD patterns were measured by a Rigaku D/Max-2500 powder diffractometer with Cu Kα radiation, using a radiation at 40 kV and 30 mA. The diffraction angles were ranged from 10° to 80° with a rate of 1.0° min−1. FTIR spectrum was determined by a FT-IR spectrometer (Thermo Nicolet, Nexus-470) with a resolution of 4 cm−1 in the range from 400 to 4000 cm−1. XPS measurements were carried out on ESCALab220i-XL electron spectrometer from VG Scientific using 300 W Al Kα radiations. The XPS spectra after the back-ground signal correction were fitted to Lorentzian and Gaussian curves by using PEAKFIT Software, version 4.12.2.4 Cu(II) ions adsorption
In general, a certain amount adsorbent was added to 50 mL of Cu(II) solution with the certain initial concentration at the desired pH value. The pH of the solution was adjusted to a designated value by adding HNO3 or NaOH (0.1 M and 1 M) with a pH meter (Orion Research. Inc, Model 868, USA). The obtained mixture was continuously stirred in a thermostatic water bath shaker at speed of 180 rpm until equilibrium was reached except kinetic experiments. Adsorption isotherm was studied by varying initial Cu(II) solution concentration (10–200 mg L−1) at different temperature (298, 313 and 323 K). After adsorption, the adsorbent was separated from the aqueous solution by an external magnet for several seconds, and the residual Cu(II) concentration was determined using a Flame Atomic Absorption Spectrometer (Hitachi, U-3900, Japan). For the sake of comparison, blank experiments were conducted in parallel on Cu(II) solutions, without addition of adsorbent. All experiments were performed in triplicate, and their mean values were used in analyzing the data.The removal efficiency and the amount of Cu(II) adsorbed qt (mg g−1) were calculated by following the equations:
 | (1) |
 | (2) |
2.5 Regeneration studies
For repeated adsorption and desorption studies, the Cu(II) loaded adsorbents were gently washed with deionized water to remove any unabsorbed Cu(II) and dried in an oven, and then mixed with 50 mL of 0.03 M EDTA. To examine the reusability of EDTA functionalized CoFe2O4, the adsorption–desorption cycle was repeated three times.3. Results and discussion
3.1 Characterization of the adsorbents
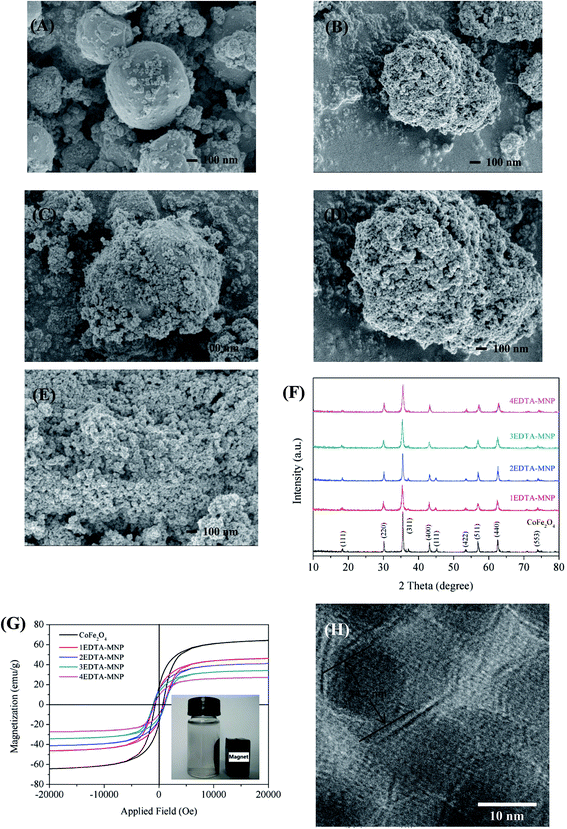
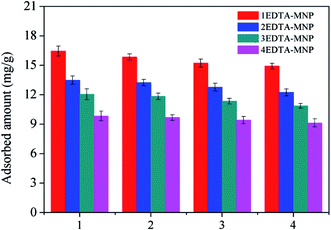
Morphology of the samples were observed by SEM as depicted in Fig. 1. It's clear that the CoFe2O4 nanoparticles were in good spherical shape, and they had a serious phenomenon of agglomeration. After functionalization with EDTA, the surface of CoFe2O4 became rougher and irregular due to the covering of EDTA on its surface, and the particle size increased with the increase in EDTA mass. And 4EDTA-MNP exhibited a platy structure because of too much EDTA overlapping on the surface of CoFe2O4 nanoparticle, which might not be beneficial for the adsorption of Cu(II). HRTEM was carried to study the structure and interaction relationship between CoFe2O4 and EDTA (as depicted in Fig. 1H). Although the photograph was not so clear, it could be observed that the particle size of CoFe2O4 was found to be 14.2 nm, and the nanoparticle was covered by a layer of EDTA on its surface.The XRD patterns of CoFe2O4, 1EDTA-MNP, 2EDTA-MNP, 3EDTA-MNP, and 4EDTA-MNP, were shown in Fig. 1F. The characteristic diffraction peaks appeared in CoFe2O4 at 15.1°, 30.2°, 35.5°, 43.1°, 45.2°, 53.4°, 57.0°, 63.3°, and 74.38°, which could be indexed to the (111), (220), (311), (400), (111), (422), (511), (400), and (553) planes of single phase cubic spinel structure of CoFe2O4, respectively (JCPDS no. 22-1086).24 It's evident that these characteristic diffraction peaks were all seen in samples of 1EDTA-MNP, 2EDTA-MNP, 3EDTA-MNP, and 4EDTA-MNP, indicating that the functionalization of CoFe2O4 using EDTA did not result in the crystal structure change of the CoFe2O4 nanoparticles.
The magnetic hysteresis loops of the synthesized adsorbents at room temperature were illustrated in Fig. 1G. The magnetization curves showed that all of the materials were essential super-paramagnetic and the saturated magnetization of CoFe2O4, 1EDTA-MNP, 2EDTA-MNP, 3EDTA-MNP, and 4EDTA-MNP were found to be 64.5, 46.3, 41.1, and 27.3 emu g−1, respectively. Although the saturated magnetization value of the EDTA functionalized CoFe2O4 was lower that of the pure nickel ferrite due to the incorporation of non-magnetic EDTA, the picture inserted in Fig. 1G suggested that the 4EDTA-MNP could be separated from aqueous solution rapidly in a few seconds after adsorption using an external magnet.
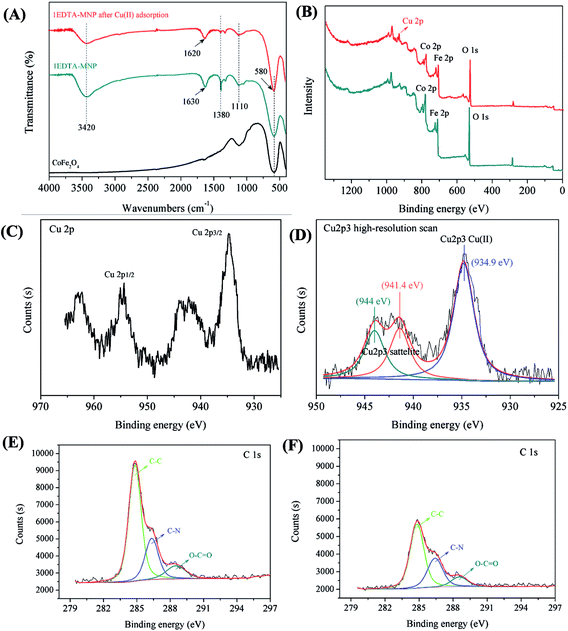
From the XPS results of CoFe2O4 and 1EDTA-MNP (Fig. 4B), the actual loading of EDTA in the composite was found to be 21.69%.
3.2 Cu(II) adsorption
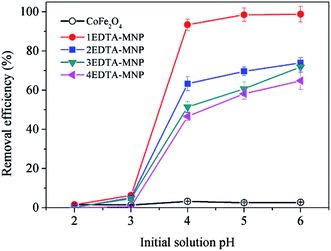
As illustrated in Fig. 3, the adsorption of Cu(II) increased with increasing solution pH from 2 to 6 for all the four adsorbents. In aqueous solution, Cu(II) exists in forms of Cu(II), Cu(OH)+, Cu(OH)2, Cu(OH)3− and Cu(OH)42− depending on the solution pH. And Cu(II) is the predominant species at pH lower than 6.0.36–38 The small adsorption at lower pH levels were probably attributed to the significant competitive adsorption between Cu(II) and H+ ions in solution for adsorption sites.5,36 On the other hand, at low pH, the functional groups on the adsorbent surface were protonated, which had electrostatic repulsion to Cu(II) and was hard to donate their electron pairs to coordinate with Cu(II), thus weakening the complexation between them and further decreasing the adsorption capacity of Cu(II). The strong pH dependent adsorption indicated the adsorption of Cu(II) on EDTA functionalized CoFe2O4 was dominated by surface complexation and ion exchange.39 At relative high pH, the interaction between –COO– on EDTA-MNP and Cu(II) was strengthened, leading to the increased adsorption. Therefore, the optimum pH for Cu(II) adsorption is observed to be in pH range of 5–6, which is in agreement with the results of previous studies.5,37,40 Thus, further adsorption experiments were performed at pH 6.0.
To speculate the adsorption mechanisms involved in the adsorption process of Cu(II), FTIR analysis of 1EDTA-MNP before and after Cu(II) adsorption were carried out. As can be seen in Fig. 4A, the strong peak at 580 cm−1 was ascribed to the Fe–O stretching vibration. Compared with the pure CoFe2O4, the new generated FTIR peaks at 3420 cm−1 was assigned to the OH groups and physically absorbed water, and the peak at 1110 cm−1 was related to the stretching vibration of –C–N.41 This observation suggested that EDTA has been successfully grafted onto the surface of CoFe2O4. And these two band positions did not change after adsorption, indicating that the basic structure of 1EDTA-MNP remained constant. In addition, the peak located at 1630 cm−1 was attributed to structural vibrations of aromatic C![[double bond, length as m-dash]](https://www.rsc.org/images/entities/char_e001.gif) C and asymmetrical C
C and asymmetrical C![[double bond, length as m-dash]](https://www.rsc.org/images/entities/char_e001.gif) O stretching of COO– groups originated from EDTA, while the medium intensity absorption centered 1380 cm−1 mostly related to the symmetrical COO– stretching.42 A red shift of the spectral peak position at 1620 cm−1 and the weakened peak at 1380 cm−1 were observed, implying the complexation of Cu(II) with the carboxylic groups on the adsorbent surface.
O stretching of COO– groups originated from EDTA, while the medium intensity absorption centered 1380 cm−1 mostly related to the symmetrical COO– stretching.42 A red shift of the spectral peak position at 1620 cm−1 and the weakened peak at 1380 cm−1 were observed, implying the complexation of Cu(II) with the carboxylic groups on the adsorbent surface.
For better understanding the elemental speciation on the surface of adsorbent, XPS measurement of 1EDTA-MNP before and after Cu(II) adsorption was performed. The XPS full scan spectrum of 1EDTA-MNP before and after Cu(II) adsorption were depicted in Fig. 4B. Besides the characteristic peaks of O1s (530.3 eV), Co2p (780.9 eV), Fe2p (711.4 eV), N1s (400.2 eV), and C1s (284.8 eV), Cu2p (934.7 eV) peak was clearly detected for the Cu(II)-adsorbed 1EDTA-MNP,43 demonstrating that Cu(II) ions were certainly attached onto the adsorbent. As shown in Fig. 4C, the binding energies at 934.9 eV and 954.4 eV represented Cu regions of 2p3/2 and 2p1/2, respectively. The determination of the oxidation state of Cu2p3 was carried out by a curve-fitting procedure based on Lorentzians broadened by Gaussion (Fig. 4D), which illustrated that the copper adsorbed on the nanoparticles exists in the oxidation state of 2+ and no signal of Cu(I) or Cu(0) was detected. Thus, we postulated that the removal of Cu(II) using EDTA functionalized CoFe2O4 was dominated only by adsorption process since the reduction of Cu(II) was beyond detection.3 Fig. 4E and F represented the high-resolution spectrum of C1s for 1EDTA-MNP before and after Cu(II) adsorption. Devolution of the peak C1s of 1EDTA-MNP clearly showed three component peaks with binding energy of 284.9, 286.4 and 288.6 eV, which could be assigned to the C in the forms of C–C, C–N, and O–C![[double bond, length as m-dash]](https://www.rsc.org/images/entities/char_e001.gif) O, respectively.39,44 Notably, the intensity of C1s components of the adsorbent decreased significantly after Cu(II) adsorption as illustrated in Fig. 4F, indicating that EDTA participated in the adsorption process of Cu(II) onto 1EDTA-MNP. The result was indicative of the formation of Cu complexation, in which the nitrogen and oxygen shared electrons with Cu2+ and hence the electron density at the adjacent carbon atoms increased and the binding energy of the carbons were reduced.39
O, respectively.39,44 Notably, the intensity of C1s components of the adsorbent decreased significantly after Cu(II) adsorption as illustrated in Fig. 4F, indicating that EDTA participated in the adsorption process of Cu(II) onto 1EDTA-MNP. The result was indicative of the formation of Cu complexation, in which the nitrogen and oxygen shared electrons with Cu2+ and hence the electron density at the adjacent carbon atoms increased and the binding energy of the carbons were reduced.39
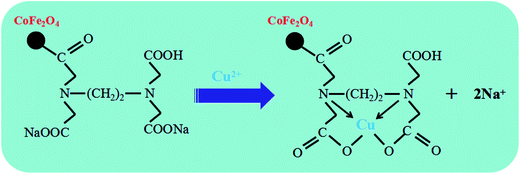
In summary, the FTIR and XPS analysis above suggested that the removal of Cu(II) from aqueous solution by adsorption onto EDTA functionalized CoFe2O4 could be achieved by a multiplex process which involved ion exchange as well as surface complexation (Scheme 1).
For the purpose of investigation of the rate-controlling step in the adsorption mechanism of Cu(II) onto EDTA functionalized CoFe2O4, pseudo-first-order,45 pseudo-second-order,46 Elovich equation47 and intraparticle diffusion48 models were employed to deal with the kinetic data. All the kinetic equations are summarized in Table 1, where qe and qt are the adsorption capacity (mg g−1) at equilibrium and time t (min), k is the rate constant, h (mg g−1 min−1) is the initial adsorption rate in pseudo-second-order model determined by k2 and qe, α (mg g−1 min−1) is the initial adsorption rate, β (g mg−1) is the desorption constant related to the extent of surface coverage and activation energy constant for chemisorption, and R2 is the correlation coefficients to demonstrate the uniformity between the experimental data and model-predicted values.
The parameters for the four kinetic models for adsorption of Cu(II) on EDTA functionalized CoFe2O4 are listed in Table 1. The values of R2 for the pseudo-first-order kinetic model were relatively low and the calculated qe values did not agree with the experimental ones, suggesting that the pseudo-first-order kinetic model could not adequately describe the adsorption process. Actually, in most cases in the literature the pseudo-first-order kinetic equation is generally applicable over the initial stage of the adsorption processes and does not fit well to the whole range of contact time.4,10,37 However, the R2 values obtained from the pseudo-second-order kinetic model were higher than 0.99 and the calculated qe values agreed very well with the experimental ones, indicating that the experimental data were in good agreement with the pseudo-second-order model and the chemisorption was the rate-controlling step in the adsorption process.10
According to the intraparticle diffusion model, if the plot of qt versus t1/2 gives a straight line, then intraparticle diffusion is involved in the adsorption process and if this line passes through the origin then intraparticle diffusion is the rate-controlling step. While, if the data exhibit multi-linear plots, then two or more steps influence the adsorption process such as external diffusion or intraparticle diffusion.4,48 In the present study, the plot showed a multi-straight-line nature, revealing different stages involved in the adsorption process. The initial sharp-sloped stage was dominated by external mass transfer, during which the adsorbate in solution reached the surface of the adsorbent through the boundary layer. The second portion was attributed to the gradual adsorption stage, where the intra-particle diffusion was rate-controlled. The intraparticle diffusion started to slow down and reached the final equilibrium stage because of the low Cu(II) concentration in solution as well as less number of available adsorption sites. Since the rate of external mass transfer (ki,1) was higher than that of internal transfer (ki,2 and ki,3), indicating that the internal transfer might be the rate-limiting step, and the adsorption rate was governed by particle diffusion.49
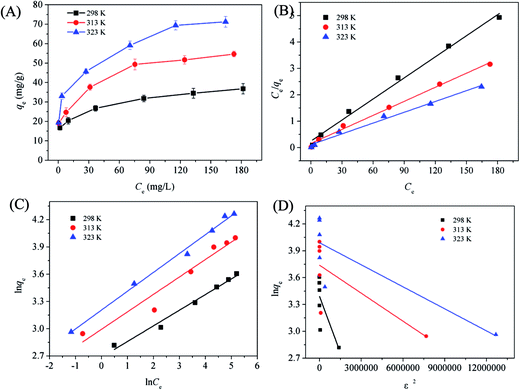
To evaluate the relationship between Cu(II) and the adsorbent at equilibrium and to seek the maximum adsorption capacity of the adsorbent, the adsorption isotherm data were further fitted using Langmuir,50 Freundlich,51 and Dubinin-Radushkevich (D-R)52 isotherm models in this study. The equations are expressed as follows:
Langmuir:
 | (3) |
Freundlich:
| qe = KFCe1/n | (4) |
D-R:
| qe = qse−βε2 | (5) |
![[thin space (1/6-em)]](https://www.rsc.org/images/entities/char_2009.gif) ln(1 + 1/Ce).
ln(1 + 1/Ce).
Fig. 6(B–D) shows the linear plot for Cu(II) adsorption onto 1EDTA-MNP based on linear Langmuir, Freundlich, and D-R isotherm models. The obtained values for the isotherm constants and correlation coefficients (R2) are summarized in Table 2. The results showed that the R2 value of Langmuir isotherm were much higher that of Freundlich and D-R isotherms, suggesting the adsorption of Cu(II) took place at specific homogeneous reactive sites on 1EDTA-MNP and was probably a monomolecular layer process.4,46 The essential feature of Langmuir isotherm model could be expressed in terms of a dimensionless constant reparation factor RL, which could be defined by RL = 1/(1 + KLC0). The value indicates that the adsorption process is favorable (0 < RL < 1), unfavorable (RL >1), linear (RL = 1) and irreversible (RL = 0). In the present study, the separation factor was calculated to be in the range from 0 to 1, indicating that the magnetic EDTA functionalized CoFe2O4 was a suitable adsorbent for Cu(II) removal from aqueous solution.
| T (K) | qe,exp (mg g−1) | Langmuir isotherm | Freundlich isotherm | D-R isotherm | ||||||
|---|---|---|---|---|---|---|---|---|---|---|
| qm (mg g−1) | KL (L mg−1) | R2 | KF (mg g−1) | n | R2 | qs | β | R2 | ||
| 298 | 36.82 | 37.58 | 0.1072 | 0.9925 | 14.69 | 5.80 | 0.9708 | 29.67 | 4.20 × 10⁻⁷ | 0.4705 |
| 313 | 54.66 | 56.33 | 0.1123 | 0.9932 | 19.96 | 5.20 | 0.9377 | 42.06 | 1.04 × 10⁻⁷ | 0.4452 |
| 323 | 71.24 | 73.26 | 0.1217 | 0.9920 | 24.67 | 4.81 | 0.9919 | 54.05 | 8.21 × 10⁻⁸ | 0.6197 |
Although the R2 values for the Freundlich isotherm model were less than that for the Langmuir model, they exceeded 0.90 in all temperatures. It is known that the Freundlich isotherm model is characterized by 1/n. In this study, the values of 1/n obtained for different temperatures were less than unity, suggesting that Cu(II) in water could be easily adsorbed onto the surface of 1EDTA-MNP.4 Generally, the KF value is roughly an indicator of the adsorption capacity. It was found to be increased with the increment of temperature, implying that the adsorption capacity of EDTA functionalized CoFe2O4 for Cu(II) increased with the rise of temperatures.
To assess the adsorption ability of the proposed adsorbent, a comparative evaluation was made between 1EDTA-MNP and some other reported nanostructured materials. It was very important to note that the adsorption capacity of Cu(II) exhibited by 1EDTA-MNP (73.26 mg g−1) was higher than that of modest of the reported materials such as magnetic chitosan nanoparticles (35.50 mg g−1), chitosan-bound Fe3O4 magnetic nanoparticles (21.50 mg g−1), humic acid modified HAP nanoparticles (58.42 mg g−1), EDTA functionalized magnetic nanoparticles (46.27 mg g−1), multiwalled carbon nanotubes (24.49 mg g−1), magnesium chloride-modified Lentinula edodes (59.03 mg g−1), functional polymers-modified activated carbon (31.46 mg g−1), diatomite (17.22 mg g−1), MNP (17.60 mg g−1), GA–MNP (38.50 mg g−1), bentonite–polyacrylamide composites (35.00 mg g−1), carbon nanotubes–iron oxides (38.34 mg g−1), maghemite nanoparticle (27.70 mg g−1), and gum arabic modified magnetic nanoparticles (38.50 mg g−1) (as listed in Table 3), expressing a strong potential in the application of Cu(II) removal from aqueous solution.
| Adsorbent | qm (mg g−1) | References |
|---|---|---|
| Magnetic chitosan nanoparticles | 35.50 | 1 |
| Chitosan-bound Fe3O4 magnetic nanoparticles | 21.50 | 2 |
| Humic acid modified HAP nanoparticles | 58.42 | 4 |
| EDTA functionalized magnetic nanoparticles | 46.27 | 5 |
| Multiwalled carbon nanotubes | 24.49 | 7 |
| Magnesium chloride-modified Lentinula edodes | 59.03 | 10 |
| Functional polymers-modified activated carbon | 31.46 | 11 |
| Diatomite | 17.22 | 14 |
| MNP | 17.60 | 37 |
| GA–MNP | 38.50 | 37 |
| Bentonite–polyacrylamide composites | 35.00 | 38 |
| Carbon nanotubes–iron oxides | 38.34 | 40 |
| Maghemite nanoparticle | 27.70 | 53 |
| Gum arabic modified magnetic nanoparticles | 38.50 | 54 |
| Poly(catechol-diethylenetriamine-p-phenylenediamine) particles | 44.20 | 55 |
| 1EDTA-MNP | 73.26 | Present work |
The element content of 1EDTA-MNP before and after Cu(II) adsorption obtained from the XPS result were carried out to study the stability of the adsorbent. It could be observed from Table 4 that the mass content of Co, Fe, C, N, and H in the synthesized 1EDTA-MNP remained constant before and after Cu(II) adsorption, indicating the good stability of the adsorbent.
| Co | Fe | O | C | N | H | Cu | Total | |
|---|---|---|---|---|---|---|---|---|
| 1EDTA-MNP | 11.24% | 22.77% | 49.62% | 14.86% | 0.93% | 0.58% | — | 100% |
| 1EDTA-MNP after Cu(II) adsorption | 11.07% | 22.29% | 46.29% | 14.44% | 0.89% | 0.64% | 4.38% | 100% |
4. Conclusions
This work highlighted potential application in wastewater treatment by the EDTA-MNP nanoparticles, which was prepared through a novel one-pot route functionalized reaction. Some main conclusions could be drawn as following. Experiments revealed that the nanostructured EDTA-MNP adsorbent has much higher adsorption capacity than that of most of the reported adsorption materials. Cu(II) adsorption on EDTA-MNP was dependent on the EDTA mass in the composite, initial solution pH, and temperature. The adsorption kinetics for the removal of Cu(II) by EDTA-MNP was well explained by pseudo-second-order kinetic model which suggested that the Cu(II) uptake was a chemisorption process. The equilibrium data could be well described by the Langmuir model, the maximum adsorption capacity for Cu(II) on the basis of which was calculated to be 73.26 mg g−1, which could be attributed to multiple adsorption interaction mechanisms between Cu(II) and adsorbent (ion exchange with Na+ and surface complexation with the carboxylic groups of EDTA). Besides, the adsorption capacity of the EDTA functionalized CoFe2O4 could still keep more than 90% after three adsorption–desorption cycles. Results of this work were of great significance for environmental applications of EDTA-MNP as a promising adsorbent nanomaterial for preconcentration and removal of Cu(II) from aqueous solution or wastewater, and it also provided a very effective way to improve the adsorption affinity of metallic contaminants onto ferrite or some other metal oxide.Acknowledgements
This work was financially supported by the National Science & Technology Pillar Program during the Twelfth Five-year Plan Period (2012BAJ24B03).References
- Y. Chen and J. Wang, Chem. Eng. J., 2011, 168, 286 CrossRef CAS.
- Y. C. Chang and D. H. Chen, J. Colloid Interface Sci., 2005, 283, 446 CrossRef CAS PubMed.
- P. Liu, B. Garrido, K. Oksman and A. P. Mathew, RSC Adv., 2016, 6, 107759 RSC.
- L. Yang, Z. G. Wei, W. H. Zhong, J. Cui and W. Wei, Colloids Surf., A, 2016, 490, 9 CrossRef CAS.
- Y. Liu, M. Chen and Y. M. Hao, Chem. Eng. J., 2013, 218, 46 CrossRef CAS.
- M. L. Chen, C. B. Huo, Y. K. Li and J. H. Wang, ACS Sustainable Chem. Eng., 2016, 4, 1296 CrossRef CAS.
- Y. H. Li, J. Ding, Z. K. Luan, Z. C. Di, Y. F. Zhu, C. L. Xu, D. H. Wu and B. Q. Wei, Carbon, 2003, 41, 2787 CrossRef CAS.
- C. Gerente, V. K. C. Lee, P. Le Cloirec and G. McKay, Crit. Rev. Environ. Sci. Technol., 2007, 37, 41 CrossRef CAS.
- R. Jayakumar, M. Rajasimman and C. Karthikeyan, Ecotoxicol. Environ. Saf., 2015, 121, 199 CrossRef CAS PubMed.
- H. Xie, Q. Q. Zhao, Z. R. Zhou, Y. M. Wu, H. C. Wang and H. Xu, RSC Adv., 2015, 5, 33478 RSC.
- S. Zhu, N. Yang and D. Zhang, Mater. Chem. Phys., 2009, 113, 784 CrossRef CAS.
- D. Lima Guerra, C. Airoldi and K. S. de Sousa, Appl. Surf. Sci., 2008, 254, 5157 CrossRef.
- W. Qiu and Y. Zheng, Chem. Eng. J., 2009, 145, 483 CrossRef CAS.
- M. Safa, M. Larouci, B. Meddah and P. Valemens, Water Sci. Technol., 2012, 65, 1729 CrossRef CAS PubMed.
- N. S. Rajurkar, A. N. Gokarn and K. Dimya, Clean: Soil, Air, Water, 2011, 39, 767 CrossRef CAS.
- W. L. Sun, J. Xia and Y. C. Shan, Chem. Eng. J., 2009, 145, 483 CrossRef.
- T. Hikov, M. K. Schroeter, L. Khodeir, A. Chemseddine, M. Muhler and R. A. Fischer, Phys. Chem. Chem. Phys., 2006, 8, 1550 RSC.
- S. Pacheco and R. Rodriguez, J. Sol-Gel Sci. Technol., 2001, 20, 263 CrossRef CAS.
- D. H. K. Reddy and Y. S. Yun, Coord. Chem. Rev., 2016, 315, 90 CrossRef CAS.
- S. Zhang, H. Niu, Y. Cai, X. Zhao and Y. Shi, Chem. Eng. J., 2010, 158, 599 CrossRef CAS.
- A. A. Farghali, M. Bahgat, W. M. A. El Rouby and M. H. Khedr, J. Solution Chem., 2012, 41, 2209 CrossRef CAS.
- N. Li, M. Zheng, X. Chang, G. Ji, H. Lu and L. Xue, J. Solid State Chem., 2011, 184, 953 CrossRef CAS.
- L. Ai, H. Huang, Z. Chen, X. Wei and J. Jiang, Chem. Eng. J., 2010, 156, 243 CrossRef CAS.
- L. Deng, Z. Shi and X. Y. Peng, RSC Adv., 2015, 5, 49791 RSC.
- J. Hu, I. M. C. Lo and G. Chen, Langmuir, 2015, 21, 11173 CrossRef PubMed.
- Y. Deng, D. Qi, C. Deng, X. Zhang and D. Zhao, J. Am. Chem. Soc., 2007, 130, 28 CrossRef PubMed.
- L. Zhou, Y. Wang, Z. Liu and Q. Huang, J. Hazard. Mater., 2009, 161, 995 CrossRef CAS PubMed.
- W. Yantasee, C. L. Warner, T. Sangvanich, R. S. Addleman, T. G. Carter, R. J. Wiacek, G. E. Fryxell, C. Timchalk and M. G. Warner, Environ. Sci. Technol., 2007, 41, 5114 CrossRef CAS PubMed.
- X. J. Hou, X. P. Huang, Z. H. Ai, J. C. Zhao and L. Z. Zhang, J. Hazard. Mater., 2016, 310, 170 CrossRef CAS PubMed.
- L. H. Ai and L. L. Li, Chem. Eng. J., 2013, 223, 688 CrossRef CAS.
- E. Repo, J. K. Warchol, T. A. Kurniawan and M. E. T. Sillanpaa, Chem. Eng. J., 2010, 161, 73 CrossRef CAS.
- E. Repo, T. A. Kurniawan, J. K. Warchol and M. E. T. Sillanpaa, J. Hazard. Mater., 2009, 171, 1071 CrossRef CAS PubMed.
- L. Q. Yang, Y. F. Li, L. Y. Wang, Y. Zhang, X. J. Ma and Z. F. Ye, J. Hazard. Mater., 2010, 180, 98 CrossRef CAS PubMed.
- O. Abollino and M. Aceto, Water Res., 2003, 37, 1619 CrossRef CAS PubMed.
- Y. Ren, H. A. Abbood, F. B. He, H. Peng and K. X. Huang, Chem. Eng. J., 2013, 226, 300 CrossRef CAS.
- S. S. Banerjee and D. H. Chen, J. Hazard. Mater., 2007, 147, 792 CrossRef CAS PubMed.
- X. S. Wang, L. Zhu and H. J. Hu, Desalination, 2011, 276, 154 CrossRef CAS.
- G. Zhao, H. Zhang, Q. Fan, X. Ren, J. Li, Y. Chen and X. Wang, J. Hazard. Mater., 2010, 173, 661 CrossRef CAS PubMed.
- J. Huang, M. Ye, Y. Q. Qu, L. F. Chu, R. Chen, Q. Z. He and D. F. Xu, J. Colloid Interface Sci., 2012, 385, 137 CrossRef CAS PubMed.
- X. J. Peng, Z. K. Luan, Z. C. Di, Z. G. Zhang and C. L. Zhu, Carbon, 2005, 43, 880 CrossRef CAS.
- N. Mao, L. Q. Yang, G. H. Zhao, X. L. Li and Y. F. Li, Chem. Eng. J., 2012, 200–202, 480 CrossRef CAS.
- Z. C. Wu, Z. Z. Wang, J. Liu, J. H. Yin and S. P. Kuang, Colloids Surf., A, 2016, 499, 141 CrossRef CAS.
- X. Y. Li, Z. G. Niu, J. Jiang and L. H. Ai, J. Mater. Chem. A, 2016, 4, 3204 CAS.
- T. Tian, J. Jiang and L. H. Ai, Electrochim. Acta, 2017, 24, 551 CrossRef.
- S. Lagergren, K. Sven. Vetenskapsakad. Handl., 1898, 24, 1 Search PubMed.
- Y. S. Ho and G. McKay, Process Biochem., 1999, 34, 451 CrossRef CAS.
- S. V. Elovich and G. M. Zhabrova, J. Phys. Chem., 1939, 13, 1761 CAS.
- W. J. Web and J. C. Morris, J. Sanit. Eng. Div., Am. Soc. Civ. Eng., 1963, 89, 31 Search PubMed.
- L. Deng, Z. Shi, X. X. Peng and S. Q. Zhou, J. Alloys Compd., 2016, 688, 101 CrossRef CAS.
- I. Langmuir, J. Am. Chem. Soc., 1916, 40, 1361 CrossRef.
- H. M. F. Freundlich, Z. Phys. Chem., 1906, 57, 385 CAS.
- M. M. Dubinin and L. V. Radushkevich, Chem. Zentralbl., 1947, 1, 875 Search PubMed.
- J. Hu, G. H. Chen and I. M. C. Lo, J. Environ. Eng., 2006, 132, 709 CrossRef CAS.
- S. S. Banerjee and D. H. Chen, J. Hazard. Mater., 2007, 147, 792 CrossRef CAS PubMed.
- Q. Liu, Q. Z. Liu, Z. N. Ruan, X. Q. Chang and J. S. Yao, Ecotoxicol. Environ. Saf., 2016, 129, 273 CrossRef CAS PubMed.
| This journal is © The Royal Society of Chemistry 2017 |

