 Open Access Article
Understanding the growth morphology of explosive crystals in solution: insights from solvent behavior at the crystal surface
Yingzhe Liu *,
Weipeng Lai,
Tao Yu,
Yiding Ma,
Ying Kang and
Zhongxue Ge
State Key Laboratory of Fluorine & Nitrogen Chemicals, Xi'an Modern Chemistry Research Institute, Xi'an 710065, China. E-mail: liuyz_204@163.com
First published on 5th January 2017
Abstract
The structural, energetic, and dynamic properties at the interfaces between the five growth faces of hexahydro-1,3,5-trinitro-1,3,5-triazine (RDX) crystal and acetone (AC) solvent were investigated by computational simulations with an aim to understand the RDX crystal morphology when grown from AC solvent at the molecular level. The simulation results showed that the solvent behavior, such as the mass density distribution, dipole orientation, interaction, and diffusion, was dependent on the structural features of each crystal surface. The binding sites for solvent incorporation at the crystal surface were found and were visually displayed on the basis of occupancy analysis. The typical binding motifs were extracted from the simulation trajectory, with the corresponding binding affinities estimated as (002) ≈ (210) > (200) > (020) > (111) at the M06-2X/6-31++G** level of theory. The theoretical prediction of the morphological importance of each growth face was in reasonable agreement with the experimental RDX morphology grown from AC solvent.
1. Introduction
The crystal morphology engineering of explosives has attracted increasing interest since the shape of explosive crystals influences many of their material properties, such as the packing density and their sensitivity versus external stimuli. Compared with sphere-shaped explosive crystals, needle-like ones generally have a lower packing density and higher mechanical and thermal sensitivity at the same size level, leading to poor performance and safety. However, control of the desired crystal morphology during the crystallization process still constitutes a challenge because the morphology of a growing explosive crystal depends not only on the internal crystal structures but also on the external growth conditions, including the crystallization technology, temperature, supersaturation, solvent, and the additive.1,2 Hence, understanding the growth mechanism and making an a priori prediction of an explosive crystal's morphology under the influence of different factors in time-consuming crystallization experiments is needed.In recent years, many approaches based on computational simulations have been employed to dissect the morphology resulting from the growth mechanism of an explosive crystal from a microscopic point of view, including the Bravais, Friedel, Donnay, and Harker (BFDH) rules,3–5 the attached energy model and its modification,6–14 the occupancy model,15 Monte Carlo simulation,16,17 the spiral growth model, and the 2D nucleation model.18–20 These methods evolved from geometry, energy, and mechanistic models, and extend the breadth of knowledge about the factors that influence the crystal morphology, ranging from the gas phase, the solvent medium, the temperature, and the additive to supersaturation, which helps researchers interpret and design crystallization experiments. While most studies have been focused on the prediction of an explosive crystal's morphology in solution, understanding of the solvent behavior and the interfacial interaction for the growth morphology of explosive crystals at the molecular level still remain inadequate.
Hexahydro-1,3,5-trinitro-1,3,5-triazine (RDX) is one of the most famous organic explosives and is widely applied in the military and industry. It was reported that diverse crystal morphologies of RDX can be obtained by using different solvents in the crystallization process, which largely affects the detonation and sensitivity properties.21–24 In the present study, acetone (AC) solvent was chosen because of its extensive use in RDX crystallization. Molecular dynamics (MD) simulations along with quantum chemistry (QC) calculations were employed to explore the behavior of the AC solvent at five morphologically important growth faces of the RDX crystal, i.e., the (111), (200), (020), (002), and (210) faces. The structural, energetic, and dynamic properties of the RDX–AC systems are discussed herein, as these are envisioned to offer exciting perspectives into the solvent effect on the RDX crystal morphology.
2. Methods
2.1 Molecular models
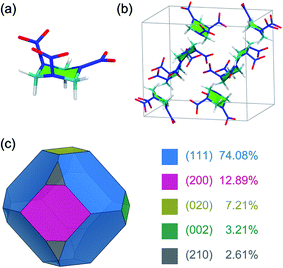
The α-form stable polymorph of the RDX crystal at ambient conditions was investigated in the present work. The initial structure of an RDX unit cell was taken from a single-crystal neutron,25 which has eight irreducible RDX molecules and which belongs to the orthorhombic crystal system (Pbca) with lattice parameters of a = 1.3182 nm, b = 1.1574 nm, and c = 1.0709 nm (Fig. 1). The RDX molecule in the α-form adopts the AAE conformation based on the orientations of the three nitro groups relative to the six-membered ring, where two nitro groups are at the pseudo-axial positions (A) and the remaining nitro group is at the pseudo-equatorial position (E) (Fig. 1).Previous experimental and simulation studies showed that the growth morphology of an RDX crystal is dominated by five growth faces, namely the (111), (200), (020), (002), and (210) faces.6,10,18 The morphological importance of these growth faces derived from the area percentage in vacuum was determined under BFDH rules, which can give a reasonable result for the growth morphology of the RDX crystal in vacuum (Fig. 1).6,9 In the MD simulation, the structure of the growth face was constructed by cleaving the RDX crystal along the five (h k l) indices and the normal to the growth face was aligned along the z-direction. Then, the crystal–solvent interfacial model was built by randomly placing the AC molecules above the RDX crystal surface according to the surface size. A 5 nm thickness vacuum layer was additionally set to eliminate the possible edge effect. The details of each molecular system, including the surface dimensions and the number of RDX and AC molecules, are summarized in Table 1.
| Interface | Surface dimensionsa/nm2 | NRDXb | NACc |
|---|---|---|---|
| a Length of the RDX crystal along the a and b axes, respectively, while the value in parentheses is the angle formed between the OA and OB vectors.b Number of RDX molecules.c Number of AC molecules. | |||
| (111) | 5.10 × 4.73 (64.6°) | 432 | 1000 |
| (200) | 4.63 × 4.28 (90.0°) | 384 | 1000 |
| (020) | 4.28 × 3.95 (90.0°) | 288 | 1000 |
| (002) | 3.95 × 4.63 (90.0°) | 336 | 1000 |
| (210) | 4.28 × 5.33 (90.0°) | 384 | 1000 |
2.2 Molecular dynamics simulation
All the atomistic MD simulations were performed with Materials Studio 8.0 software26 in the canonical ensemble. The COMPASS force field27 was utilized to describe the crystal–solvent interface system, which was validated by the lattice energy of the RDX crystal together with the density and solubility parameters of the AC solvent.10,15 Periodic boundary conditions were applied in the three directions of Cartesian space. The temperature was kept at 298 K with an Andersen thermostat. The electrostatic interactions were evaluated by the Ewald summation approach, and the van der Waals interactions were truncated by smoothing with a 1.2 nm spherical cutoff using the atom-based method. The equation of motion was integrated by a time step of 1 fs. After 15![[thin space (1/6-em)]](https://www.rsc.org/images/entities/char_2009.gif) 000 steps of energy minimization, each MD simulation for the RDX–AC system was carried out for 10 ns, and the trajectory data were collected every 2500 time steps. In all the simulations, the RDX surface was frozen along the a, b, and c directions, while the AC solvent could move freely. Partial visualization and analysis of the simulation trajectories were conducted with the help of the VMD package.28
000 steps of energy minimization, each MD simulation for the RDX–AC system was carried out for 10 ns, and the trajectory data were collected every 2500 time steps. In all the simulations, the RDX surface was frozen along the a, b, and c directions, while the AC solvent could move freely. Partial visualization and analysis of the simulation trajectories were conducted with the help of the VMD package.28
2.3 Quantum chemistry calculations
To quantify the binding affinity of the AC molecule at the binding site of the RDX crystal surface, electronic structure calculations were performed with the Gaussian09 (ref. 29) series of programs. The binding motif extracted from the simulation trajectory was composed of a single AC molecule and several RDX molecules surrounding it. The positions of the RDX molecules were frozen in all the QC calculations. The geometry of each binding motif was optimized and characterized to the relative energy minimum of the potential surface at the B3LYP-D3/6-31G* level of theory.30–32 The single point energies of the optimized structures were calculated at the M06-2X/6-31++G** level of theory.33 The basis set superposition error was considered using the standard counterpoise correction of Boys and Bernardi.34 The implicit environment of the AC solvent was described by the polarizable continuum model.353. Results
3.1 Mass density distribution
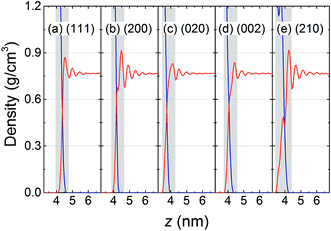
The typical interfaces between the RDX crystal and AC solvent characterized by their mass density profile along the normal to the crystal surface are shown in Fig. 2, in which the interfacial regions are defined according to the first prominent peak of solvent density, i.e., the gray areas. It is observed that layered distributions of AC solvent were formed in all five systems. The local density of AC solvent at the first peak is higher than the bulk density and is governed by the interfacial interactions of the RDX crystal with the AC molecules. For the (200) and (210) surfaces, the solvent densities at the first peak are highest, and are more than 0.9 g cm−3, suggesting the stronger interactions of the AC solvent with the (200) and (210) surfaces. As the distance between the AC solvent molecules and the RDX crystal increases, the solvent density profile fluctuates weakly and the local density gradually approaches the bulk density. Furthermore, it should be noted that a small peak of AC density is located in the region of 3.5–4.0 nm in the (210) system, indicating that the (210) surface is rougher than the other surfaces. The surface topography of the RDX crystal plays an important role in the solvent behavior other than just in the mass density distribution, such as in the orientation, interaction, and diffusion of AC molecules at the RDX surface.3.2 Dipole orientation
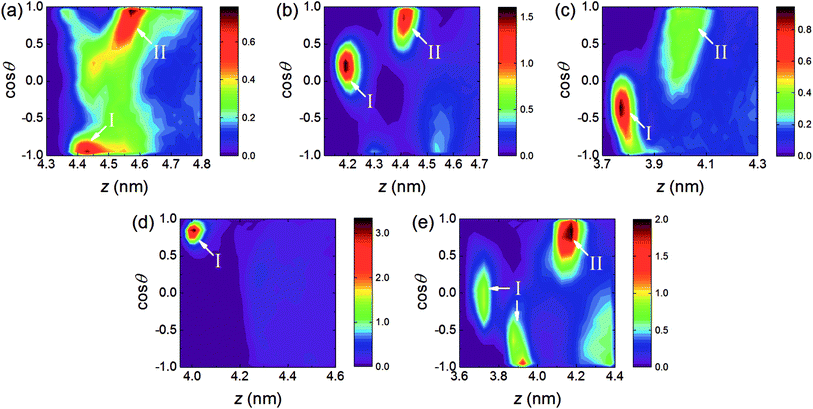
To understand the orientation of AC molecules in the interfacial region, the orientation angle θ is defined as the angle formed between the AC dipole vector and the normal to the RDX crystal surface (i.e., the z-axis). The populations as a function of the AC centroid position projected to the z-axis and the cosine of the orientation angle θ were calculated.As depicted in Fig. 3, preferred orientations of AC solvent are found among the five systems, indicating that the AC molecules are arranged in an ordered fashion in the interfacial region. Combined with the mass density profiles in Fig. 2, the preferred orientations can be divided into two types according to the position of the AC molecules: type I is located at the binding site, while type II is located at the first peak in the solvent density profile. For type I, only one preferred orientation is observed for all the surfaces, except for the (210) surface. In the (210) system, there exists two different preferred orientations of solvent molecules, indicative of two binding motifs induced by the rough surface. Besides, the distribution of preferred orientations at the binding sites is different for each system, which is attributed to the structural difference of the five crystal surfaces. For type II, no preferred orientation of AC molecules was discovered in the (002) system, and the distribution was as uniform as in the bulk solvent. In the other interfacial regions, the distribution shape of the preferred orientation with type II is similar, whereby cos![[thin space (1/6-em)]](https://www.rsc.org/images/entities/char_2009.gif) θ ranges from 0.5 to 1.0 approximately, revealing that the high local densities at the first solvent peak are induced by the arrangement of AC molecules with special orientations.
θ ranges from 0.5 to 1.0 approximately, revealing that the high local densities at the first solvent peak are induced by the arrangement of AC molecules with special orientations.
In addition, it is evident from the populations that the color bar ranges in the (111) and (020) systems are less than 1% in Fig. 3, and thus the solvent proportions with the preferred orientations are small compared to the other three systems. In particular, the distribution shape of the AC molecules orientations is spread in the (111) system, demonstrating that the AC molecules arrangements with highly preferred orientations are difficult to be maintained by the relatively weak interactions between the AC solvent and the (111) surface.
3.3 Interaction energy
To quantitatively describe the interfacial interaction of the RDX crystal surface with the AC solvent, the interaction energy (Eint) of each system was calculated using the following formula:
 | (1) |
Fig. 4 displays the interaction energies of the AC solvent with the five crystal surfaces. It can be seen that the AC solvent at the (200) surface has the strongest interaction energy, which is also reflected by the highest density at the first solvent peak in Fig. 2. The weakest interaction energy was found for the (020) interface. The order of interaction energy among the five systems was (200) > (210) > (002) > (111) > (020). The interaction energies can be further broken down into the electrostatic and the van der Waals components. Evidently, the crystal–solvent interfacial interactions were mainly dominated by van der Waals forces in all the systems, except at the (200) interface. For the (200) interface, the contributions of the electrostatic and van der Waals interactions were almost equal. Moreover, the contribution of van der Waals component to the interaction energy was the highest, at 69%, in the (020) system.
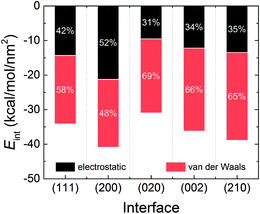 | ||
| Fig. 4 Average interaction energies of the RDX crystal with AC solvent obtained from the MD trajectory, including the electrostatic and van der Waals components. | ||
3.4 Residence probability
The crystal–solvent interaction can govern the dynamics behavior of solvent molecules in the interfacial region, such as solvent diffusion at the crystal surface. In this study, the diffusion of AC solvent was characterized by the residence probability function (P), which can be defined as:
 | (2) |
As displayed in Fig. 5, P decays most rapidly and approaches to 0 after ca. 0.6 ns for the (111) and (020) surfaces, which is in accordance with the relative weak interfacial interactions seen in Fig. 4. The (200) and (002) systems rank second in terms of rapid decay, and almost no AC molecules could continue stay in the interfacial region during the simulation time of 2.0 ns. For the (210) surface, the longest residence time of the solvent molecules in the interfacial region was found, and P could keep steady at ca. 0.15 even after 2.0 ns. By observing the simulation trajectory, it could be inferred that the slowest decay of P in the (210) system derives from the firm incorporation of AC molecules at the binding site.
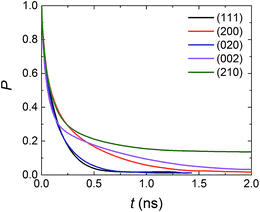 | ||
| Fig. 5 Residence probability function (P) of AC molecules in the interfacial region for the five systems. | ||
3.5 Binding site
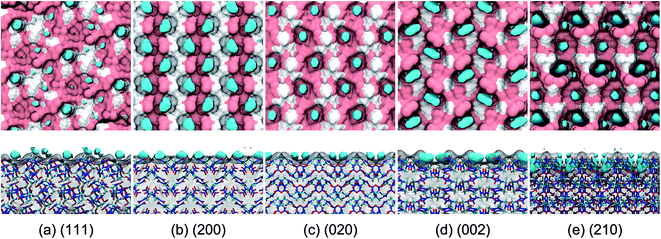
The binding sites for the incorporation of AC molecules at the crystal surface were obtained from a simulation trajectory based on the occupancy calculations. Herein, the three-dimensional (3D) space of the simulation box was fully divided into cubic grids with the size of 0.05 nm along each axis direction. For each grid, the occupancy was set to either 1 or 0, depending on whether the grid contained one or more AC atoms or not. Finally, the fractional occupancy was determined by averaging over the simulation trajectory for the last 5 ns. The binding sites could be continuously occupied by AC molecules for a long simulation time and thus had a high occupancy. For the sake of clarity, the binding sites are defined as the regions encompassed by the isosurface corresponding to an occupancy of 0.8, which are shown as the areas colored in cyan in Fig. 6.It is evident from Fig. 6 that the binding sites are concentrated at the cavities formed by the surface structure of the RDX crystal. For the (111) system, the surface is relatively flat and the arrangement of binding sites is disorderly, leading to the dispersive distribution of AC dipole orientation in Fig. 3. For the (210) system, by contrast, two preferred orientations of solvent molecules at the binding sites are induced by the rough and complex surface. The binding sites are arranged in a highly ordered pattern at the (200), (020), and (002) surfaces, which is in agreement with the unique preferred orientation of AC molecules (see Fig. 3). Furthermore, the binding sites in the (200) system are nearly equally composed of the polar and nonpolar regions of the RDX crystal surface, while the binding sites are fully formed by the polar part of the RDX molecules at the (020) surface.
As shown in the side views of Fig. 6, the AC molecules incorporated into the (210) binding sites are fully buried by the rough surface structure, and their contact with the solvent environment thus largely decrease. Accordingly, the residence time of solvent molecules at the (210) surface is the longest (see Fig. 5) due to the weak solvent–solvent interactions. In contrast, the majority of AC molecules at the (111) binding sites are exposed to the solvent medium, giving rise to the fast diffusion in the interfacial region.
3.6 Binding motif and affinity
To explore the binding affinities of an AC molecule incorporated into different binding sites, the typical binding motifs, consisting of a single AC molecule and the surrounding RDX molecules, were extracted from the simulation trajectory based on the above analysis of residence probability (Fig. 5) and binding sites (Fig. 6). The binding affinity can be estimated from the binding energy (Ebind) between AC and RDX in the binding motif, which was calculated using the following equation:| Ebind = −(Emotif − (EAC + ERDX)) | (3) |
The stable structure of each binding motif in the solvent medium optimized by B3LYP-D3/6-31G* level of theory is shown in Fig. 7. Due to the marginal solvent effect on the optimized structures, the stable motif structure in the gas phase is not shown here. It is obvious that the cavities formed by the RDX molecules in the (111) and (020) motifs are too narrow and shallow to accommodate the entire AC molecule. In the (200) motif, the AC molecule lies flatly at the cavity, which can maximize the contact with RDX molecules. The deepest cavity is found in the (210) motif, where the AC molecule is almost fully buried. The cavity formed by the (002) motif is the most suitable as it exactly matches the size of the AC solvent molecule.
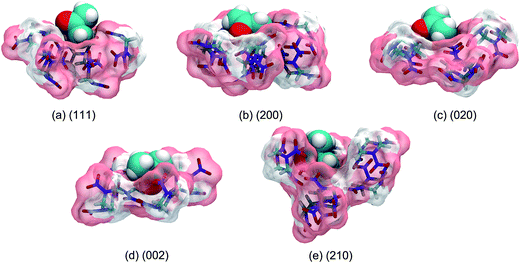 | ||
| Fig. 7 Optimized geometries of different binding motifs in the AC solvent medium at the B3LYP-D3/6-31G* level of theory. | ||
The binding energy of each binding motif is exhibited in Table 2. In the gas phase, it is not surprising that the binding energies of the (111) and (020) motifs are the smallest, i.e., 12.03 and 12.46 kcal mol−1, respectively, which is at least 4 kcal mol−1 lower than those of the other motifs. The (200) motif has the highest binding affinity, with a binding energy of 18.48 kcal mol−1. When the solvent medium is considered, the binding affinities of all the motifs are weakened owing to the influence of solvent–solvent interactions. Due to greater exposure of the bound AC molecule toward the solvent environment, the (200) motif has the largest reduction of binding energy from the gas phase to the solvent medium, i.e., more than 10 kcal mol−1. By contrast, the binding affinities of the (002) and (210) motifs are equally highest, because the bound AC molecules are segregated from the solvent environment to a great extent. The (111) and (020) motifs still have the two lowest binding affinities. In short, the order of binding affinities changes from (200) > (002) > (210) > (020) > (111) in the gas phase to (002) ≈ (210) > (200) > (020) > (111) in the solvent medium.
| Systems | Ebind (gas) | Ebind (sol) |
|---|---|---|
| (111) | 12.03 | 5.15 |
| (200) | 18.48 | 7.65 |
| (020) | 12.46 | 6.18 |
| (002) | 17.84 | 9.76 |
| (210) | 16.93 | 9.71 |
4. Discussions
The growth crystal morphology is determined by the relative growth rate of each crystal face along different directions, and the faster a face grows, the faster it disappears.36 When the RDX crystal grows from the AC solvent, the ordered arrangements of AC molecules with preferred orientations and high densities are found at the five growth faces, which inhibits the growth rate of the crystal faces due to the AC desolvation through the surface incorporation of RDX molecules into the growth sites. Generally, the solvent inhibition on the morphological importance of the crystal face is considered by the interactions of a solvent layer with a crystal face, i.e., the interaction energies in this work, in energy models, such as the attached energy method. However, the interaction energies only reflect the average behavior of a solvent layer in the interfacial region, including the bound and unbound AC molecules. The bound AC molecules at the binding sties actually play the key role in the inhibition effect for crystal face growth. The order of binding energies of different binding motifs is (002) ≈ (210) > (200) > (020) > (111). While that of interaction energies of the RDX surface with the AC solvent molecules is (200) > (210) > (002) > (111) > (020). In the present work, therefore, the morphological importance on the five growth faces of an RDX crystal in the AC solvent was estimated from the binding energies rather than from the interaction energies.It is documented in ref. 6 that “The experimental RDX crystal morphology from AC is dominated by the (200), (002), (111) and the (210) faces which are of about equal importance while the (020) face is rather small”. Based on the above simulation results, it can be understood that the (002) and (210) faces have the highest binding affinities with an AC molecule, and the corresponding relative growth rates are the slowest in the solvent. Accordingly, the morphological importance of the (002) and (210) faces are largely increased compared with that in vacuum. For the (111) and (020) faces, in contrast, the morphological importance is greatly reduced due to having the two lowest binding affinities with the solvent molecule. In particular, the (020) face area takes up only 7.21% of the total surface area of the crystal morphology in vacuum (see Fig. 1), and thus its contribution would be rather small in the solvent medium.
5. Conclusions
Atomistic MD simulations and QC calculations were conducted to decipher the solvent behavior of AC molecules at the five RDX crystal surfaces from a microscopic point of view toward understanding the growth morphology of an RDX crystal in solution. The following conclusions can be drawn from the present contribution.(i) A layered distribution of AC solvent molecules along the normal to the RDX crystal surface was observed in all five systems, and the local mass density of AC at the first prominent peak was higher than for the bulk density. As the distance between the AC solvent molecules and the crystal surface increases, the fluctuation of AC mass density profile is weakened and the local density gradually approaches to the bulk density. Similar dipole orientations of AC molecules at the first prominent solvent peak were found in all the systems, except for the (002) surface. Conversely, different preferred orientations of solvent molecules at the binding sites were discovered. Among the five systems, the orientation distribution of AC solvent in the (111) interfacial region was the most dispersive due to the relatively weak interactions.
(ii) The order of interaction energies between the solvent molecules with the five crystal surfaces was (200) > (210) > (002) > (111) > (020). More than half of the contribution to the interaction energy was dominated by the van der Waals component for all the systems, except for the (200) system, in which the contributions of electrostatic and van der Waals interactions were almost equal. Furthermore, the residence probability function showed that the AC solvent at the (111) and (020) interfaces had the fastest diffusion, while the longest residence time for AC molecules staying in the interfacial region was observed for the (210) system.
(iii) The binding sites for AC solvent incorporation at the crystal surface were found via occupancy calculations. The binding sites in the (200), (020), and (002) systems were concentrated and arranged in a highly ordered pattern. For the flat (111) surface, the binding sites were dispersive. More than one kind of binding sites was found in the (210) system due to the complex and rough surface structure. The binding motifs were extracted from the simulation trajectory and the binding energies were calculated in the gas phase and the solvent medium at the M06-2X/6-31++G** level of theory, respectively. The order of binding energies in the gas phase for the five motifs was (200) > (002) > (210) > (020) > (111), which became (002) ≈ (210) > (200) > (020) > (111) in the AC solvent. The results reported here may provide theoretical guidance for the morphology design of explosive crystals via modulating the solvent–crystal interactions, such as changing the solvent polarity.
Acknowledgements
The authors greatly appreciate the financial support from the National Natural Science Foundation of China (No. 21403162 and 21503160).References
- M. A. Lovette, A. R. Browning, D. W. Griffin, J. P. Sizemore, R. C. Snyder and M. F. Doherty, Crystal shape engineering, Ind. Eng. Chem. Res., 2008, 47, 9812–9833 CrossRef CAS.
- P. Dandekar, Z. B. Kuvadia and M. F. Doherty, Engineering crystal morphology, Annu. Rev. Mater. Res., 2013, 43, 359–386 CrossRef CAS.
- G. Friedel, Etudes sur la loi de Bravais, Bull. Soc. Fr. Mineral., 1907, 30, 326–455 Search PubMed.
- A. Bravais, Etudes Crystallographiques, Academie des Sciences, Paris, 1913 Search PubMed.
- J. D. H. Donnay and D. Harker, A new law of crystal morphology extending the law of Bravais, Am. Mineral., 1937, 22, 446–467 CAS.
- J. H. Ter Horst, R. M. Geertman, A. E. van der Heijden and G. M. van Rosmalen, The influence of a solvent on the crystal morphology of RDX, J. Cryst. Growth, 1999, 198, 773–779 CrossRef.
- X. H. Duan, C. X. Wei, Y. G. Liu and C. H. Pei, A molecular dynamics simulation of solvent effects on the crystal morphology of HMX, J. Hazard. Mater., 2010, 174, 175–180 CrossRef CAS PubMed.
- H. E. Lee, T. B. Lee, H. S. Kim and K. K. Koo, Prediction of the growth habit of 7-amino-4,6-dinitrobenzofuroxan mediated by cosolvents, Cryst. Growth Des., 2010, 10, 618–625 CAS.
- G. Chen, M. Z. Xia, W. Lei, F. Y. Wang and X. D. Gong, A study of the solvent effect on the morphology of RDX crystal by molecular modeling method, J. Mol. Model., 2013, 19, 5397–5406 CrossRef CAS PubMed.
- G. Chen, M. Z. Xia, W. Lei, F. Y. Wang and X. D. Gong, Prediction of crystal morphology of cyclotrimethylene trinitramine in the solvent medium by computer simulation: a case of cyclohexanone solvent, J. Phys. Chem. A, 2014, 118, 11471–11478 CrossRef CAS PubMed.
- G. Chen, C. Y. Chen, M. Z. Xia, W. Lei, F. Y. Wang and X. D. Gong, A study of the solvent effect on the crystal morphology of hexogen by means of molecular dynamics simulations, RSC Adv., 2015, 5, 25581–25589 RSC.
- W. Y. Shi, Y. T. Chu, M. Z. Xia, W. Lei and F. Y. Wang, Crystal morphology prediction of 1,3,3-trinitroazetidine in ethanol solvent by molecular dynamics simulation, J. Mol. Graphics Modell., 2016, 64, 94–100 CrossRef CAS PubMed.
- T. Yan, J. H. Wang, Y. C. Liu, J. Zhao, J. M. Yuan and J. H. Guo, Growth and morphology of 1,3,5,7-tetranitro-1,3,5,7-tetraazacy-clooct ane (HMX) crystal, J. Cryst. Growth, 2015, 430, 7–13 CrossRef CAS.
- N. Liu, Y. N. Li, S. Zeman, Y. J. Shu, B. Z. Wang, Y. S. Zhou, Q. L. Zhao and W. L. Wang, Crystal morphology of 3,4-bis(3-nitrofurazan-4-yl)furoxan (DNTF) in a solvent system: molecular dynamics simulation and sensitivity study, CrystEngComm, 2016, 18, 2843–2851 RSC.
- C. Y. Zhang, C. L. Ji, H. Z. Li, Y. Zhou, J. J. Xu, R. J. Xu, J. Li and Y. J. Luo, Occupancy model for predicting the crystal morphologies influenced by solvents and temperature, and its application to nitroamine explosives, Cryst. Growth Des., 2013, 13, 282–290 CAS.
- L. A. Zepeda-Ruiz, A. Maiti, R. Gee, G. H. Gilmer and B. L. Weeks, Size and habit evolution of PETN crystals—a lattice Monte Carlo study, J. Cryst. Growth, 2006, 291, 461–467 CrossRef CAS.
- A. Maiti and R. H. Gee, Modeling growth, surface kinetics, and morphology evolution in PETN, Propellants, Explos., Pyrotech., 2009, 34, 489–497 CAS.
- H. M. Shim and K. K. Koo, Crystal morphology prediction of hexahydro-1,3,5-trinitro-1,3,5-triazine by the spiral growth model, Cryst. Growth Des., 2014, 14, 1802–1810 CAS.
- H. M. Shim and K. K. Koo, Prediction of growth habit of β-cyclotetramethylene-tetranitramine crystals by the first-principles models, Cryst. Growth Des., 2015, 15, 3983–3991 CAS.
- H. M. Shim, H. S. Kim and K. K. Koo, Molecular modeling on supersaturation-dependent growth habit of 1,1-diamino-2,2-dinitroethylene, Cryst. Growth Des., 2015, 15, 1833–1842 CAS.
- J. H. Ter Horst, R. M. Geertman and G. M. van Rosmalen, The effect of solvent on crystal morphology, J. Cryst. Growth, 2001, 230, 277–284 CrossRef CAS.
- A. E. D. M. van der Heijden and R. H. B. Bouma, Crystallization and characterization of RDX, HMX, and CL-20, Cryst. Growth Des., 2004, 4, 999–1007 CAS.
- C. W. Roberts, S. M. Hira, B. P. Mason, G. F. Strouse and C. A. Stoltz, Controlling RDX explosive crystallite morphology and inclusion content via simple ultrasonic agitation and solvent evaporation, CrystEngComm, 2011, 13, 1074–1076 RSC.
- C. Spyckerelle, G. Eck, P. Sjöberg and A. M. Amneéus, Reduced sensitivity RDX obtained from Bachmann RDX, Propellants, Explos., Pyrotech., 2008, 33, 14–19 CrossRef CAS.
- C. S. Choi and E. Prince, The crystal structure of cyclotrimethylenetrinitramine, Acta Crystallogr., Sect. B: Struct. Crystallogr. Cryst. Chem., 1972, 28, 2857–2862 CrossRef CAS.
- Material Studio 8.0, Acceryls Inc., San Diego, 2014 Search PubMed.
- H. Sun, COMPASS: an ab initio force-field optimized for condensed-phase applications overview with details on alkane and benzene compounds, J. Phys. Chem. B, 1998, 102, 7338–7364 CrossRef CAS.
- W. Humphrey, A. Dalke and K. Schulten, VMD: visual molecular dynamics, J. Mol. Graphics, 1996, 14, 33–38 CrossRef CAS PubMed.
- M. J. Frisch, G. W. Trucks, H. B. Schlegel, G. E. Scuseria, M. A. Robb, J. R. Cheeseman, G. Scalmani, V. Barone, B. Mennucci and G. A. Petersson, et al., Gaussian 09, revision B.01, Gaussian, Inc., Wallingford CT, 2009 Search PubMed.
- C. Lee, W. Yang and R. G. Parr, Development of the Colle–Salvetti correlation-energy formula into a functional of the electron density, Phys. Rev. B: Condens. Matter Mater. Phys., 1988, 37, 785–789 CrossRef CAS.
- A. D. J. Becke, Density-functional thermochemistry. III. The role of exact exchange, Chem. Phys., 1993, 98, 5648–5652 CAS.
- S. Grimme, Density functional theory with London dispersion corrections, Wiley Interdiscip. Rev.: Comput. Mol. Sci., 2011, 1, 211–228 CrossRef CAS.
- Y. Zhao and D. G. Truhlar, The M06 suite of density functionals for main group thermochemistry, thermochemical kinetics, noncovalent interactions, excited states, and transition elements: two new functionals and systematic testing of four M06-class functionals and 12 other functionals, Theor. Chem. Acc., 2008, 120, 215–241 CrossRef CAS.
- S. F. Boys and F. Bernardi, Calculation of small molecular interactions by differences of separate total energies – some procedures with reduced errors, Mol. Phys., 1970, 19, 553–566 CrossRef CAS.
- J. Tomasi, B. Mennucci and R. Cammi, Quantum mechanical continuum solvation models, Chem. Rev., 2005, 105, 2999–3093 CrossRef CAS PubMed.
- P. Hartman and P. Bennema, The attachment energy as a habit controlling factor: I. Theoretical considerations, J. Cryst. Growth, 1980, 49, 145–156 CrossRef CAS.
| This journal is © The Royal Society of Chemistry 2017 |

