 Open Access Article
Creative Commons Attribution 3.0 Unported Licence
Nano-montmorillonite modified foamed paste with a high volume fly ash binder
Zhipeng Lia,
Jing Gong*ab,
Sen Duc,
Jianlin Wua,
Jianfen Lid,
Daniel Hoffmanc and
Xianming Shi *ac
*ac
aSchool of Civil Engineering and Architecture, Wuhan Polytechnic University, Wuhan 430023, China. E-mail: gongjingshao@163.com; xianming.shi@wsu.edu
bCollege of Urban Construction, Wuchang University of Technology, Wuhan 430223, China
cLaboratory for Advanced & Sustainable Cementitious Materials, Department of Civil and Environmental Engineering, Washington State University, Pullman, WA 99164, USA
dSchool of Chemical Engineering and Environment, Wuhan Polytechnic University, Wuhan 430023, China
First published on 3rd February 2017
Abstract
This laboratory study explores a cost-effective and environmental friendly foamed paste with satisfactory physical properties and outstanding thermal insulation properties. Such a composite material was made by using a high volume of class F coal fly ash as a replacement of Portland cement (70% by mass) and nano-montmorillonite as an admixture. Replacing cement with fly ash at high levels is environmentally and economically desirable, as this not only reduces the energy and carbon footprint of the foamed paste, but also diverts the coal fly ash from the waste stream. A statistical design of experiments was adopted and executed to investigate the effects of various factors on the properties of the composite. At the age of 28 days, the pastes exhibited a high compressive strength ranging from 1.77 MPa to 6.51 MPa and a low thermal conductivity in the range of 0.071 W (m−1 K−1) to 0.173 W (m−1 K−1). Two foamed mixes were chosen for further investigation as they presented the best and worst performance as a thermal insulation material. The scanning electron microscopy shed light on the best foamed mix, which contains 70% fly ash, 30% cement, and 1% nano-montmorillonite, and how its microstructure differed from that of the worst mix without nano-montmorillonite. The Ca content, Si/Ca ratio and Al/Ca ratio were obtained from energy-dispersive X-ray spectroscopy of hardened samples, and used to help explain the observed strength difference between these two mixes. X-ray diffraction was also employed to elucidate the hydration mechanism of HVFC foamed paste.
Introduction
Organic thermal insulation materials (TIMs) have been widely used in developing countries. Yet, they are known as the most dangerous source of fire hazard in buildings, especially in high-rise buildings where it is very difficult to douse fire from the ground.1 The inherent drawbacks of traditional organic TIMs highlight the urgent need to develop alternative TIMs that are nonflammable, light-weight, and sufficiently strong.Foamed paste and foamed concrete have attracted much attention as a type of promising TIM, in light of the inorganic, non-flammable, and porous properties of these cementitious materials.2–6 Typically, a foaming method is employed to introduce high porosity into such composite materials, resulting in a thermal conductivity ranging from 0.15 W m−1 K−1 to 0.45 W m−1 K−1 and a compressive strength ranging from about 1.5 MPa to 6.5 MPa.7–12
The main raw material of the inorganic TIMs is Portland cement, the production of which is known to pose many concerns to environmental sustainability, including high-energy consumption, the release of air pollutants such as NXOY and SO2, and the emission of greenhouse gases such as CO2. Fly ash, a main by-product of coal-fired power plants, has become one of the most used supplementary cementitious materials (SCMs) in concrete industry.13–16 Using fly ash as a SCM can not only reduce the carbon footprint and embodied energy of the concrete, but also reduce the hazards it may bring to the environment.17
Coal fly ash is one of the most complex anthropogenic materials.17 While conventional practices have limited the replacement of cement by coal fly ash to no more than 30 wt% to ensure the strength and durability properties of concrete,18 recent years have seen replacement levels between 50% and 80%, i.e., high volume fly ash (HVFA) concretes. HVFA concretes can be used in structural projects providing good workability, high mechanical strength, and durability comparable to ordinary Portland cement (OPC) concrete.19–21 Numerous studies have reported that the HVFA concrete featured a reduced water and gas permeability relative to its OPC counterpart.22–24 Yet, little research has been reported to elucidate the mechanisms underlying the hydration process of HVFA foamed paste or its microstructure.
In this context, this laboratory study aims to explore the feasibility of using a HVFA binder to produce foamed paste for TIM applications. To further improve the performance of foamed paste, this study investigates the potential benefits of incorporating nano-montmorillonite (nMMT) as an admixture. Compared with other nanomaterials, nMMT features great absorption and cation exchange capacity (due to its special nanosheets structure) and is more affordable and environmentally sustainable.
Using HVFA binder in foamed paste is environmentally and economically desirable, as this not only reduces the energy and carbon footprints of the foamed paste, but also diverts the coal fly ash from waste stream. This study also helps to achieve in-depth understanding of the hydration of nMMT-modified HFVA foamed paste.
Experimental
Materials
The cementitious binder used to fabricate the foamed paste samples featured a mixture of coal fly ash and Portland cement. The Portland cement was obtained from Cement Co., Ltd of Gezhouba Group (Hubei, China) and is categorized as PO42.5 cement per the Chinese National Standard GB175-2007. The class F fly ash (FA) was obtained from National Electric Power Co., Ltd. (Wuhan, China), mainly consisting of spherical particles as shown in Fig. 1. The chemical composition of cement and FA is provided in Table 1.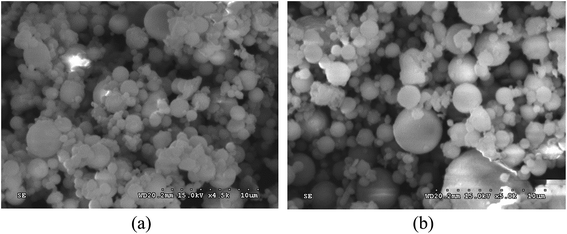 | ||
| Fig. 1 Scanning electron microscope (SEM) micrographs of the coal fly ash at two magnification levels: (a) 4500 times; (b) 5000 times. | ||
| Binder type | Composition | SiO2 | Al2O3 | Fe2O3 | CaO | MgO | Na2O | K2O | SO3 | LOIa |
|---|---|---|---|---|---|---|---|---|---|---|
| a Measured by following the ASTM D7348 – 13: Standard Test Methods for Loss on Ignition (LOI) of solid combustion residues. | ||||||||||
| Portland cement | Content (wt%) | 20.23 | 5.24 | 2.89 | 61.13 | 2.08 | 0.77 | 1.22 | 2.50 | 0.42 |
| Class F FA | 55.91 | 30.18 | 4.92 | 2.39 | 0.37 | 0.35 | 1.65 | 0.49 | 2.89 | |
The foaming agents used were sodium alpha-olefin sulfonate (AOS) and alcohol ethoxylate (AEO), whose characteristics are provided in Table 2. Both of the foaming agents were produced by Guangzhou Sui Xin Chemical Co., Ltd., China. The stabilizing agent used was sodium phosphate (Na3PO4, purity 99.5%), which was produced by Tianjin FuChen Chemical Reagent Factory, China.
| Agent | Character | Molecular weight | Active ingredient | Na2SO4 | Free alkali |
|---|---|---|---|---|---|
| AOS | White powder | 341 | 91.1% | 2.3% | 0.2% |
| AEO | Colorless oil | 319 | 85.7% | 3.0% | 0.2% |
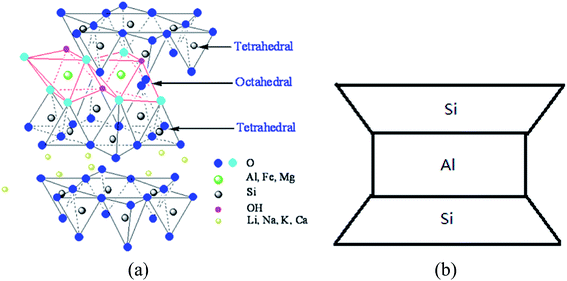
The nano-montmorillonite (nMMT) used was produced by Zhejiang FengHong New Materials Co., Ltd., which has a purity of 99.5% (Technical Grade) and features an apparent density of 0.35 g cm−3. The nMMT is hydrophilic and features high aspect ratio and a platelet structure, with each platelet less than 25 nm thick. The molecular diagram and reduced graph of such material are shown in Fig. 2.25
 | ||
| Fig. 2 Molecular diagram (a) and reduced graph (b) of nMMT.25 | ||
Experimental design
A statistical design of experiments, Uniform Design,26 was employed to evaluate the influence of mix design parameters on the compressive strength and thermal conductivity of the foamed paste. Also known as Space Filling Design, this experimental design method was proposed by Fang in 1978 (ref. 26) as an application of “pseudo-Monte Carlo method”, which focuses on the uniformity of data points in the test domain in order to obtain the most information through the least number of tests. This method considers only the test points spread evenly in the test range and are thus statistically representative via “uniform dispersion”, rather than “neat and comparable”.As shown in Table 3, the design scheme considered five factors, i.e., X1 (level of replacing cement by FA), X2 (AOS dosage), X3 (AEO dosage), X4 (Na3PO4 dosage), and X5 (nMMT dosage), each at three levels. Table 4 presents the uniform design scheme used, with a total of 18 runs, each representing a unique mix design of the foamed paste. For the samples, a water/binder ratio of 0.30 was used and the water used as tap water from Wuhan, China.
| Levels | Factors | ||||
|---|---|---|---|---|---|
| X1 | X2 | X3 | X4 | X5 | |
| FA/total binder | AOS/total binder | AEO/total binder | Na3PO4/total binder | nMMT/total binder | |
| 1 | 60% | 0 | 0 | 0 | 0 |
| 2 | 70% | 1% | 1% | 0.38% | 1% |
| 3 | 80% | 2% | 2% | 0.75% | 2% |
| Run no. | Factor X1 level | Factor X2 level | Factor X3 level | Factor X4 level | Factor X5 level |
|---|---|---|---|---|---|
| 1 | 1 | 1 | 1 | 1 | 3 |
| 2 | 1 | 3 | 3 | 3 | 3 |
| 3 | 1 | 2 | 2 | 2 | 2 |
| 4 | 1 | 2 | 3 | 1 | 1 |
| 5 | 1 | 1 | 2 | 3 | 1 |
| 6 | 1 | 3 | 1 | 2 | 3 |
| 7 | 2 | 2 | 3 | 1 | 2 |
| 8 | 2 | 3 | 2 | 2 | 3 |
| 9 | 2 | 1 | 3 | 1 | 2 |
| 10 | 2 | 1 | 2 | 3 | 1 |
| 11 | 2 | 2 | 1 | 3 | 1 |
| 12 | 2 | 3 | 1 | 2 | 3 |
| 13 | 3 | 3 | 2 | 1 | 1 |
| 14 | 3 | 1 | 1 | 3 | 2 |
| 15 | 3 | 2 | 1 | 3 | 3 |
| 16 | 3 | 3 | 3 | 1 | 3 |
| 17 | 3 | 2 | 2 | 2 | 2 |
| 18 | 3 | 1 | 3 | 2 | 1 |
Sample fabrication
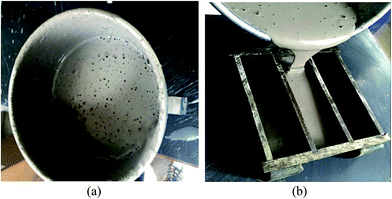
The process of fabricating the foamed paste samples is illustrated in Fig. 3. A total 1000 g of cement and fly ash was first dry-mixed in a mixer with a low stirring speed of about 500 rpm for 1 min. Then 100 ml water was poured into the dry mixture for another 1 min of mixing to make it moist. Subsequently, another 100 ml water containing the designed amount of AOS, AEO, Na3PO4, and nMMT was poured into the mixture and mixed for 1 min at about 1000 rpm. Note that these foaming agents and stabilizing agent had been dissolved in the water and used to soak the nMMT for 24 h to facilitate its dispersion. At last, the remaining 100 ml water was used to rinse any residual agents out of the water container and mixed for 3 min at about 1000 rpm. This made the mixture into an apparently homogeneous and flowable slurry, which was then cast into the steel (or polyvinyl chloride) molds, as shown in Fig. 3. The paste samples (both prisms and cylinders) were covered with a plastic membrane, demolded at 24 h, and then cured in a controlled environment (temperature: 20 ± 2 °C, relative humidity: 95%) for 7 d or 28 d. Before testing their engineering properties, the hardened samples were dried for 24 h at ambient temperature (20 ± 2 °C) and relative humidity 50%.Testing of engineering properties
For each mix design, six cylinder samples 100 mm in height and 100 mm in diameter were cast for the compressive strength test, which was conducted using an electro-hydraulic servo compression test machine (Fig. 4) with a loading speed of 0.1 MPa s−1. For each mix design, two prism samples with the dimension of 300 mm × 300 mm × 30 mm were cast for the thermal conductivity test, which was conducted using a PDR-300 thermal conductivity measurement device (Fig. 4), with the initial and final temperatures set at 20 °C and 60 °C, respectively. The accuracy of the machine was ±0.01 W (m−1 K−1) and the thermal conductivity of the duplicate samples exhibited very high reproducibility, all within the range of ±0.07 W (m−1 K−1).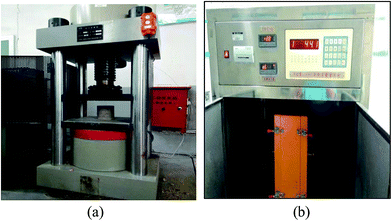 | ||
| Fig. 4 Computer-controlled compression test machine (a) and thermal conductivity measurement device (b). | ||
Advanced characterization
The surface morphology of the fly ash was observed by SEM, performed on a HITACHI S-3000N (Japan) scanning electron microscope, using an acceleration voltage of 15 kV. The same machine and setting were employed to examine the surface morphology of the microstructure of the selected paste sample at a low magnification level (e.g., 40×). A different scanning electron microscope, FEI HELIOS NanoLab 600i (Oregon, USA), was employed to examine the same paste samples at higher resolutions, using an acceleration voltage of 20 kV. This machine was also equipped to enable energy dispersive X-ray spectroscopy (EDX), a microanalytical unit for detection of small variations in trace element content, using an accelerating voltage of 20 kV and a scan time of 60 s per sampling area. X-ray diffraction (XRD) patterns of the fly ash and selected paste specimens were obtained on a D8 ADVANCE X-ray diffractometer manufactured by Bruker Technology Co., Ltd. (Wisconsin, USA) with Cu Kα radiation (λ = 1.54 Å).Results and discussion
Engineering properties of foamed paste
Experimental results of 7 d and 28 d compressive strength (CS) and 28 d thermal conductivity (TC) of the hardened foamed paste samples are presented in Table 5. The results suggest that the mix design plays a significant role in defining these engineering properties. The 7 d compressive strength of HVFC pastes ranged from 0.95 MPa to 4.01 MPa. At the age of 28 days, the HVFC pastes exhibited a high compressive strength ranging from 1.77 MPa to 6.51 MPa and a low thermal conductivity in the range of 0.071 W (m−1 K−1) to 0.173 W (m−1 K−1). Note that the non-foamed Portland cement paste (water/binder ratio of 0.30) exhibited a 28 d compressive strength of 52.5 MPa and a thermal conductivity of 0.453 W (m−1 K−1). It was infeasible to produce foamed pastes using either the cement or the fly ash as the sole binder.| Run No. | 1 | 2 | 3 | 4 | 5 | 6 | 7 | 8 | 9 |
| CS7 d (MPa) | 4.01 | 2.31 | 2.74 | 1.63 | 2.81 | 2.94 | 2.23 | 2.53 | 2.41 |
| CS28 d (MPa) | 6.51 | 3.01 | 4.27 | 2.73 | 5.64 | 4.37 | 3.23 | 3.08 | 4.24 |
| TC28 d (W m−1 °C−1) | 0.173 | 0.073 | 0.099 | 0.073 | 0.125 | 0.100 | 0.071 | 0.072 | 0.099 |
| Run No. | 10 | 11 | 12 | 13 | 14 | 15 | 16 | 17 | 18 |
| CS7 d (MPa) | 2.63 | 2.59 | 2.71 | 0.95 | 3.72 | 3.22 | 1.45 | 1.94 | 1.42 |
| CS28 d (MPa) | 5.12 | 4.48 | 3.44 | 1.77 | 6.30 | 4.77 | 2.34 | 3.31 | 3.23 |
| TC28 d (W m−1 °C−1) | 0.113 | 0.125 | 0.099 | 0.073 | 0.152 | 0.126 | 0.072 | 0.098 | 0.099 |
Mix #1 (with 60% FA and 2% nMMT and no other agents) exhibited the highest strength and thermal conductivity values, due to the absence of foaming agents and thus the formation of least porous microstructure. Mix #7 (with 70% FA, 1% AOS, 2% AEO, 0.75% Na3PO4, and 1% nMMT) exhibited the lowest thermal conductivity yet reasonably high strength values, representing the best TIMs among the mixtures investigated. Mix #13 (with 80% FA, 2% AOS, 1% AEO, no Na3PO4 or nMMT) exhibited the nearly lowest thermal conductivity but lowest strength values, representing the worst TIMs.
The experimental results were processed using multi-regression analysis, which aimed to correlate the CS7 d, CS28 d, and TC28 d with the five mix design parameters, respectively. Three predictive equations were established as follows:
| CS7 d = 4.81 − 0.04x1 − 1.92x2 + 2.29x5 + 0.02x1x2 + 0.02x1x4 − 0.02x1x5 − 0.91x3x4 |
| CS28 d = 8.05 − 0.06x1 − 3.58x2 + 4.29x5 + 0.04x1x2 + 0.05x1x4 − 0.05x1x5 − 1.18x2x4 − 1.14x3x4 |
| TC28 d = 0.1493 − 0.023x2 − 0.024x3 |
The predicted values agreed very well with the experimental values, with a very high coefficient of correlation (R2) between them. The R-square was 0.85, 0.98, and 0.89, for CS7 d, CS28 d, and TC28 d, respectively. Furthermore, good precision and confidence were found from these predictive models, the p value of which was significantly smaller than 0.05. As such, the established models can be used to illustrate the effect of significant factors on the response variable of interest. For instance, from the TC28 d model, one can conclude that the thermal conductivity of the foamed paste decreased linearly with the use of each foaming agent but was not significantly affected by the dosage of FA, Na3PO4, or nMMT in the mix.
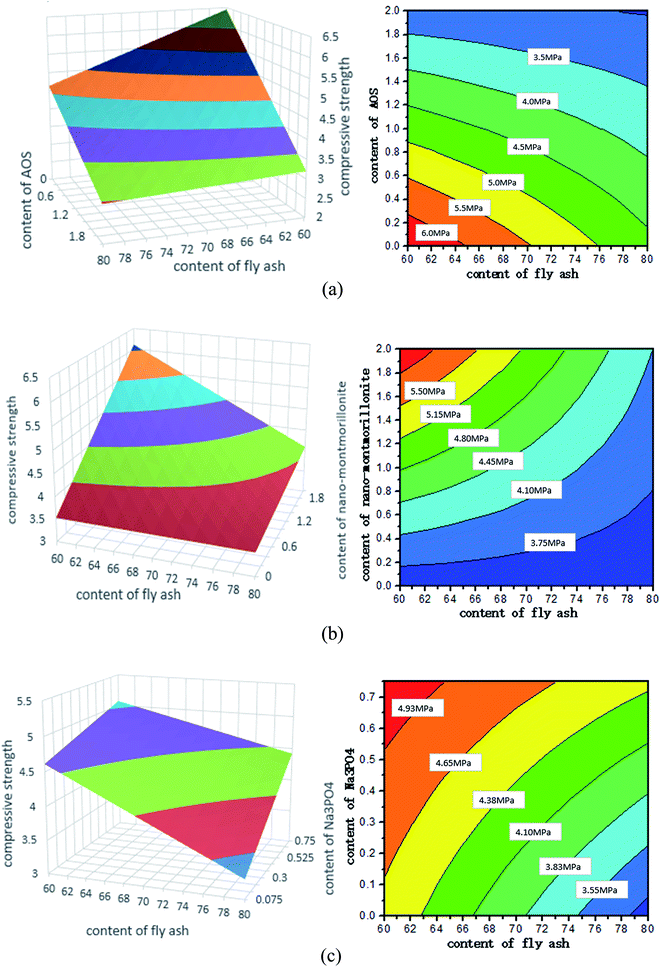
28 d compressive strength as a function of mix design
This section is devoted to understanding the 28 d compressive strength as a function of mix design of the pastes. This is necessary considering the existence of two-way interactions in the predictive equation for CS28 d. Fig. 5 presents some three-dimensional (3D) contour plots (left) to illustrate how CS28 d changes with variations in two selected factors of the foamed paste, with the other three design factors fixed at a certain level. Note that a corresponding contour map (right) is provided to supplement each 3D contour plot to make it clearer.Fig. 5 clearly illustrates the dependence of 28 d compressive strength of the foamed paste on four key design factors: the dosage of FA, AOS, Na3PO4, and nMMT. Fig. 8a shows that CS28 d increases with the use of a lower FA replacement level and a lower AOS dosage, with other factors fixed at a medium level. Fig. 8b shows that CS28 d increases with the use of a lower FA replacement level and a higher nMMT dosage, with other factors fixed at a medium level. Fig. 8c shows that CS28 d increases with the use of a lower FA replacement level and a higher Na3PO4 dosage, with other factors fixed at a medium level. The detrimental effect of AOS on the compressive strength of HVFC foamed paste is attributable to the introduction of porosity by AOS. The beneficial effect of Na3PO4 on the compressive strength of HVFC foamed paste is possibly attributable to the activation of fly ash particles by this alkaline substance.
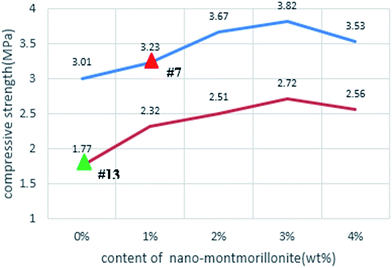
To confirm the beneficial role of admixing nMMT in the compressive strength of hardened HVFC foamed paste, a new set of laboratory experiments were conducted as follows. Starting from the two selected mixes (#7 and #13), four other mixes were fabricated to vary the nMMT content (0%, 1%, 2%, 3%, and 4%, by mass of total binder) while keeping other design factors unchanged. As illustrated in Fig. 6, in both cases, CS28 d increased with the increase in the nMMT dosage from 0% to 3% and then slightly decreased once the nMMT dosage further increased from 3% to 4%. This observed trend coincided with another study, where admixing another type of nanoclay (halloysite) up to 3% by mass of cement increased the 28 d compressive strength of cement mortars.27 In yet another study,28 the 28 d compressive strength of cement pastes increased with the dosage of admixed nMMT but the trend reversed once the nMMT dosage was over 0.6% by mass of cement. The difference of the optimum nMMT is attributable to the difference between foamed paste and ordinary paste.
The beneficial effect of nMMT on the compressive strength of HVFC foamed paste could be attributable to multiple mechanisms. For instance, previous studies28–30 have revealed that nMMT can significantly improve the properties and performance of concrete by acting as nanofiller and as ‘nucleus’ to guide the formation and growth of cement hydration products, participating in the pozzolanic reaction, exfoliating its nanosheets, etc. In addition, the Si–O and Al–O bonds in nMMT might act with cement particles, accelerating the cement hydration and producing more of C–S–H hydrates.27
The adverse effect of admixing too much nMMT on the strength of hardened HVFC foamed paste is likely attributable to the great hydrophilicity and water demand of nMMT, which takes a large portion of the mixing water away from cement and fly ash particles and results in their insufficient hydration. A separate laboratory experiment demonstrated that nMMT expanded significantly as a result of water absorption. This is related to its negatively charged nanosheets that attract the polar water molecules into their interlayer space. The expansion of the lamellar spacing then increases the volume of water-soaked nMMT.29
Microstructure and hydration analyses of foamed paste
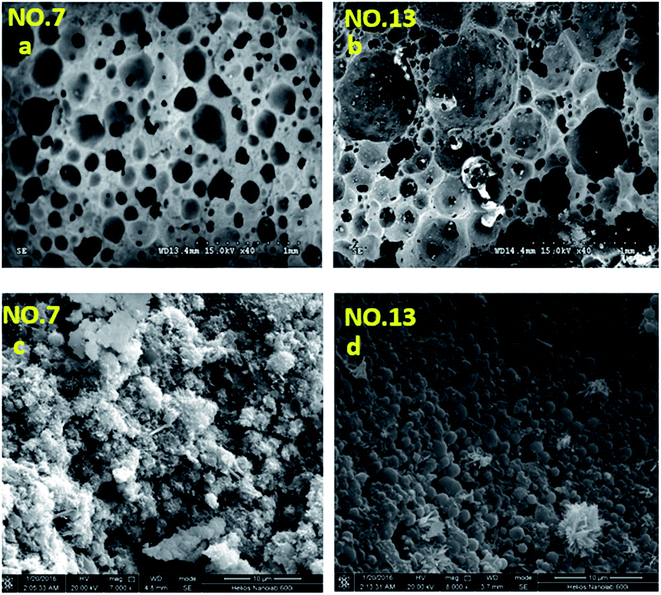
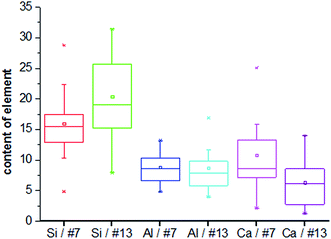
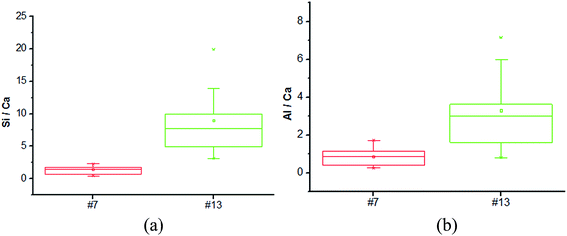
The microstructure of the selected foamed paste samples was examined using SEM and the results are provided in Fig. 7. At the magnifications of 40 times, it can be found the structure in the hardened mix #7 (Fig. 7a) was more homogeneous than that in hardened mix #13 (Fig. 7b), which helps explain its higher 28 d compressive strength. Moreover, at the magnifications of 7000 times, the microstructure of mix #7 (Fig. 7c) featured more crystalline phases than that of mix #13 (Fig. 7d).The elemental composition distribution of the selected foamed paste samples was examined using EDX, by collecting the data from ten non-overlapping sites randomly selected from the SEM of each mix. These EDX data were further investigated in the form of key elemental contents (Fig. 8) and molar ratios of Si/Ca and Al/Ca (Fig. 9), shown as box plots to illustrate the variability of each.31 As can be seen in Fig. 8, mix #7 exhibited significantly higher Ca and lower Si content but similar Al content than mix #13. As such, mix #7 exhibited significantly lower Si/Ca and Al/Ca ratios than mix #13, as shown in Fig. 9. These observed differences in the hydration products are likely due to the fact that mix #7 used a 70% FA + 30% cement binder whereas mix #13 used a 80% FA + 20% cement binder. The FA had a much lower CaO content but higher SiO2 and Al2O3 contents than the cement (Table 1). Fig. 9 also reveals that mix #7 featured less scatter in its Si/Ca and Al/Ca ratios than mix #13, implying more homogenous hydration products.
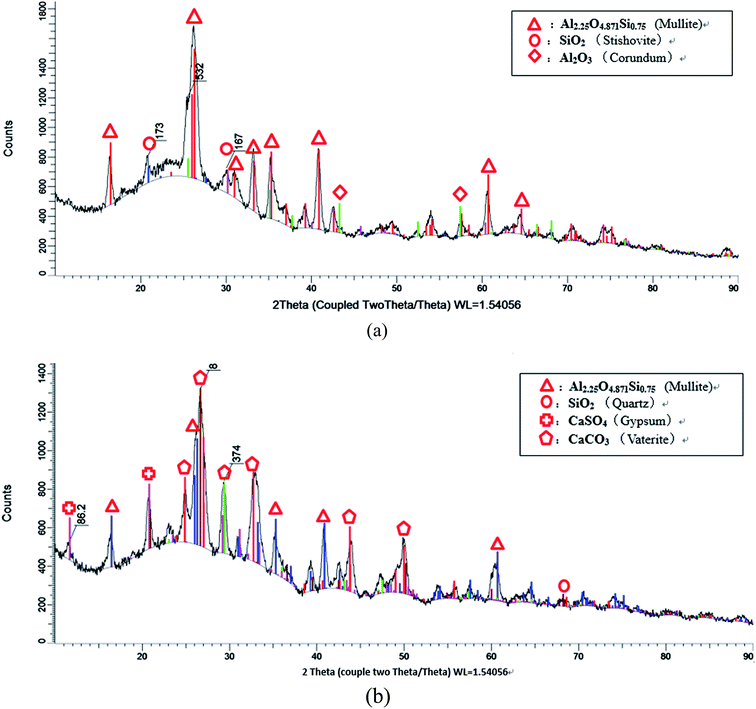
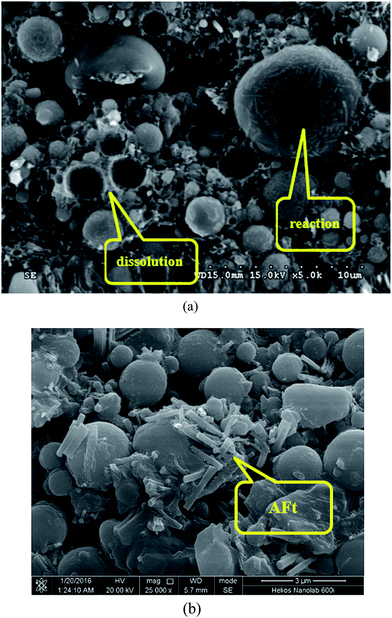
To further investigation the hydration mechanism of HVFC foamed paste, XRD was employed to analyze the crystalline phases in the fly ash and the hardened mix #7 (with 70% FA, 1% AOS, 2% AEO, 0.75% Na3PO4, and 1% nMMT). Both samples were tested in the power form. There are some obvious differences in the phase compositions of these two as well. Fig. 10a reveals that the main crystalline phases in the fly ash include mullite (Al2.25O4.871Si0.75), corundum (Al2O3) and stishovite (SiO2). Fig. 10b reveals that the main crystalline phases in the foamed HVFA paste include mullite, quartz (SiO2), gypsum (CaSO4), and vaterite (CaCO3). The comparison reveals that the corundum and stishovite phases and part of the mullite phase in the fly ash were consumed by their hydration. The hydration of corundum and stishovite phases likely entailed their reaction with cement and water to form C–S–H gel, which provides strength to the hardened HVFA foamed paste. The hydration of mullite entails the reaction of Si and Al elements with alkali to form Si–O and Al–O bonds.32 The mullite peaks (at around 16°, 26°, 35°, 41° and 61°) exhibited a reduced signal in the foamed paste than in the fly ash, which can be attributed to either its consumption by reaction with cement and water or its reduced crystallinity by such reaction (as revealed by SEM observations shown in Fig. 11). The mullite peak at around 26° exhibited a wider peak in the foamed paste than in the fly ash, suggesting reduced grain size due to hydration. Note that crystalline phases in the fly ash are generally less reactive than amorphous phases. The presence of gypsum in the foamed paste can be traced back to the composition of cement. The presence of vaterite in the foamed paste is likely attributable to the reaction of airborne CO2 with one of the cement hydration products, portlandite.
 | ||
| Fig. 11 SEM micrographs of hydrated mix #7: (a) different levels of FA reaction; (b) detection of AFt phase. | ||
Fig. 11a reveals that in the hydrated mix #7 some FA particles were fully consumed by the hydration while others maintained their spherical structure and only reacted on its surface. This highlights the need to explore methods to enhance the hydration of fly ash particles in such HVFA foamed paste. Fig. 11b reveals the presence of rod-like AFt phase in the hydrated mix #7, which is a hydration product of cement,33 but not detected in the XRD results (Fig. 10b).
Conclusions
This laboratory study explores a cost-effective and environmental friendly foamed paste made by using a high volume of class F coal fly ash as replacement of Portland cement (70% by mass) and nano-montmorillonite as an admixture. A statistical design of experiments was adopted and executed to investigate the effects of various factors on the properties of the composite, with water/binder ratio of 0.3. The key findings are as follows.(1) Mix #7 (with 70% FA, 1% AOS, 2% AEO, 0.75% Na3PO4, and 1% nMMT) exhibited the lowest thermal conductivity (0.071 W (m−1 K−1)) yet reasonably high strength (3.23 MPa) at 28 days, representing the best TIMs among the mixtures investigated. Relative to the worst mix (without nMMT), this hardened mix featured a more homogeneous microstructure and more crystalline phases.
(2) The thermal conductivity of the foamed paste decreased linearly with the use of each foaming agent but was not significantly affected by the dosage of FA, Na3PO4, or nMMT in the mix. Their 28 d compressive strength generally benefited from the use of a lower FA replacement level, lower AOS and Na3PO4 d dosages, and a higher nMMT dosage (up to 3%).
(3) The XRD results reveal that the corundum and stishovite phases and part of the mullite phase in the fly ash were consumed by their hydration. There is the need to explore methods to enhance the hydration of fly ash particles in such HVFA foamed paste.
Acknowledgements
This work was supported by National Natural Science Foundation of China (Grant No. 51278390), Hubei Department of Education (ChuTian Scholar Visiting Professorship awarded to Wuhan Polytechnic University), and Hubei Provincial Department of Construction (Construction Science and Technology Plan Project EJB-2016-347-1-13).References
- K. S. Al-Jabri, A. W. Hago, A. S. Al-Nuaimi and A. H. Al-Saidy, Cem. Concr. Res., 2005, 35, 1472 CrossRef CAS.
- P. Barnes, and J. Bensted, Structure and performance of cements, CRC Press, 2000 Search PubMed.
- H. Binici and O. Aksogan, J. Mater. Cycles Waste Manage., 2015, 17, 157 CrossRef CAS.
- T. P. Chang, J. Y. Shih, K. M. Yang and T. C. Hsiao, J. Mater. Sci., 2007, 42, 7478 CrossRef CAS.
- I. D. L. Varga, R. P. Spragg, C. D. Bella, J. Castro, D. P. Bentz and J. Weiss, Cem. Concr. Compos., 2014, 45, 102 CrossRef.
- P. Dinakar, K. G. Babu and M. Santhanam, Cem. Concr. Compos., 2008, 30, 880 CrossRef CAS.
- A. Zhang, Z. Li and L. Liu, Mixture Proportion Designing of Foam Concrete with Addition of Fly Ash and Calcium Carbide Sludge, in Proceedings of the 2012 Second International Conference on Electric Technology and Civil Engineering, IEEE Computer Society, May 2012, pp. 1722–1725 Search PubMed.
- N. Farzadnia, A. A. A. Ali, R. Demirboga and M. P. Anwar, Cem. Concr. Res., 2013, 48, 97 CrossRef CAS.
- B. Harwalkar and S. S. Awanti, J. Transp. Res. Board, 2014, 2441, 121 CrossRef.
- X. He and X. Shi, J. Transp. Res. Board, 2008, 2070, 13 CrossRef CAS.
- F. Hiromi and T. Wee, J. Wuhan Univ. Technol., Mater. Sci. Ed., 2007, 22, 295 CrossRef.
- N. M. Ibrahim, S. Salehuddin, R. C. Amat, L. N. Rahim and N. T. T. Izhar, APCBEE Proc., 2013, 5, 497 CrossRef CAS.
- E. P. Kearsley and P. J. Wainwright, Cem. Concr. Res., 2001, 31, 105 CrossRef CAS.
- E. P. Kearsley and P. J. Wainwright, Cem. Concr. Res., 2002, 32, 233 CrossRef CAS.
- W. Y. Kuo, J. S. Huang and C. H. Lin, Cem. Concr. Res., 2006, 36, 886–895 CrossRef CAS.
- S. K. Lim, C. S. Tan, O. Y. Lim and Y. L. Lee, Construct. Build. Mater., 2013, 46, 39 CrossRef.
- G. Masi, W. D. Rickard, L. Vickers, M. C. Bignozzi and A. V. Riessen, Ceram. Int., 2014, 40, 13891 CrossRef CAS.
- P. K. Mehta, High-performance, high-volume fly ash concrete for sustainable development, in Proceedings of the international workshop on sustainable development and concrete technology, Iowa State University, Ames, IA, USA, May 2004, pp. 3–14 Search PubMed.
- M. A. O. Mydin and Y. C. Wang, Construct. Build. Mater., 2012, 26, 638 CrossRef.
- T. R. Naik, S. S Singh and M. M Hossain, Cem. Concr. Res., 1994, 24, 913 CrossRef CAS.
- N. Yang, J. Chin. Ceram. Soc., 1996, 4, 209 Search PubMed.
- A. Palomo, M. W. Grutzeck and M. T. Blanco, Cem. Concr. Res., 1999, 29(8), 1323–1329 CrossRef CAS.
- C. E. Roskos, Building green: development and evaluation of an environmentally friendly concrete, Doctoral dissertation, Montana State University, College of Engineering, Bozeman, 2011.
- G. Sang, Y. Zhu, G. Yang and H. Zhang, Construct. Build. Mater., 2015, 91, 133 CrossRef.
- M. Schneider, M. Romer, M. Tschudin and H. Bolio, Cem. Concr. Res., 2011, 41, 642 CrossRef CAS.
- X. Shi, L. Fay, M. M. Peterson, M. Berry and M. Mooney, Construct. Build. Mater., 2011, 25, 957 CrossRef.
- X. Shi, Z. Yang, Y. Liu and D. Cross, Construct. Build. Mater., 2011, 25, 3245 CrossRef.
- A. A. Stec and T. R. Hull, Energ. Build., 2011, 43, 498 CrossRef.
- P. Torkittikul, T. Nochaiya, W. Wongkeo and A. Chaipanich, J. Mater. Cycles Waste Manage., 2015, 34, 1 Search PubMed.
- P. V. D. Heede, E. Gruyaert and N. D. Belie, Cem. Concr. Compos., 2010, 32, 749 CrossRef.
- Z. T. Yao, X. S. Ji, P. K. Sarker, J. H. Tang, L. Q. Ge, M. S. Xia and Y. Q. Xi, Earth-Sci. Rev., 2015, 141, 105 CrossRef.
- M. Şahmaran, İ. Ö. Yaman and M. Tokyay, Cem. Concr. Compos., 2009, 31, 99 CrossRef.
- S. Zhang, X. Hu, X. Wang, S. Liang and L. Wu, Chin. J. Catal., 2002, 33, 1736 Search PubMed.
| This journal is © The Royal Society of Chemistry 2017 |

