 Open Access Article
Creative Commons Attribution 3.0 Unported Licence
Polyaniline-deposited cellulose fiber composite prepared via in situ polymerization: enhancing adsorption properties for removal of meloxicam from aqueous media
Flávia Viana Avelar Dutra,
Bruna Carneiro Pires,
Tienne Aparecida Nascimento,
Valdir Mano and
Keyller Bastos Borges *
*
Departamento de Ciências Naturais, Universidade Federal de São João del-Rei, Campus Dom Bosco, Praça Dom Helvécio 74, Fábricas, São João del-Rei, Minas Gerais 36301-160, Brazil. E-mail: keyller@ufsj.edu.br
First published on 22nd February 2017
Abstract
Polyaniline (PAni), cellulose fiber (CF) and a PAni–CF composite, which were characterized by infrared spectroscopy, scanning electron microscopy and thermogravimetry, were investigated in adsorption studies of meloxicam (MLX) from aqueous media. PAni-deposited CF composites were prepared via in situ polymerization. These materials were assessed with varying pH, contact time between the adsorbent and adsorbate, and concentration. Kinetic data were evaluated by pseudo first- and second-order, Elovich and intraparticle diffusion models, and the concentration data were evaluated by Langmuir, Freundlich, Sips, single-site Langmuir–Freundlich and dual-site Langmuir–Freundlich models. MLX adsorption was better at pH 2, and the pseudo-second-order (R2 ≥ 0.999) kinetic model and the Langmuir–Freundlich (R2 ≥ 0.9901) isotherm model showed the best fit. PAni–CF composite was found to be the best adsorbent material compared to PAni and CF, because of the greater adsorption capacity (Q = 169.5 mg g−1), which can be explained by the combination of the adsorptive properties of the two materials.
1. Introduction
The search for adsorbent materials with a large surface area, porosity, good adsorbent–adsorbate affinity, good sensitivity and low cost has been increasing more and more towards the adsorption of non-specific analytes (organics and inorganics) and has generated new research, innovation and development of these materials for use in sample preparation techniques using a solid phase for adsorption. Conducting Polymers (CP) are a class of materials that has shown interesting adsorption results owing to their chemical and physical properties that enable them in various applications, such as in electrodes, sensors, rechargeable batteries and more recently as adsorbent materials.1Polyaniline (PAni) presents redox behavior, but its multi-functionality, ease of synthesis, stability, porosity and high surface area have attracted attention in the field of sample preparation, for example in solid phase extraction2 and its miniaturizations as solid phase microextraction and microextraction by packed sorbent.3,4 The analyte sorption occurs owing to their multifunctional properties, including hydrophobicity, acid–base character, π–π interactions, polar functional groups, ion exchange properties, hydrogen bonding and electroactivity.5
PAni is among the most studied CP and to improve its adsorptive ability or other properties it has been used in (nano)composites mixed with carbon nanotubes,5 cellulose,6 natural cellulosic fibers,7 iron oxide,8,9 paper,10 starch,11 silica,12 graphene,13 paper doped with three inorganic acids14 and 2-hydroxyethylcellulose.15 In this context, cellulose fiber (CF), which is a polymeric material with uniform and high porosity, and excellent adsorptive capacity, is a good alternative adsorptive material since it has been used in cigarettes as an efficient adsorbent of toxic compounds (for example, volatile organic compounds, benzene, carcinogenic toxins and others). Recently, CF has been successfully used as an adsorbent for pre-concentration of environmental pollutants, such as polycyclic aromatic hydrocarbons,16 arsenic complexes, mercury, lead, and pesticides in environmental samples,17 among others.18
Meloxicam (MLX) is an anti-inflammatory non-steroidal drug developed for the treatment of rheumatic disease and is indicated for the treatment of the symptoms of rheumatoid arthritis and osteoarthritis (joint disease), alleviating pain and inflammation. MLX preferably acts by inhibiting the function of COX-2, and therefore produces inflammatory mediators in the early stages of the acute anti-inflammatory response and late-stage mediators.19,20 Actually, it is desirable to monitor and to develop analytical methodologies to detect and control the presence of pharmaceuticals in very different kinds of samples, for example waste water, urine, serum or plasma, most of which are very complex matrices.21,22 Thus the development of new adsorbent materials to employ in techniques of sample extraction is highly desired.
Hence, the objectives of this work were to: (i) prepare and characterize three adsorbent materials, namely PAni, CF and PAni–CF composite, (ii) evaluate the potential of these materials for the adsorption of MLX from aqueous media, (iii) assess the experimental variables affecting the optimal adsorption of MLX, (iv) explore adsorption isotherms and kinetic models to identify the possible mechanism of MLX adsorption and (v) perform desorption studies and evaluate the regeneration of materials. This is the first work in which PAni, CF and a PAni–CF composite have been prepared/synthetized and used as adsorbents with enhanced capacity for removal of MLX from aqueous media.
2. Materials and methods
2.1. Standards, reagents and solvents
MLX standard (99.7%) was obtained from the United States Pharmacopeia Reference Standard. Reagents and solvents used in syntheses and the analysis were: aniline (99.5%) and cellulose fiber (medium) from Sigma-Aldrich® (St. Louis, MO, USA); hydrochloric acid from Vetec® (Rio de Janeiro, RJ, Brazil); and ammonium persulfate (98.0%), sodium hydroxide and anhydrous sodium phosphate bibasic from Synth® (Diadema, SP, Brazil). Monobasic anhydrous sodium phosphate (98.0%) from Neon® (São Paulo, SP, Brazil), acetonitrile and methanol from J. T. Baker® (Mexico City, Mexico) and purified water from a Millipore Milli-Q Plus system (Bedford, MA, USA) were employed in the HPLC analysis.2.2. Standard solutions
The MLX solutions were prepared in methanol (stock solution) at concentrations of 0.5 mg mL−1 for the pH and time test, and 3.0 mg mL−1 for the concentration test, and diluted with aqueous solution with the pH adjusted to a concentration of 0.1 mg mL−1 and subsequently filtered using Millipore filter Millex-GV® hydrophilic PVDF 0.22 μm.2.3. Apparatus
Adsorption tests of MLX in aqueous medium were carried out using a high performance liquid chromatograph coupled with a diode array detector (HPLC-DAD) of Agilent® (Agilent Technologies, Palo Alto, CA, USA) consisting of a quaternary pump (model 1290; G4204A), a thermostat (model 1290; G1330B), an auto sampler (model 1290; G4226A), a column oven (model 1290 TCC; G1316C) and a diode array detector (DAD; model 1260 VL+; G1315C). Agilent Open LAB Chromatography Data Software System® controlled the instrument. All data were obtained using a Phenomenex® Gemini C18 column (150 × 4.6 mm, 5 μm), a mobile phase consisting of 0.05 mol L−1 phosphate buffer pH 6 and acetonitrile (65![[thin space (1/6-em)]](https://www.rsc.org/images/entities/char_2009.gif) :
:![[thin space (1/6-em)]](https://www.rsc.org/images/entities/char_2009.gif) 35, v/v) at a flow rate of 1.2 mL min−1 at a wavelength of 355 nm at 25 °C with an injection volume of 20 μL.
35, v/v) at a flow rate of 1.2 mL min−1 at a wavelength of 355 nm at 25 °C with an injection volume of 20 μL.
2.4. Syntheses/preparation of adsorbent materials
![[thin space (1/6-em)]](https://www.rsc.org/images/entities/char_2009.gif) :
:![[thin space (1/6-em)]](https://www.rsc.org/images/entities/char_2009.gif) 1) was added and allowed to stir for 30 min. Subsequently, 120 mL of ammonium persulfate acid solution was dropped in the above solution, which was placed for a further 5 h under stirring and cooling in an ice bath. The greenish black precipitate was vacuum filtered and washed with Milli-Q water, hydrochloric acid (1 mol L−1) and methanol, thoroughly, and then placed in an oven at 60 °C for 24 h for drying.
1) was added and allowed to stir for 30 min. Subsequently, 120 mL of ammonium persulfate acid solution was dropped in the above solution, which was placed for a further 5 h under stirring and cooling in an ice bath. The greenish black precipitate was vacuum filtered and washed with Milli-Q water, hydrochloric acid (1 mol L−1) and methanol, thoroughly, and then placed in an oven at 60 °C for 24 h for drying.2.5. Characterization of materials
The three materials were characterized using three different techniques: (i) SEM imaging was carried out using a Hitachi Analytical Microscope TM3000 Table Top with an acceleration voltage of 15 kV; (ii) FTIR analyses were performed on a FTIR Spectrum GX from PerkinElmer, operating between 4000 and 400 cm−1 with a resolution of 4 cm−1, using the KBr tablet method; (iii) TG analyses were conducted using a Shimadzu DTG-60H thermo balance with a heating rate of 10 °C min−1 between 25 and 1000 °C under nitrogen flow (50 mL min−1).2.6. Adsorption studies
In order to evaluate the adsorption capacity of the PAni, CF and the PAni–CF composite, 17.5 mg of each material was placed in a test tube followed by MLX aqueous solution. The studies were conducted to verify the influence of pH and the kinetics were evaluated using different kinetic models. After these two parameters were optimized, the adsorption isotherms were obtained and the parameters of different models were evaluated.
 | (1) |
The experimental kinetic data were further fitted to common adsorption kinetic models, including pseudo-first-order, pseudo-second-order, Elovich, and intraparticle diffusion.23,24
2.7. Desorption studies
Desorption studies of MLX employing PAni, CF and PAni–CF were carried out using 5 mL of 0.5 mol L−1 solutions of sulfuric acid, hydrochloric acid and nitric acid separately in 15 mL flasks, stirring at 2000 rpm for the best adsorption time for each material (PAni: 6 min; CF: 2 min; PAni–CF: 4 min) at room temperature (25 ± 3 °C). Afterwards, all the flasks were sonicated for 10 min. This procedure was performed 3 times to ensure satisfactory and reproducible results. The MLX desorption percentage was calculated using eqn (2), wherein qdes is the amount desorbed and qads is the amount adsorbed.
 | (2) |
3. Results and discussion
3.1. Characterization of the adsorbents materials
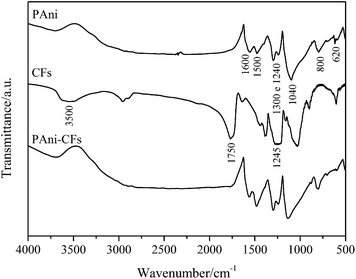
The characterization of PAni, CF and the PAni–CF composite was carried out by FTIR (Fig. 1) to identify the major vibrational bands of the functional groups present in the materials. Analyzing the spectrum of PAni in Fig. 1, it can be seen that at approximately 1600 cm−1 there is a reference band to a stretching vibration by coupling of the C![[double bond, length as m-dash]](https://www.rsc.org/images/entities/char_e001.gif) N and C
N and C![[double bond, length as m-dash]](https://www.rsc.org/images/entities/char_e001.gif) C quinoid ring; the band at 1500 cm−1 is attributed to the C
C quinoid ring; the band at 1500 cm−1 is attributed to the C![[double bond, length as m-dash]](https://www.rsc.org/images/entities/char_e001.gif) C bond of the benzene ring; the bands at 1300 and 1240 cm−1 are attributed to the stretching of the C–N+ protonated amine and the C–N aromatic amine; 1040 and 800 cm−1 bands are associated with the C–H bending in the plane and out of plane, respectively, in aromatic structures; finally, the band located at 620 cm−1 is due to deformation out of the plane of the C–C bonds in the monosubstituted ring.27,28 According to Laska and Widlarz (2005), the monosubstituted rings are always at the chain termination and they are clearly visible in the FTIR spectra of short chain PAni (up to five units oligomers), but with increasing chain length the intensity decreases until its disappearance from the polymer spectrum.27 Analyzing the CF spectrum, the band at approximately 3500 cm−1 can be assigned to O–H stretching, 1750 cm−1 to C
C bond of the benzene ring; the bands at 1300 and 1240 cm−1 are attributed to the stretching of the C–N+ protonated amine and the C–N aromatic amine; 1040 and 800 cm−1 bands are associated with the C–H bending in the plane and out of plane, respectively, in aromatic structures; finally, the band located at 620 cm−1 is due to deformation out of the plane of the C–C bonds in the monosubstituted ring.27,28 According to Laska and Widlarz (2005), the monosubstituted rings are always at the chain termination and they are clearly visible in the FTIR spectra of short chain PAni (up to five units oligomers), but with increasing chain length the intensity decreases until its disappearance from the polymer spectrum.27 Analyzing the CF spectrum, the band at approximately 3500 cm−1 can be assigned to O–H stretching, 1750 cm−1 to C![[double bond, length as m-dash]](https://www.rsc.org/images/entities/char_e001.gif) O stretching and 1245 cm−1 to C–O stretching; all of these bands are characteristic of CF for being an ester with hydroxyl groups from the cellulose.21 With the characterization of the main bands of PAni and CF, we verify that the PAni–CF composite spectrum is the sum of the PAni and CF spectra, differing only in intensity and with a small displacement of some bands owing to interference of the bands related to the separated material.
O stretching and 1245 cm−1 to C–O stretching; all of these bands are characteristic of CF for being an ester with hydroxyl groups from the cellulose.21 With the characterization of the main bands of PAni and CF, we verify that the PAni–CF composite spectrum is the sum of the PAni and CF spectra, differing only in intensity and with a small displacement of some bands owing to interference of the bands related to the separated material.
From the SEM characterization (Fig. 2), one can see that the PAni (Fig. 2a and b) apparently shows a particulate material without a defined shape with some agglomerates. In Fig. 2c and d, images of the CF clearly show that it has a fibrous shape with homogeneous surfaces at the highest possible zoom level for this equipment. The SEM images of the PAni–CF composite are shown in Fig. 2e and f, and they show that, apparently, the material is heterogeneous, having fiber pertaining to the CF as solid particulate agglomerates and, moreover, PAni apparently aggregated in the surface of the CF.
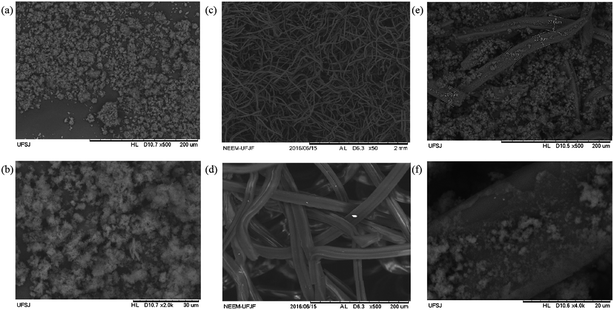 | ||
| Fig. 2 SEM images of: PAni with magnifications of (a) 500× and (b) 2000×; CF with magnification of (c) 50× and (d) 500×; and PAni–CF composite with (e) 500× and (f) 4000×. | ||
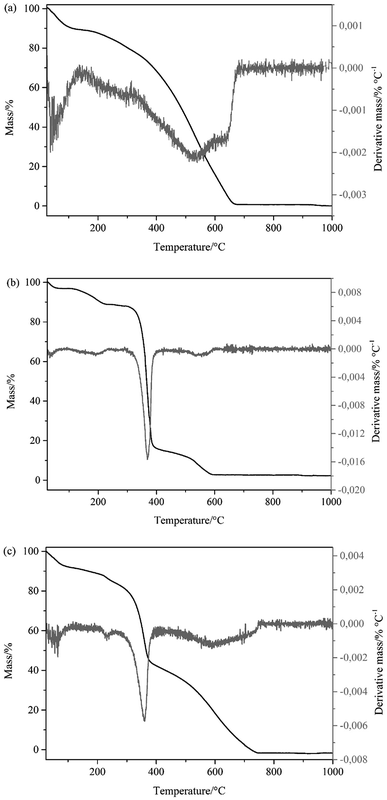
Finally, TG and DTG curves of three materials are shown in Fig. 3 in the temperature range from 25 to 1000 °C. This analysis was performed with the objective of characterizing and evaluating the stability of the materials as a function of temperature. Fig. 3a shows three mass loss events for PAni, corresponding to evaporation of water, the decomposition of low molar mass fragments and the decomposition of the polymer chain, and at 550 °C is the maximum rate of loss of mass.29,30 In Fig. 3b the TG curve of CF has two mass loss events, characterized by the evaporation of volatile compounds and by carbonization of CF. The temperature at which the mass loss rate is highest is 365 °C. The TG curve of the PAni–CF composite (Fig. 3c) is the sum of the two previous thermograms, confirming that the composite has both PAni and CF, characterized by the mass loss of each one separately.
3.2. Chromatographic optimization for MLX
An analytical method employing HPLC-DAD was used to quantify the MLX in aqueous medium. It used a Phenomenex® Gemini C18 column (150 × 4.6 mm, 5 μm) and a mobile phase consisting of 0.05 mol L−1 phosphate buffer at pH 6 and acetonitrile at a ratio of 65![[thin space (1/6-em)]](https://www.rsc.org/images/entities/char_2009.gif) :
:![[thin space (1/6-em)]](https://www.rsc.org/images/entities/char_2009.gif) 35 (v/v), flow rate 1.2 mL min−1 at 25 °C and a wavelength of 355 nm (maximum absorption in the UV-Vis). Under these conditions, the retention time was 3 min and the chromatographic parameters agree with the values recommended in the literature (number of theoretical plates = 8428; asymmetry = 1.052).
35 (v/v), flow rate 1.2 mL min−1 at 25 °C and a wavelength of 355 nm (maximum absorption in the UV-Vis). Under these conditions, the retention time was 3 min and the chromatographic parameters agree with the values recommended in the literature (number of theoretical plates = 8428; asymmetry = 1.052).
3.3. Effect of pH
The first study was to evaluate the influence of the pH in the adsorption of MLX aqueous solution onto three materials, and the pH range studied was from 2 to 10 (the pH was adjusted using NaOH and HCl solutions, both with a concentration of 0.01 mol L−1). As can be seen from Fig. 4, the pH that gave the best adsorption results for all three materials was pH 2. At other pHs, PAni and the PAni–CF composite did not exhibit very different results. They presented MLX adsorption of over 72%. In contrast, CF was totally pH dependent, i.e. the MLX adsorption decreased with increasing pH. The MLX adsorption reached 28% at pH 10. Thus, PAni led to higher adsorption percentages of MLX at all pHs studied than that for the PAni–CF composite and CF, these results being assigned to different interactions between the binding site of the materials to the MLX molecule. According to the MLX properties, provided by Chemicalize.org by ChemAxon, it can be said that at pH < 1 there is only one protonated imine group and, therefore, the molecule's charge becomes positive. At pH between 2 and 3, the MLX is in molecular form, which increases the adsorption capacity of the material at the working pH of approximately 2. Between pH 6 and 9.2 molecule has a deprotonated hydroxyl group, which is negatively-charged. Above pH 12, the MLX has two negatively charged functional groups, amine and hydroxyl.31 Therefore, according to the percentage of absorption of MLX by the three materials, the pH was chosen as 2, and the adsorption occurs owing to the presence of aromatic rings and amino groups on the PAni and ether, ester and hydroxyl groups on the CF, sites capable of interacting with the analyte in different ways, involving the intermolecular forces of dipole–dipole, hydrogen bonding and π–π interactions.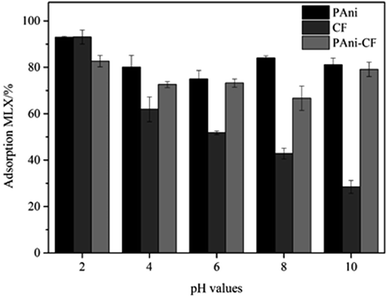 | ||
| Fig. 4 Effect of pH on MLX adsorption of PAni, CF and PAni–CF composite. Experiments were performed at room temperature by vortex mixing at 2000 rpm with 17.5 mg of each material for 2 min. | ||
3.4. Effect of time and adsorption kinetics
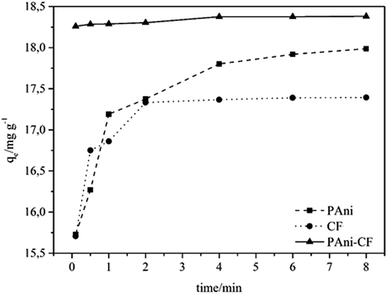
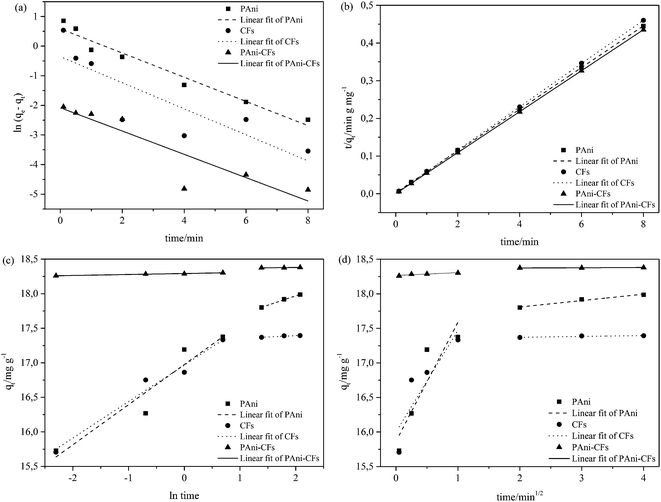
The adsorption mechanism is an essential and valuable tool for understanding the kinetic process, which is evaluated based on the effect of contact time between the sorbent material and the MLX. Fig. 5 presents the adsorbed amount of MLX (q, calculated by eqn (1)) for each adsorbent material versus the contact time between them. Note that the adsorption of MLX onto PAni reaches equilibrium at 6 min, onto CF at 2 min and onto PAni–CF composite at 4 min. Note also that the adsorption of PAni-CF in the first minutes is smooth, indicating that the materials have relatively low resistance to mass transfer, and after this time the values of the quantities adsorbed not change significantly, thus suggesting a rapid adsorption and reaching the kinetic equilibrium. These experimental data were applied to four kinetic models, pseudo-first-order, pseudo-second-order, Elovich and intraparticle diffusion, and the respective parameters are analyzed and shown in Table 1, whereas Fig. 6 depicts the linearized forms of each kinetic model.| Pseudo-first-order | Pseudo-second-order | |||||||
|---|---|---|---|---|---|---|---|---|
| ln(qe − qt) = ln(qe) − K1t | ||||||||
| Ads. | K1 (min−1) | qcalc (mg g−1) | qe (mg g−1) | R2 | K2 (g mg−1 min−1) | qcalc (mg g−1) | qe (mg g−1) | R2 |
| a qe and qt: amount of MLX absorbed at equilibrium and for each time analyzed, respectively; K1: rate constant of pseudo-first order adsorption process; K2: rate constant of pseudo-second-order adsorption process; β: is related to the extent of surface coverage and activation energy for chemisorption; α: initial sorption rate constant; Kid: internal diffusion coefficient; C: constant related to the thickness of the boundary layer. | ||||||||
| PAni | 0.409 | 1.790 | 18.070 | 0.962 | 1.114 | 18.070 | 17.800 | 0.999 |
| CF | 0.440 | 1.430 | 17.420 | 0.740 | 3.140 | 17.420 | 17.330 | 0.999 |
| PAni–CF | 0.394 | 8.020 | 18.390 | 0.833 | 13.442 | 18.390 | 18.380 | 1.000 |
| Elovich | Intraparticle diffusion | |||||
|---|---|---|---|---|---|---|
| qt = Kt1/2 + C | ||||||
| Ads. | α (mg g−1 min−1) | β (g mg−1) | R2 | Kid (mg g−1 min−1/2) | C (mg g−1) | R2 |
| PAni | 0.581 | 16.957 | 0.919 | 1.725 | 15.865 | 0.828 |
| 0.269 | 17.430 | 0.997 | 0.093 | 17.624 | 0.997 | |
| CF | 0.528 | 16.966 | 0.975 | 1.472 | 16.001 | 0.775 |
| 0.039 | 17.316 | 0.912 | 0.013 | 17.344 | 0.849 | |
| PAni–CF | 0.014 | 18.292 | 0.974 | 0.041 | 18.265 | 0.858 |
| 0.008 | 18.363 | 0.777 | 0.003 | 18.368 | 0.853 | |
The pseudo-first-order model, also known as the Largergren model, establishes that the number of sites occupied by adsorption is proportional to the unoccupied sites, describing that the adsorbate binds only to a single active site on the surface of the adsorbent material and interactions are of a physical nature. In this model, the value of qe was estimated based on the pseudo second-order model and the values of qcalc and K1 were obtained from the y-intercept and slope, respectively, of the plot of ln(qe − qt) versus t (Fig. 6a).24,32–34
The pseudo-second-order model assumes that the adsorption refers to the square of the difference between the number of adsorption sites available and the number of occupied sites, and the analyte can bind to two active sites with different binding energies. This model also assumes that the adsorption process is chemical. The value of qe corresponds to the equilibrium amount adsorbed and qcalc and K2 are obtained from the inverse values of y-intercept and slope, respectively, of the plot of t/qt versus t presented in Fig. 6b.24,32–34
The Elovich model is similar to the pseudo-second-order model, since it also assumes that the surface of the adsorbent is heterogeneous and considers adsorption of the chemisorption type. Thereby, to increase the number of sites for adsorption suggests that the adsorption occurs in a multilayered way. From the slope and y-intercept values, obtained from the graph qt vs. ln![[thin space (1/6-em)]](https://www.rsc.org/images/entities/char_2009.gif) t in Fig. 6c, we can obtain the values of α and β, respectively.34,35
t in Fig. 6c, we can obtain the values of α and β, respectively.34,35
The last kinetic model applied was the intraparticle diffusion or Morris–Weber model and it was created to mathematically describe that the adsorption kinetics process is influenced by the diffusion phenomenon of molecules in the adsorbent. This model has also been used to study how the mass transfer of the analyte to the adsorbent occurs. Kid and C values are found from the slope and y-intercept, respectively, of the straight line equation obtained by Fig. 6d in the graph of qt vs. t1/2.24,32,34
The choice of kinetic model to explain the mechanism of adsorption depends on the analysis parameters presented in Table 1, and the most viable models are selected based on determination coefficients (R2), as well as the similarity of the values of the quantities adsorbed experimentally (qe) to the values predicted by the model (qcalc). Therefore, analyzing the parameters, the pseudo-second-order model showed the best fit with R2 ≥ 0.999 for three materials, and the q values and qcalc are very close: for PAni, 17.800 and 18.070; for CF, 17.330 and 17.420; and for the PAni–CF composite, 18.380 and 18.290 mg g−1, respectively. Therefore, as it better fits the pseudo-second-order model, the mechanism probably involves the adsorption of the materials studied in MLX binding sites with different energies and this process has a chemical nature. This model also recognizes that the speed of adsorption is dependent on the amount of solute adsorbed on the surface of the adsorbent and the occupancy rate of adsorption sites is proportional to the square of the number of unfilled places.35
The Elovich model also describes, similar to the pseudo-second-order model, that the adsorption occurs in the heterogeneous energy sites of the adsorbent, assuming multilayer adsorption by chemisorption. However, this model can be visualized to involve two steps in the adsorption process: (i) the first one is related to the adsorption of the molecule on the external sites of the adsorbent material; (ii) the second is assigned to a slower adsorption process known as diffusion of molecules in and out of the pores of the adsorbent.36 As shown in Table 1 and Fig. 6c, this model also has a reasonable fit for the two segments, representing the two steps in the adsorption process, owing to the determination coefficients for the three materials (PAni: R2 = 0.919 and 0.997; CF: R2 = 0.975 and 0.912, and PAni–CF: R2 = 0.974 and 0.777), confirming that the adsorption of MLX on the three materials involves two chemisorption phases, i.e. there are external adsorption surfaces inside and outside the pores. Therefore, when the adsorption is also influenced by the diffusion adsorption phenomenon, the intraparticle diffusion model is a complement to Elovich model, once the parameter related to the thickness of the boundary layer (C, mg g−1), and the higher the value C greater is the effect of boundary layer.
The intraparticle diffusion model is widely used to verify the influence of mass transfer resistance in the adsorbent–adsorbate connection, and when it is treated with multilinear segments it is assumed that the adsorption takes place stepwise, with the first linear portion related to the diffusion process being limited by the external boundary layer (faster phase adsorption); the second line segment is attributed to the diffusion process inside the pores, which involves a slow process, and in the third linear portion it is considered that equilibrium was reached.23,37 However, in Fig. 6d, it is clear that there are two linear portions, and the adsorption increased rapidly in the first phase, indicating the effect of the boundary layer, and then decreased until the balance owing to the slow diffusion of MLX in the less accessible adsorption sites.38 From the data presented in Table 1 it is clear that the C values (boundary layer) are very different from zero (values between 15.865 and 18.368 mg g−1), suggesting that the adsorption of MLX on the surface of the adsorbent material occurs through diffusion. In addition, the value of Kid, the diffusion constant parameter given by this intraparticle diffusion model, is highest in the first linear segments compared with the second segments of the three materials (PAni: 1.725 > 0.093; CF: 1472 > 0.013, and PAni–CF: 0.041 > 0.003 mg g−1 min−1/2), suggesting that there is a lower mass transfer resistance in the first adsorption stage, thus confirming the rapid adsorption.39
In addition, in all these kinetic models studied, it was observed from the data and in Fig. 6, the PAni–CF composite adsorbed larger amount of MLX (18.380 mg g−1), followed by PAni and CF (17![[thin space (1/6-em)]](https://www.rsc.org/images/entities/char_2009.gif) 800 and 17
800 and 17![[thin space (1/6-em)]](https://www.rsc.org/images/entities/char_2009.gif) 330 mg g−1, both balancing data) in this order. This fact can be attributed to the composite texture and composition, which is formed by mixing two highly porous materials with good adsorption capabilities.
330 mg g−1, both balancing data) in this order. This fact can be attributed to the composite texture and composition, which is formed by mixing two highly porous materials with good adsorption capabilities.
3.5. Concentration and adsorption isotherms
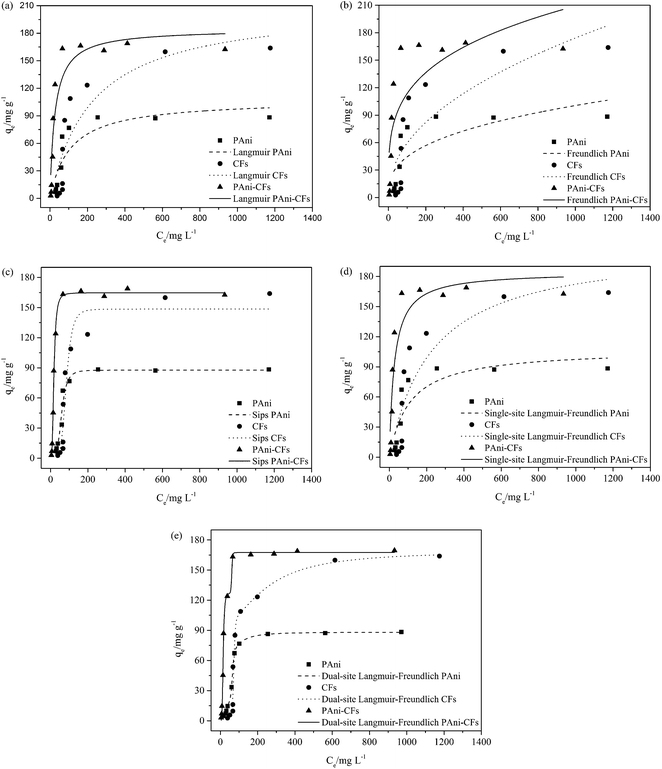
The adsorption isotherms evaluate the adsorption capacity of the material by means of the isotherm curve, which at equilibrium is characterized by the adsorbed amount (q) versus the equilibrium concentration (Ce).40 In this study, we evaluated five models of adsorption isotherms (Langmuir, Freundlich, Sips, single- and dual-site Langmuir–Freundlich) to obtain the maximum adsorption capacity of MLX onto PAni, CF and the PAni–CF composite, and therefore information explaining the adsorption mechanism, such as binding sites and affinity between the adsorbent and adsorbate. The MLX adsorption isotherms for the three adsorbent materials are shown in Fig. 7 and parameters obtained by the processing of experimental data, as well as the equations for each model, are shown in Table 2.| Model | Equation | Parameter | PAni | CF | PAni–CF |
|---|---|---|---|---|---|
| a qe: MLX amount adsorbed at equilibrium (mg g−1); Q: maximum MLX adsorption capacity of the adsorbent material (mg g−1); K: equilibrium constant that describes the affinity between MLX and the adsorbents; KL: Langmuir equilibrium constant (L g−1); KF: Freundlich equilibrium constant (mg g−1) (L g−1); n: constant related to the strength of adsorption. | |||||
| Langmuir |  |
KL | 0.0093 | 0.0044 | 0.0374 |
| Q | 107.8369 | 211.4331 | 184.6017 | ||
| R2 | 0.7459 | 0.7597 | 0.8813 | ||
| Freundlich |  |
KF | 8.6755 | 6.8860 | 33.4465 |
| n | 2.8197 | 2.1378 | 3.7682 | ||
| R2 | 0.5632 | 0.6525 | 0.6370 | ||
| Sips |  |
Q | 87.7322 | 148.5010 | 164.6683 |
| KS | 2.0635 × 10⁻⁸ | 3.0258 × 10⁻¹¹ | 1.3005 × 10⁻⁴ | ||
| n | 4.3394 | 5.4635 | 3.1057 | ||
| R2 | 0.9578 | 0.8980 | 0.9942 | ||
| Langmuir–Freundlich single-site |  |
Q | 23.6214 | 34.3997 | 60.1350 |
| K | 0.0426 | 0.0271 | 0.1149 | ||
| n | 0.2190 | 0.1627 | 0.3257 | ||
| R2 | 0.7095 | 0.7252 | 0.8664 | ||
| Langmuir–Freundlich dual-site |  |
Q1 | 40.2217 | 90.6660 | 127.3530 |
| K1 | 0.0154 | 0.0138 | 0.0664 | ||
| n1 | 16.0083 | 18.2748 | 4.5279 | ||
| Q2 | 47.9553 | 70.1663 | 42.1761 | ||
| K2 | 0.0169 | 0.0042 | 0.01638 | ||
| n2 | 2.1488 | 1.8614 | 25.8271 | ||
| R2 | 0.9901 | 0.9317 | 0.9941 | ||
The Langmuir model assumes that each binding site is energetically homogeneous, i.e., the interaction between the adsorbent and adsorbate occurs in a uniform distribution on the surface of the adsorbent. In other words, the adsorption mechanism is monolayer, and the number of adsorption sites is finite, i.e., adsorption saturation occurs.41–43 The Freundlich model takes into account the interaction between the adsorbent and adsorbate occurring in heterogeneous sites and the adsorption mechanism is multilayer, but it is an empirical model and there is a restriction since there is no provision for the saturation of the adsorption sites.41,44 According to the data in Table 2, it can be seen that the determination coefficients (R2) of these two models for the three materials are not as high when compared with, for example, the dual-site Langmuir–Freundlich model; the highest R2 of 0.8813 for the Langmuir model was found for the PAni–CF composite and 0.6525 for CF under the Freundlich model. Thus, it was concluded that these two models do not explain adequately part of the MLX adsorption mechanism for the three materials.
The Sips model is a combination of the Langmuir and Freundlich models, and states that the surface of the adsorbent can be homogeneous or heterogeneous. At low concentrations of adsorbate the Freundlich model is assumed, i.e. ensures that adsorption occurs at multilayer and heterogeneous sites, since at high concentrations the Langmuir model assumes monolayer adsorption and homogeneous sites.44,45 This fact can be interpreted through the heterogeneity factor (n) of the Sips model in which values of 1/n < 1 indicate that the adsorbents have heterogeneous sites and values close to 1 have homogeneous sites.46 From the data in Table 2 it is clear that all the values of 1/n are between 0 and 1 (PAni = 0.2304; CF = 0.1830 and PAni–CF composite = 0.3220), i.e., it is assumed that the bond between MLX and adsorbent occurs in heterogeneous as well as homogeneous sites and, moreover, the R2 values are between 0.8980 and 0.9942.
The isotherms of the single- and dual-site Langmuir–Freundlich models also combine the models of Langmuir and Freundlich. The single-site model assumes a similar theory to Sips, but applies a different mathematical equation to analyze the adsorption mechanism. The dual-site model assumes that the adsorption can occur in both homogeneous and heterogeneous sites, both present in the adsorbent.34,39,47 The characteristics equations to calculate each parameter of the single- and dual-site models are described in Table 2 as well as their values. Note that there are only three parameters analyzed for the single-site Langmuir–Freundlich model because it only assumes a homogeneous connection with adsorption sites. The dual-site Langmuir–Freundlich model presents six parameters, since it assumes that the adsorption occurs in homogeneous and heterogeneous sites. From the values obtained, the isotherm model that showed the best fit to the data, with a determination coefficient greater than or equal to 0.9901, was the dual-site Langmuir–Freundlich model, suggesting the existence of two types of active sites in the materials (PAni, CF and PAni–CF composite) and chemical interactions, consistent with the pseudo-second-order model from kinetic data.
It is noteworthy that the material that adsorbed more MLX was the PAni–CF composite (169.6 mg g−1), as can be seen in Fig. 7, which shows the plotted graphs of the amount of MLX adsorbed experimentally (q) as a function of the equilibrium concentration (Ce). In Table 2 it can be seen by adding Q1 and Q2 that the material that obtained the highest adsorptive capacity was the PAni–CF composite, with a value of 169.5 mg g−1 (91% adsorption efficiency), followed of CF with an adsorptive capacity of 160.83 mg g−1 (86.5% adsorption efficiency) and after the PAni, which exhibited an adsorption capacity of 86.22 mg g−1 (90% adsorption efficiency). These values prove that the materials agree with the literature, in which the adsorption efficiency values ranged from 63.21 to 95%.48–52 These values are very close to proving that the best model was the dual-site Langmuir–Freundlich model, in addition to presenting extremely favorable adsorption because at low concentrations the adsorption system has come into balance.53 These data show that the PAni–CF composite is a good adsorbent material thanks to the union of the adsorptive properties of two materials (PAni and CF) commonly used as adsorbents.
The theoretical adsorption capacity for MLX onto PAni, CF and the PAni–CF composite is comparable with other adsorbents reported in the literature, such as those shown in Table 3.48,54–59 The material that showed the best adsorption capacity was a PAni/cellulose acetate membrane adsorbing Hg2+ ions (280.1 mg g−1)57 and the material with second best adsorptive capacity was the PAni–CF (169.9 mg g−1) developed in this work. In the literature, there is a MLX adsorption study using MIP@Fe3O4![[thin space (1/6-em)]](https://www.rsc.org/images/entities/char_2009.gif) 58 as adsorbent material, and its adsorption capacity (88.0 mg g−1) and only work involving PAni–PPY–CFs59 composite to adsorb another drug, phenylbutazone (100.22 mg g−1), but both works obtained lower adsorption capacities than the PAni–CF composite prepared in this work. This results proved that the materials developed in this study are promising for adsorption of organic analytes, especially the PAni–CF composite, owing to the addition of CF in the polymer matrix and thus joining the adsorptive properties of the two materials.
58 as adsorbent material, and its adsorption capacity (88.0 mg g−1) and only work involving PAni–PPY–CFs59 composite to adsorb another drug, phenylbutazone (100.22 mg g−1), but both works obtained lower adsorption capacities than the PAni–CF composite prepared in this work. This results proved that the materials developed in this study are promising for adsorption of organic analytes, especially the PAni–CF composite, owing to the addition of CF in the polymer matrix and thus joining the adsorptive properties of the two materials.
| Adsorbents | Analyte | Adsorption capacity (mg g−1) |
|---|---|---|
| PAni–RH48 | Cr3+ | 4.74 |
| PAni–SD48 | 5.13 | |
| PAni54 | Methyl orange | 154.56 |
| Crosslinked PAni55 | Methylene blue | 13.85 |
| Fe3O4@SiO2–PAni56 | Humic acid | 36.36 |
| PAni/cellulose acetate membrane57 | Cr6+ | 94.34 |
| Hg2+ | 280.11 | |
| MIP@Fe3O4 (ref. 58) | Meloxicam | 88.00 |
| PAni–PPy–CFs59 | Phenylbutazone | 100.22 |
| PAni | Meloxicam | 86.22 |
| CF | Meloxicam | 160.83 |
| PAni–CF | Meloxicam | 169.62 |
3.6. Desorption studies
The desorption studies were performed using different acids and the results are shown in Fig. 8. It was found that sulfuric acid is a good eluent for desorption of MLX in all adsorbents (PAni: 96%; CF: 81% and PAni–CF: 92%) as compared to hydrochloric acid and acetic acid. The regenerated adsorbents can be re-employed for adsorption of MLX with a small decrease in percentage removal efficiency, but as mentioned above PAni–CF is more resistant over a wide range of pH.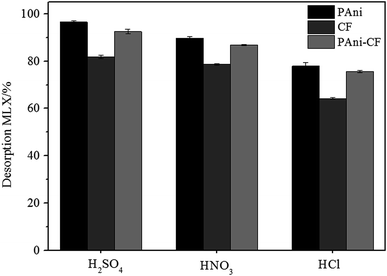 | ||
| Fig. 8 Effect of different acid solutions at 0.5 mol L−1 on MLX desorption of PAni, CF and PAni–CF composite. Conditions: see Section 3.6. | ||
4. Conclusions
CF, PAni and the PAni–CF composite have been easily prepared/synthetized with the aim of achieving the adsorption studies for MLX in aqueous medium. These materials were characterized satisfactorily by FTIR, TG and SEM. The separation of MLX by HPLC-DAD using a C18 column and a mobile phase consisting of 0.05 mol L−1 phosphate buffer at pH 6 with acetonitrile was efficient and reproducible. Adsorption and desorption studies were successfully performed, and pH 2 presented the best results for MLX adsorption. The adsorption kinetics model best suited was the pseudo-second-order model confirmed by the Elovich and intraparticle diffusion models, i.e., suggesting that the MLX adsorbs chemically on the surface and in the pores of the materials at sites with different energies. The dual-site Langmuir–Freundlich isotherm model was chosen owing to high values of determination coefficient for the three materials. However, the PAni–CF composite showed a more adequate R2 (0.9941), the highest amount of MLX adsorbed (qe = 169.6 mg g−1), better adsorption capacity (Q = 169.5 mg g−1), low variation at different pHs and an extremely favorable adsorption isotherm. This can be explained by the addition of CF in the synthesis of PAni, improving the adsorptive capacity owing to CF's adsorptive properties. Sulfuric acid was found to be a good eluent for the three materials. Finally, these materials presented important characteristics, which make them potentially applicable as adsorbents in stationary phases for separation processes in environmental and analytical studies.Acknowledgements
The authors would like to thank the Brazilian agencies CNPq (Conselho Nacional de Desenvolvimento Científico e Tecnológico), CAPES (Coordenação de Aperfeiçoamento de Pessoal de Nível Superior) and FAPEMIG (Fundação de Amparo à Pesquisa do Estado de Minas Gerais) for financial support. This study is also part of the project involving the Rede Mineira de Química (RQ-MG) supported by FAPEMIG (Project: REDE-113/10; Project: CEX – RED-0010-14).References
- H. Bagheri, Z. Ayazi and M. Naderi, Anal. Chim. Acta, 2013, 767, 1–13 CrossRef CAS PubMed.
- H. Bagheri and M. Saraji, J. Chromatogr. A, 2001, 910, 87–93 CrossRef CAS PubMed.
- F. Roohib, A. Jabbarib and M. R. Manafi, Anal. Chim. Acta, 2011, 683, 206–211 CrossRef PubMed.
- H. Bagheri, N. Alipour and Z. Ayazi, Anal. Chim. Acta, 2012, 740, 43–49 CrossRef CAS PubMed.
- W. Du, F. Zhao and B. Zeng, J. Chromatogr. A, 2009, 1216, 3751–3757 CrossRef CAS PubMed.
- Z.-l. Mo, Z.-l. Zhao, H. Chen, G.-p. Niu and H.-f. Shi, Carbohydr. Polym., 2009, 75, 660–664 CrossRef CAS.
- A. M. Youssef, M. A. El-Samahy and M. H. A. Rehim, Carbohydr. Polym., 2012, 89, 1027–1032 CrossRef CAS PubMed.
- A. Mehdinia, F. Roohib and A. Jabbari, J. Chromatogr. A, 2011, 1218, 4269–4274 CrossRef CAS PubMed.
- A. A. Asgharinezhad, H. Ebrahimzadeh, F. Mirbabaei, N. Mollazadeh and N. Shekari, Anal. Chim. Acta, 2014, 844, 80–89 CrossRef CAS PubMed.
- A. M. Youssef, S. Kamel, M. El-Sakhawy and M. A. El Samahy, Carbohydr. Polym., 2012, 90, 1003–1007 CrossRef CAS PubMed.
- V. Janaki, K. Vijayaraghavan, B. T. Oh, K. J. Lee, K. Muthuchelian, A. K. Ramasamy and S. Kamala-Kannan, Carbohydr. Polym., 2012, 90, 1437–1444 CrossRef CAS PubMed.
- I. Sowa, M. W. Kosior, K. Rokicka, R. Kocjan and G. Szymczak, Talanta, 2014, 122, 51–57 CrossRef CAS PubMed.
- S. Su, B. Chen, M. He, B. Hu and Z. Xiao, Talanta, 2014, 119, 458–466 CrossRef CAS PubMed.
- X. Wu, X. Qian and X. An, Carbohydr. Polym., 2013, 92, 435–440 CrossRef CAS PubMed.
- P. Petrov, P. Mokrev, I. Kostov, V. Uzunova and R. Tzoneva, Carbohydr. Polym., 2016, 140, 349–355 CrossRef CAS PubMed.
- H. D. Liang, D. M. Han and X. P. Yan, J. Chromatogr. A, 2006, 1103, 9–14 CrossRef CAS PubMed.
- G. Fang, W. Chen, Y. Yao, J. Wang, J. Qin and S. Wang, J. Sep. Sci., 2012, 35, 534–540 CrossRef CAS PubMed.
- Z. Duan, G. Fang, M. Pan, J. Yi, L. Fan, W. Liu and S. Wang, Anal. Methods, 2012, 3, 1821–1827 RSC.
- U. Busch, J. Schimid, G. Heinzel, H. Schmaus, J. Baierl, C. Huber and W. Roth, Drug Metab. Dispos., 1998, 26, 576–584 CAS.
- G. Carlucci, Anti-Inflammatory Anti-Allergy Agents Med. Chem., 2009, 8, 22–27 CrossRef CAS.
- R. T. Andrade, R. C. S. Silva, A. C. Pereira and K. B. Borges, Anal. Methods, 2015, 7, 7270–7279 RSC.
- T. A. Nascimento, F. V. A. Dutra, B. C. Pires, C. R. T. Tarley, V. Mano and K. B. Borges, RSC Adv., 2016, 6, 64450–64459 RSC.
- M. Abbas, S. Kaddour and M. Trari, J. Ind. Eng. Chem., 2014, 20, 745–751 CrossRef CAS.
- H. Qiu, L. Lv, B. C. Pan, Q. J. Zhang, W. M. Zhang and Q. X. Zhang, J. Zhejiang Univ., Sci., A, 2009, 10, 716–724 CrossRef CAS.
- K. M. Diniz, M. G. Segatelli and C. R. T. Tarley, React. Funct. Polym., 2013, 73, 838–846 CrossRef CAS.
- M. Z. Corazza, E. S. Ribeiro, M. G. Segatelli and C. R. T. Tarley, Microchem. J., 2014, 117, 18–26 CrossRef CAS.
- J. Laska and J. Widlarz, Polymer, 2005, 46, 1485–1495 CrossRef CAS.
- M. J. R. Cardoso, M. F. S. Lima and D. M. Lenz, Mater. Res., 2007, 10, 425–429 CAS.
- P. K. Khanna, N. Singh, S. Charan and A. K. Viswanath, Mater. Chem. Phys., 2005, 92, 214–219 CrossRef CAS.
- L. M. Huang, W. H. Liao, H. C. Ling and T. C. Wen, Mater. Chem. Phys., 2009, 116, 474–478 CrossRef CAS.
- http://www.chemicalize.org/structure/#!mol=meloxicam%26source=fp, Accessed December 2016.
- Y. S. Ho and G. Mckay, Process Saf. Environ. Prot., 1998, 76, 183–191 CrossRef CAS.
- S. Azizian, J. Colloid Interface Sci., 2004, 276, 47–52 CrossRef CAS PubMed.
- R. J. Fonseca, M. G. Segatelli, K. B. Borges and C. R. T. Tarley, React. Funct. Polym., 2015, 93, 1–9 CrossRef.
- M. Mourabet, H. E. Boujaady, A. E. Rhilassi, H. Ramdane, M. B. Ziatni, R. E. Hamri and A. Taitai, Desalination, 2011, 278, 1–9 CrossRef CAS.
- F. C. Wu, R. L. Tseng and R. S. Juang, Chem. Eng. J., 2009, 150, 366–373 CrossRef CAS.
- W. H. Cheung, Y. S. Szeto and G. Mckay, Bioresour. Technol., 2007, 98, 2897–2904 CrossRef CAS PubMed.
- J. Goscianska, M. Marciniak and R. Pietrzak, Sep. Purif. Technol., 2015, 154, 236–245 CrossRef CAS.
- D. N. Clausen, I. M. R. Pires and C. R. T. Tarley, Mater. Sci. Eng., C, 2014, 44, 99–108 CrossRef CAS PubMed.
- D. Kratochvil and B. Volesky, Trends Biotechnol., 1998, 16, 291–300 CrossRef CAS.
- M. Radhika and K. Palanivelu, J. Hazard. Mater., 2006, 138, 116–124 CrossRef CAS PubMed.
- O. S. Amuda, A. A. Giwa and I. A. Bello, Biochem. Eng. J., 2007, 36, 174–181 CrossRef CAS.
- L. Ghannam and L. Billon, J. Colloid Interface Sci., 2002, 374, 237–240 CrossRef PubMed.
- Y. S. Ho, J. F. Porter and G. Mckay, Water, Air, Soil Pollut., 2002, 141, 1–33 CrossRef CAS.
- R. Sips, J. Chem. Phys., 1948, 16, 490–495 CrossRef CAS.
- S. K. Papageorgiou, F. K. Katsaros, E. P. Kouvelos, J. W. Nolan, H. D. Le and N. K. Kanellopoulos, J. Hazard. Mater., 2006, 137, 1765–1772 CrossRef CAS PubMed.
- I. Pikaar, A. A. Koelmans and P. C. M. Van Noort, Chemosphere, 2006, 65, 2343–2351 CrossRef CAS PubMed.
- F. Kanwal, R. Rehman, T. Mahmud, J. Anwar and R. Ilyas, J. Chil. Chem. Soc., 2012, 57, 1058–1063 CrossRef CAS.
- F. Kanwal, R. Rehman, J. Anwar and M. Saeed, Asian J. Chem., 2013, 25, 2399–2404 CrossRef CAS.
- F. Kanwal, R. Rehman, S. Samson and J. Anwara, Asian J. Chem., 2013, 25, 9013–9019 CrossRef CAS.
- F. Kanwal, R. Rehman, J. Anwar and M. Saeed, J. Chem. Soc. Pak., 2012, 34, 1134–1139 CAS.
- F. Kanwal, R. Rehman, J. Anwar and T. Mahmud, Electron. J. Environ., Agric. Food Chem., 2012, 10, 2972–2985 Search PubMed.
- E. L. Cussler. Diffusion: mass transfer in fluid systems, Cambrigde University Press, New York, 3 edn, 2007, p. 655 Search PubMed.
- L. Aia, J. Jianga and R. Zhang, Synth. Met., 2010, 160, 762–767 CrossRef.
- M. Ayad and S. Zaghlol, Chem. Eng. J., 2012, 204–206, 79–86 CrossRef CAS.
- J. Wang, L. Bi, Y. Ji, H. Maa and X. Yin, J. Colloid Interface Sci., 2014, 430, 140–146 CrossRef CAS PubMed.
- R. Li, L. Liu and F. Yang, J. Hazard. Mater., 2014, 280, 20–30 CrossRef CAS PubMed.
- S. A. Deilami, M. Abdouss and D. Kordestani, Appl. Biochem. Biotechnol., 2014, 172, 3271–3286 CrossRef PubMed.
- T. A. Nascimento, F. V. A. Dutra, B. C. Pires, C. R. T. Tarley, V. Mano and K. B. Borges, RSC Adv., 2016, 6, 64450–64459 RSC.
| This journal is © The Royal Society of Chemistry 2017 |

