 Open Access Article
Experimental studies of hydrocarbon separation on zeolites, activated carbons and MOFs for applications in natural gas processing
Yunxia Yang *a,
Nick Burkea,
Suhaib Alia,
Stanley Huangb,
Seng Lima and
Yonggang Zhu
 c
c
aCSIRO Energy, 71 Normanby Rd, Clayton North, Victoria 3168, Australia. E-mail: yunxia.yang@csiro.au
bChevron Energy Technology Company, Houston, TX 77002, USA
cHarbin Institute of Technology (ShenZhen), ShenZhen, 518055, China
First published on 22nd February 2017
Abstract
Separation of minor hydrocarbon components in natural gas is necessary prior to liquefaction to avoid operational (plugging of equipment) and product specification issues. While there have been many studies describing adsorption of gases on solid materials there have been relatively few focused on decreasing concentrations of light hydrocarbons in methane in non-equilibrium experimental configurations. In order to best understand the chemistry of competitive adsorption of saturated hydrocarbons for gas processing applications we investigated light hydrocarbon dynamic adsorption properties on 16 solid adsorbents of different structures and chemistries. The best adsorbents, as determined by adsorption capacity, were tested for their ability to separate higher molecular weight hydrocarbons from methane. It is found that for charged frameworks, the induced dipole moment between the adsorbent and adsorbate plays the most important role in adsorption capacity. For uncharged frameworks, pore size plays the critical role in adsorption: micropores are more effective than mesopores. For separation of mixtures of methane, ethane, propane and butane, the kinetics of adsorption must also be considered. Of the materials tested, a carbon derived from coal and activated with steam (carbon #5 (37771)), zeolite KX and zeolite 5A were the best in terms of adsorption and separation capability. These materials show promise for separating light hydrocarbons of similar chemical nature.
1. Introduction
Natural gas is predicted to undergo a drastic increase in demand over coming decades for energy production due to its relative abundance and lower carbon footprint in comparison to other fossil resources. Natural gas can be piped directly to where it is required or can be liquefied through a refrigeration process to make Liquefied Natural Gas (LNG). Raw natural gas produced from the wellhead typically consists of methane and C2+ hydrocarbons such as ethane, propane and other heavier hydrocarbons amongst a range of other compounds. These minor hydrocarbon fractions must be lowered to avoid operational issues such as freezing and plugging in scrub columns during liquefaction and to meet product specifications before pipeline distribution. Typically, refrigeration cycles are used to separate out heavier unsaturated hydrocarbons from methane for LNG production. It is generally considered that solid sorbents are not best applied to large-scale LNG production or gas processing. However, opportunities might exist for application of solid sorbents in the small-scale processing of natural gas.Separation by adsorption is one technology that offers high selectivity to the desired product; is reliable; and has a capital cost and energy consumption comparable to similar separation techniques. Adsorption has been applied for air separation, gas dehydration and CO2 separation amongst others.1 Some work has reported the study of adsorption of saturated hydrocarbons or the separation of saturated and unsaturated hydrocarbons but fewer reports exist describing the dynamic separation of mixtures containing solely saturated hydrocarbon molecules.2–10 Small saturated hydrocarbons have similar physical dimensions (methane, ethane and propane have kinetic diameters of 4.0 Å, 4.4 Å and 4.9 Å respectively). And unlike unsaturated hydrocarbons, none of the saturated hydrocarbon molecules displays strong electronic interactions with solid surfaces, making study of their sorption behavior more difficult.
Zeolites are microporous crystalline solids that have been investigated in many gas adsorption systems, such as CO2 separation and air separation.4,11–17 Because of their electronically charged framework structures, they are often regarded as candidates for separating mixtures of gases with different charge properties. In our previous work, we studied the effect of charge-compensating cations for propane adsorption on zeolite-X. The dynamic experimental results revealed that all X-zeolites examined displayed an affinity for propane adsorption. Interestingly, unlike many non-zeolite adsorbent materials, such as carbons, surface area and pore size alone did not necessarily determine propane adsorption capacity. Of greater importance was the nature of the charge-compensating cation: specifically valence, number of ions (Si![[thin space (1/6-em)]](https://www.rsc.org/images/entities/char_2009.gif) :
:![[thin space (1/6-em)]](https://www.rsc.org/images/entities/char_2009.gif) Al ratio) and cation size.18
Al ratio) and cation size.18
SBA-15, a siliceous material that contains micropores and narrow mesopores was chosen to explore its hydrocarbon adsorption properties. It has been identified as having potential for small gas molecule adsorption.19,20 For comparison, one very high silica content microporous zeolite, Beta (BEA) zeolite (CP 811C-300, SiO2/Al2O3 = 300) was also chosen to compare the microporous and mesoporous materials.
Metal Organic Frameworks (MOFs) are another type of highly porous material developed in recent years. Their high porosity, surface area and tunable structure have made them potential candidates for gas adsorption.13,21,22 Reports on separating saturated hydrocarbons by MOFs are limited. Because it has high water tolerance and is well characterised23,24 copper benzene tricarboxylate (Cu3(BTC)2) or Cu-BTC has been chosen as a representative MOF adsorbent to test its hydrocarbon adsorption properties.
In the current work, hydrocarbon adsorption on 16 solid sorbent materials with different surface chemistries were investigated through dynamic breakthrough experiments. The materials chosen were Y zeolites exchanged with Na+, Li+, K+, Ca2+, La3+; A-zeolites including KA (3A), NaA (4A), and CaA (5A), 5 type of commercial carbon materials, beta-zeolite, SBA-15 and Cu-BTC. Adsorption and desorption cycles were run on selected adsorbents to examine their durability. Sorption mechanisms and chemistries underlying the observed sorption behavior are proposed.
2. Experimental
2.1 Materials and synthesis
The A zeolites, Faujasite NaY, NaX zeolite, beta-zeolite (SiO2/Al2O3 = 300) and all the carbon samples were purchased from Sigma Aldrich.LiY, KY, CaY and LaY, LiX, KX, CaX and LaX were synthesized in our lab. In general, the procedure was to weigh a certain amount of the zeolite (20 g) in a glass conical flask stirred with a magnetic stirrer bar. The desired amount of salt solution (0.5 M LiCl, 1 M KCl, 1 M CaCl2, 0.1 M LaCl3) was added to the flask. The pH of the solution was adjusted to ∼9 by KOH if necessary. The conical flask was placed in an oil bath, stirred and heated at 65–80 °C overnight. Then, the suspension was filtered and washed with hot distilled water to remove the excess salt. The above ion-exchange procedure was repeated twice to ensure a high degree of ion-exchange. Finally, the sample was filtered and washed with hot distilled water and dried in the oven overnight at ∼100 °C.
The metal organic framework material, Cu-BTC and the structured mesoporous pure siliceous SBA-15 were synthesized according to literature.25,26
2.2 Characterization
Nitrogen adsorption isotherms were measured using a Micromeritics Tristar 3000. BET Surface area and pore volume of the synthesized adsorbents were obtained from these isotherms. Samples were degassed on a vacuum prep at 350 °C overnight before analysis. Cu-BTC degassing temperature was 150 °C. Langmuir/BET surface area was extracted from the adsorption isotherm at a relative pressure p/p0 less than 0.12. Micropore volume was obtained by t-plot and total pore volume by single point pore volume at a relative pressure p/p0 = 0.99. Pore size distribution was obtained by using non-local density functional theory for slit pore geometry. Elemental analysis was conducted on a Philips PW2404 XRF instrument. Li element was analysed by Varian Vista ICP-OES. X-ray diffraction (XRD) data were collected on a Philips PW 1140/90 using a Cu Kα radiation source at 25 kV and 40 mA.2.3 Dynamic breakthrough experiments
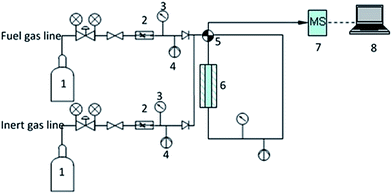
The breakthrough apparatus was developed in our previous work to measure the gas breakthrough curves (Fig. 1).18 It consisted of three main sections: preparation section; adsorption section; and the analytical section. In the gas preparation section, the purge gas was high purity Ar gas (99.999%) which was used to purge the system through the inert gas line and the reactor before the hydrocarbon gas was introduced. The adsorption section used a 1.0 mol% propane or ethane in helium gas or artificial gas mixture (0.504 mol% n-butane, 2.51 mol% propane, 4.98 mol% ethane), which passed through the fuel gas line and the reactor. Both lines ran into a four-port crossover valve.The whole set up was run isothermally (∼26 °C). Valve positions, gas flowrate, pressure and temperature were completely automated and controlled by an in-house designed LabView program. The gas from the reactor outlet was analyzed and quantified by a Pfeiffer Mass Spectrometer (MS). The breakthrough curve is a plot of the reactor outlet gas concentration against adsorption time. When the outlet gas concentration reaches the inlet gas concentration, it is called as a complete breakthrough. Generally, the breakthrough curve represents adsorption characteristics between the adsorbate and the adsorbent. The adsorption reactor consisted of a 6 mm i.d. stainless steel column. All adsorbents were pelletized to an average size of 300–500 μm (without using binder) to avoid pressure drop across the bed. During the breakthrough experiment, the reactor column was filled with adsorbents (0.4 g) which were pre-degassed on a vacuum prep unit (Micromeritics, USA) at 350 °C overnight and packed uniformly to about 35 mm in height. After packing, Ar gas from the inert line purged the system and reactor at ambient temperature until the MS baselines were stable. Then, hydrocarbon gas from fuel gas line was introduced into the reactor at a flow rate of ∼130 ml min−1 and adsorption started. Outlet gas concentrations were monitored online throughout the process by the MS. When the saturation state was reached, fuel gas feed was terminated. At this point Ar was introduced and reactor purging started while heating up the reactor by the furnace to ∼60 °C to desorb any adsorbed material and regenerate the adsorbent.
The propane or ethane adsorption capacity on the adsorbent was obtained by integrating the reactor outlet gas concentration profiles over the entire breakthrough time,  , where q was the amount adsorbed; u was the gas flow rate, ml min−1; Cin was the inlet gas concentration and Cout was the outlet gas concentration. t was the time that it took for the hydrocarbon gas to reach a complete breakthrough from the adsorbent bed after adsorption started.
An artificial natural gas containing 0.504 mol% n-butane, 2.51 mol% propane, 4.98 mol% ethane balanced in methane that simulated the natural gas prior to liquefaction was used to investigate the hydrocarbon mixture separation properties. The size of the gas molecules of interest is given in Table 1. The adsorbents chosen in this experiment were the best (adsorbents with the highest capacities for the sorbate gases tested) identified in each group of adsorbents in the current work, namely zeolites 5A, KX, KY, and carbon #5.
| Gas molecule | Methane | Ethane | Propane | Butane |
| Critical diameter, Å | 4.0 | 4.4 | 4.9 | 5.1 |
3. Results and discussion
3.1 Propane adsorption
| Adsorbent | SiO2/Al2O3 | Lia | Naa | Ka | Caa | Laa | Summation of charge on alkaline cationsa | Degree of ion exchange, % |
|---|---|---|---|---|---|---|---|---|
| a mol/100 gram zeolite.b Under detection limit.c Commercial NaY sample. | ||||||||
| LiY (LiNaY) | 5.2 | 0.16 | 0.18 | —b | —b | —b | 0.34 | 47 |
| NaYc | 5.2 | —b | 0.32 | —b | —b | —b | 0.32 | 0 |
| KY (KNaY) | 5.2 | —b | 0.02 | 0.30 | —b | —b | 0.32 | 94 |
| CaY (CaNaY) | 5.2 | —b | 0.07 | —b | 0.13 | —b | 0.33 | 79 |
| (LaNaY) | 4.98 | —b | 0.05 | 0.03 | 0.14 | 64 | ||
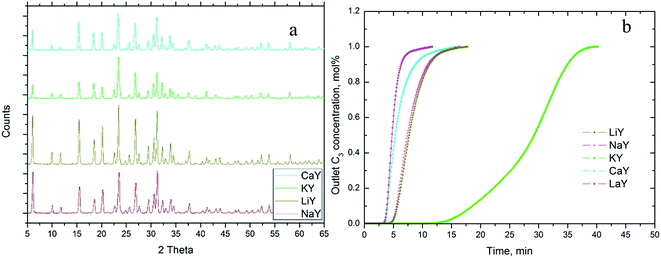
It was clear from the elemental analysis results that the ion-exchange of the zeolites was not 100% complete. Only a fraction of Na ions was replaced by the target ions. Therefore, in the synthesised zeolite framework, ions were a mixture of ion-exchanged ions and original Na ions. The XRD results confirmed the FAU framework structural of all the ion-exchanged zeolites, Fig. 2a and no major structure change observed. No information is available on the compensating ions from XRD. However, XRF information (Table 2) gives information on concentration of these cations.
Propane breakthrough curves for all the Y zeolites are shown in Fig. 2b. The slope of the adsorption front determines the extent to which the capacity of an adsorbent bed can be utilised and also reflects the adsorption rate. Therefore, the shape of the curve is very important in determining the useful length of the adsorption bed. In actual practice, the steepness of the concentration profiles can increase or decrease, depending on the type of adsorption involved. In our case, LaY and CaY had the steepest slopes, indicating fast adsorption kinetics and a more complete utilization of the adsorbent bed which is a similar conclusion that was drawn for propane adsorption on the X zeolites having La and Ca as charge balancing ions.18 This suggests strong binding between the Y zeolites containing La and Ca and the propane adsorbate.18 Y zeolites exchanged with Li and Na had less steep slopes, suggesting slower adsorption kinetics and consequently a lower useful bed length than the La and Ca-exchanged Y zeolites. The breakthrough curve for KY had a less steep slope compared to the rest of the Y zeolites, suggesting slower adsorption kinetics. K+ ions are the largest of any used in this study (see Table 3). The relatively large size of these ions could block access to some of the adsorption sites. In this case, axial dispersion may come into effect and a broader mass transfer zone was occurring. K+ ions, especially after solvation with water molecules captured during the packing step may have occupied a window site of the supercage in Y zeolite, causing a partial blockage of the pores, resulting in slower diffusion of propane through the window into the supercage. Propane breakthrough through the adsorption bed and the adsorption capacity on all the Y zeolites followed the same trend as KY > LiY ≥ NaY ≥ CaY > LaY (Table 3). Despite the slower kinetics observed, KY showed the highest adsorption capacity in comparison to the other Y zeolites. This was possibly a function of the induced dipole moment and the relatively high polarizability of the K cations.
| Adsorbent | Breakthrough timea, min | Cation size Å | Langmuir surface area m2 g−1 | Polarizability of cation, 10−24 cm3 | Total numbers of cations/g (1021) | C3 adsorption capacity wt% |
|---|---|---|---|---|---|---|
| a Outlet concentration is 80% of the inlet concentration. | ||||||
| LaY (La3+) | 5.7 | 1.03 | 866 | — | 0.48 | 1.05 |
| CaY (Ca2+) | 7.2 | 0.99 | 960 | 0.471 | 1.2 | 2.10 |
| NaY (Na+) | 9.6 | 0.97 | 949 | 0.18 | 1.93 | 2.55 |
| LiY (Li+) | 10.0 | 0.68 | 1043 | 0.029 | 2.05 | 2.92 |
| KY (K+) | 33.3 | 1.33 | 858 | 0.84 | 1.93 | 8.69 |
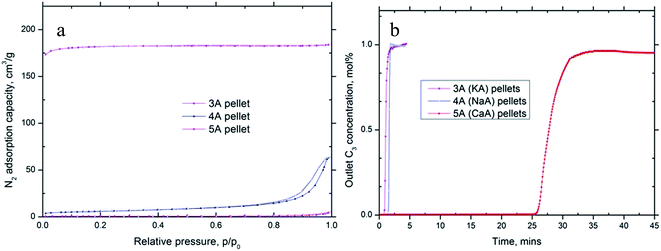
Fig. 3b shows the propane breakthrough curves obtained for the three different A zeolites. Interestingly, with 3A and 4A, there was almost an immediate propane breakthrough while with 5A, breakthrough started 25 minutes after commencement of adsorption, suggesting good propane adsorption. Considering the size of propane is around 4.9 Å which is bigger than the effective window size in 3A and 4A, the immediate propane breakthrough curves of the two A zeolites suggested propane was unable to access the pores of the 3A and 4A materials. However, for 5A zeolite, the divalent calcium cations are situated at the window sites and give apertures of ∼5 Å which excludes molecules with diameter larger than 5 Å thus allows access to the propane molecule. The calculated propane adsorption capacity on different A zeolites is shown in Table 4. The results showed that 3A, 4A had little propane adsorption while 5A had a very good propane adsorption capacity of 8.1 wt%.
The nitrogen adsorption isotherms for all the carbons are shown in Fig. 4a. All carbons exhibit type I isotherms. Some of the isotherms had small or no hysteresis loop, suggesting the microporous nature of the carbon (carbon #2 and #3). The others have hysteresis loops, revealing a more heterogeneous pore system (carbon #1, #4 and #5). Surface area and pore volume information for all carbon samples are summarized in Table 5.
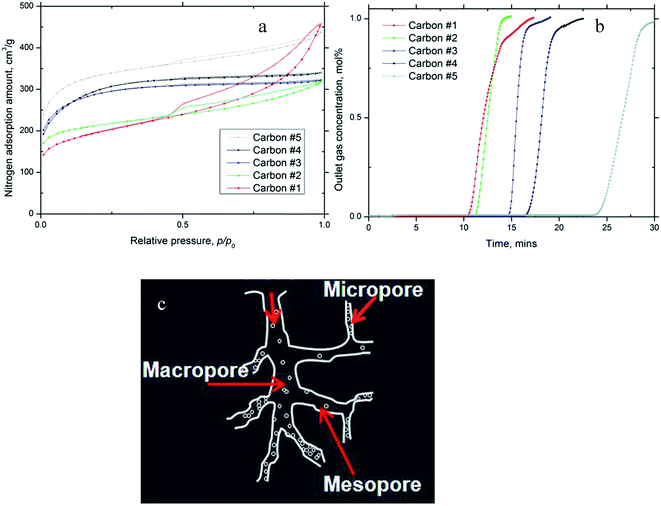 | ||
| Fig. 4 (a) Nitrogen adsorption isotherms; (b) C3H8 breakthrough results for carbon samples; (c) cartoon image for gas adsorbed in activated carbon. | ||
| Adsorbent | BET surface area m2 g−1 | Vmicro cm3 g−1 | Vtotal cm3 g−1 | C3H8 adsorption capacity wt% |
|---|---|---|---|---|
| a Carbon #1: 96831 carbon #2: 22874 carbon #3: 660689 carbon #4:SL carbon #5: 37771. | ||||
| Carbon #1 | 647 | 0.28 | 0.49 | 5.0 |
| Carbon #2 | 676 | 0.31 | 0.71 | 5.30 |
| Carbon #3 | 916 | 0.41 | 0.50 | 5.90 |
| Carbon #4 | 951 | 0.43 | 0.53 | 6.7 |
| Carbon #5 | 1054 | 0.50 | 0.68 | 8.58 |
Propane breakthrough experimental results for all the carbon adsorbents are presented in Fig. 4b. The breakthrough curve fronts for all the carbons were very steep, suggesting fast adsorption kinetics and a good effective bed usage. All the carbons had very similar breakthrough curve slopes, with the exception of carbon #5, which had a less steep front. This suggests the propane adsorption behavior in most of the carbons was similar. Propane adsorption capacities on all the carbons were calculated and are presented in Table 5, following the trend from highest to lowest capacity as follows: carbon #5 > #4 > #3 > #2 > #1.
On careful examination of the physical properties of the carbons (Table 5), it was found the propane adsorption capacity is more dependent on the micropore volume (Vmicro) and surface area than the total pore volume (Vtotal). Micropores are classified as those with pore diameters <2 nm.
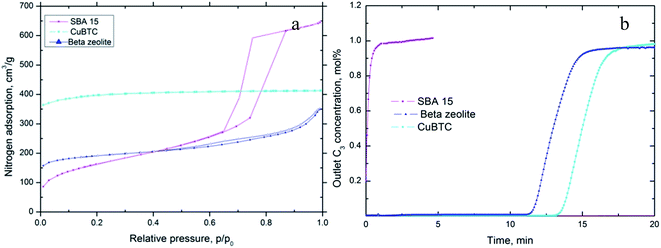 | ||
| Fig. 5 (a) Nitrogen adsorption isotherms for SBA-15, Cu-BTC and BEA-zeolite; (b) C3H8 breakthrough results for SBA-15, beta-zeolite and Cu-BTC. | ||
| Adsorbent | BET surface area (m2 g−1) | Micropore volume, Vmicro (cm3 g−1) | Mesopore volume, Vmeso (cm3 g−1) | C3H8 adsorption capacity (wt%) |
|---|---|---|---|---|
| SBA-15 | 560 | 0.01 | 1.18 | 0.51 |
| BEA-zeolite | 866 | 0.2 | 0.31 | 3.13 |
| Cu-BTC | 1770 | 0.51 | 0.13 | 4.79 |
The nitrogen adsorption isotherm for beta-zeolite is a typical type I isotherm, with a narrow hysteresis loop, confirming the structure was microporous with a small amount of mesopores (Fig. 5a). The surface area of beta-zeolite is 866 m2 g−1 and micropore volume is 0.2 cm3 g−1 (Table 6). The synthesized SBA-15 has a surface area of 560 m2 g−1 (Table 6). It is worth noting that the micropore volume of SBA-15 is as low as 0.01 cm3 g−1, by far the lowest of the three materials in this series. However, SBA-15 contains a significant number of mesopores with pore size around 10 nm (mesopore volume = 1.18 cm3 g−1 – Table 6).
The breakthrough results for these two materials show that 3.13 wt% propane adsorbed on beta-zeolite whereas SBA-15 propane sorption capacity was calculated to be only 0.51% (Fig. 5b and Table 6).
Given the main difference between SBA-15 and beta zeolite is the micropore volume, we concluded that propane adsorption occurred mainly in the micropores in these siliceous materials and that little or no propane was adsorbed in the mesopores.
Cu-BTC is one of the best characterised MOF structures. The coordinated organic (BTC) ligands form small cavities of size 4.6 Å that is close in size to that of the propane gas molecule (3.8 Å). Also the framework is relatively hydrophobic meaning water does not compete with propane for adsorption sites and the framework is stable under moisture-containing environments. The Cu-BTC synthesized in our work was highly microporous as can be seen from its nitrogen adsorption isotherm (Fig. 5a) and had a much higher surface area (1770 m2 g−1) than those of beta-zeolite and SBA-15 (Table 6). Propane exhibited good adsorption on Cu-BTC. Its propane adsorption capacity was calculated to be 4.79 wt%, which was much higher than those on beta-zeolite and SBA-15. Similar to beta-zeolite and SBA-15, Cu-BTC has little network charge and therefore very weak electric fields with which to induce significant induced adsorption interaction. The dominant adsorbent/propane interaction in Cu-BTC would reduce to steric interactions in which pore size plays the most significant role. Analysis of the nitrogen adsorption isotherm shows Cu-BTC has a much smaller pore size and much larger micropore volume of 0.5 m3 g−1 (Table 5), than either beta-zeolite or SBA-15. The higher propane adsorption capacity of Cu-BTC can therefore be ascribed to the larger micropore volume of this material. Interestingly, although the surface area of Cu-BTC is almost double and the micropore volume is more than double that of beta-zeolite, the propane adsorption capacity is only 53% higher. This could indicate other factors aside from micropore volume and surface area contribute to the adsorption capacity in these materials.
In summary, pore size and the charge on the framework play the most significant roles in propane adsorption. For adsorbents that have no framework charge, the adsorbate and adsorbent interaction reduces to intrinsic interaction where pore size plays the critical role in binding energy. Micropores are more effective in adsorbing propane than the larger mesopores. Charged frameworks can generate electric fields which can enhance interaction between adsorbent and adsorbate.
3.2 Ethane adsorption
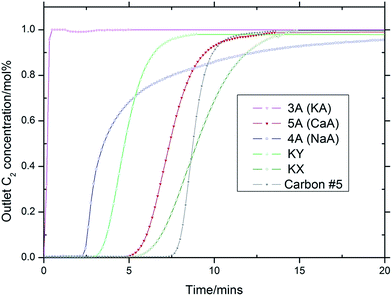
In Section 3.1 we examined propane adsorption on several different adsorbents. With the results obtained, we were able to identify the best material for propane adsorption (in terms of adsorption capacity) for each of the adsorbent groups. Since ethane and propane are the two components that are both similar in nature and the most difficult to separate during natural gas processing/purification, it was decided to test the selected adsorbents for ethane adsorption. Although the A zeolites, particularly 3A and 4A showed poor propane adsorption, it might have potential for ethane adsorption and therefore were chosen for testing as well.Surface area and pore size information for all the tested adsorbents in this section can be found in the previous Section 3.1. Ethane breakthrough experimental results for all the selected adsorbents are presented in Fig. 6 and their ethane adsorption capacity is given in Table 7.
| Adsorbent | 3A (KA) | 4A (NaA) | 5A (CaA) | KY | KX | Carbon #5 |
| C2H6 adsorption capacity wt% | 0.08 | 1.12 | 2.78 | 2.52 | 3.70 | 5.85 |
Among the A zeolites, 3A showed immediate ethane breakthrough, suggesting no ethane adsorption on 3A. For 4A zeolite, the adsorption capacity was calculated to be 1.12 wt%. The breakthrough front of this zeolite was much more gradual than other A zeolites, suggesting a slower ethane adsorption rate, possibly due to slower diffusion into the pores of 4A compared to the larger pore 5A zeolite. Also, the divalent charge compensating ion in 5A, Ca2+ replaced two Na+ ions so the total number of cations in 5A was much less than that in 4A. This would open up more of the framework window access to ethane gas molecules, leading to more ethane adsorption in 5A (2.78 wt%) than in 3A (none detected) and 4A (1.12 wt%).
KY zeolite showed a reasonable ethane adsorption (2.52 wt%) which was slightly less than that of 5A (2.78 wt%) though KY had much higher surface area than 5A (Tables 3 and 4). The SiO2/Al2O3 ratio of KY is 5.2 (Table 2) while that of 5A is 1.99 (Table 4), suggesting there was more charge on the 5A framework than that of KY and consequently a stronger electric field generated in 5A. It would appear that framework charge has a greater effect on ethane adsorption capacity in this case than surface area. This is consistent with earlier work.18
The adsorption capacity of ethane on KX is 3.70 wt%. Both KY and KX are FAU type zeolites. The pore size is very similar but the alumina content of the X zeolite is higher, meaning there is more charge on the KX framework. Given the only difference between KX and KY is the number of charge compensating ions (higher in X) it is reasonable to conclude that the difference in ethane adsorption capacity between the two can be attributed to the framework charge compensating ions. With the result obtained here we can conclude that ethane adsorption is a function of charge on the zeolite framework.
As was the case in the propane adsorption experiments, carbon #5 showed the best adsorption capacity for ethane for all the sorbents tested. This was attributed to its larger surface area and micropore volume compared to the other materials.
3.3 Natural gas separation
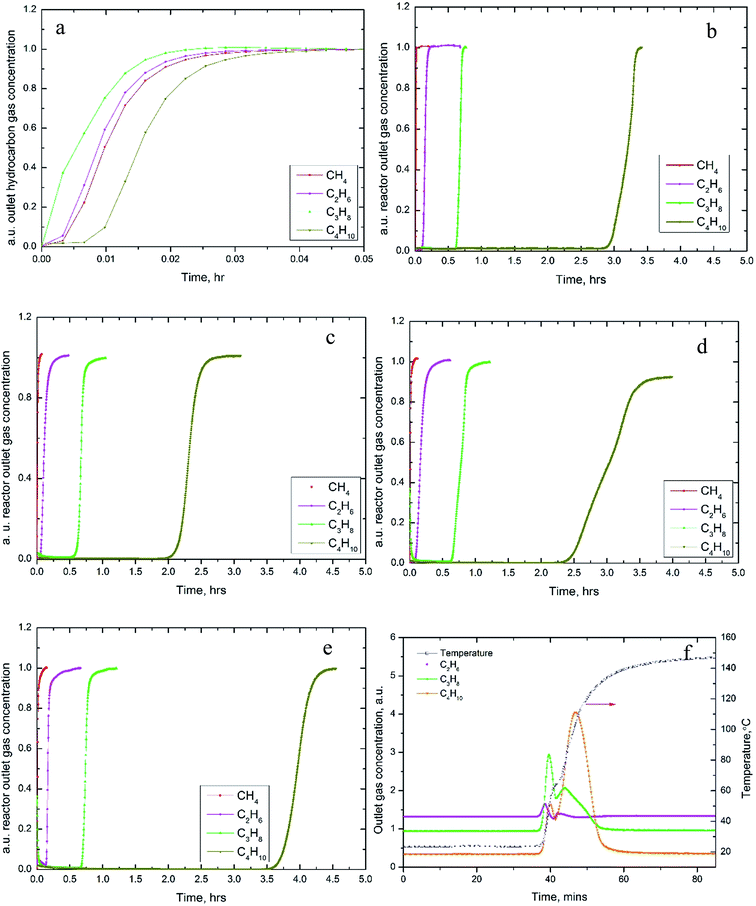
In general, butane, propane were retained longer than ethane on the five selected adsorbents. 3A showed little adsorption of ethane and propane and small amount of butane. KY, KX and 5A all showed good adsorption for all hydrocarbons, with methane breakthrough firstly, ethane second, then propane and last with butane, suggesting an excellent separation between them. But under the current experimental conditions, 5A performed better in terms of separation. It took 3 hours for the 0.504 mol% n-butane to completely breakthrough from the 5A column. Carbon #5 showed better adsorption behavior than all the zeolite adsorbents, with propane and especially butane breaking through from the column in 3.5 hours.
3.4 Conclusions
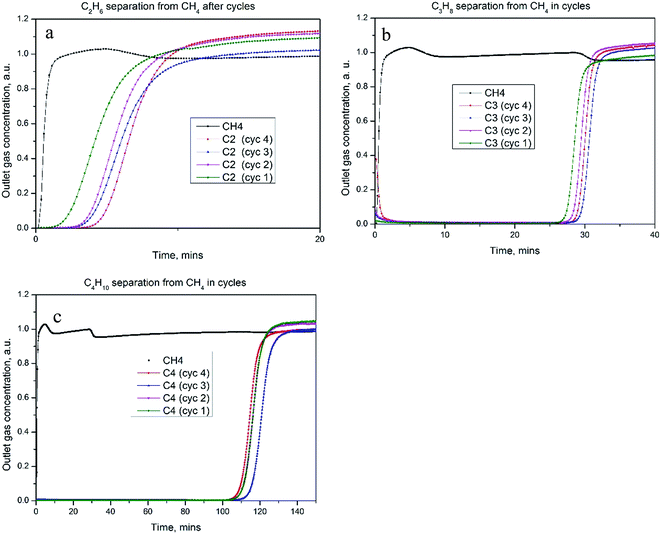
Usually, refrigeration cycles but not solid adsorbents are used for natural gas purification. Our work has thoroughly proved that solid adsorbent materials can be used to adsorb and separate heavier hydrocarbons from natural gas. We have successfully demonstrated ethane, propane and butane adsorption and separation from methane on a range of adsorbents. Factors critical in the selection of suitable adsorbents for adsorption and separation of hydrocarbon components in natural gas include: framework charge; surface area and micropore volume; and adsorption kinetics. For adsorbents that have no framework charge, the adsorbate and adsorbent interaction reduces to intrinsic interaction where pore size plays the critical role in binding energy. Micropores are more effective in adsorbing propane than the larger mesopores. It is postulated that charged frameworks can generate electric fields which can enhance interaction between adsorbent and adsorbate.Study of adsorbate gas mixtures that simulated the natural gas compositions prior to liquefaction further confirmed the hydrocarbon separation properties on the selected good adsorbents. The cycling behavior of adsorbent materials was proven to be excellent and little deterioration was observed after cycles.
Although solid adsorbents aren't typically used for natural gas purification, those studied in this work have shown promise for separation of compounds similar in chemical makeup. While solid adsorbents might have limited appeal in large-scale LNG and gas processing operations, there looks to be some substantial opportunity for application of these materials in small-scale and distributed operations.
Acknowledgements
The authors would like to acknowledge Chevron Corp. who, through the Western Australian Energy Research Alliance (WAERA), has supported this work. The authors are also grateful to CSIRO for providing additional financial support.References
- H. Yang, Z. Xu, M. Fan, R. Gupta, R. B. Slimane, A. E. Bland and I. Wright, J. Environ. Sci., 2008, 20, 14–27 CrossRef CAS.
- C. A. Grande, J. Gascon, F. Kapteijn and A. E. Rodrigues, Chem. Eng. J., 2010, 160, 207–214 CrossRef CAS.
- R. J. Grant and M. Manes, Ind. Eng. Chem. Fundam., 1966, 5, 490–498 CAS.
- R. Harlfinger, D. Hoppach, U. Quaschik and K. Quitzsch, Zeolites, 1983, 3, 123–128 CrossRef CAS.
- T.-L. Hu, H. Wang, B. Li, R. Krishna, H. Wu, W. Zhou, Y. Zhao, Y. Han, X. Wang, W. Zhu, Z. Yao, S. Xiang and B. Chen, Nat. Commun., 2015, 6, 1–9 Search PubMed.
- Y. J. Wu, Y. Yang, X. M. Kong, P. Li, J. G. Yu, A. M. Ribeiro and A. E. Rodrigues, J. Chem. Eng. Data, 2015, 60, 2684–2693 CrossRef CAS.
- J. Kim, L.-C. Lin, R. L. Martin, J. A. Swisher, M. Haranczyk and B. Smit, Langmuir, 2012, 28, 11923–11928 Search PubMed.
- N. Lamia, M. A. Granato, P. S. A. Gomes, C. A. Grande, L. Wolff, P. Leflaive, D. Leinekugel-le-Cocq and A. E. Rodrigues, Sep. Sci. Technol., 2009, 44, 1485–1509 CrossRef CAS.
- N. Lamia, M. Jorge, M. A. Granato, F. A. Almeida Paz, H. Chevreau and A. E. Rodrigues, Chem. Eng. Sci., 2009, 64, 3246–3259 CrossRef CAS.
- W. K. Lewis, E. R. Gilliland, B. Chertow and D. Bareis, J. Am. Chem. Soc., 1950, 72, 1160–1163 CrossRef CAS.
- S. E. Siporin, B. C. McClaine and R. J. Davis, Langmuir, 2003, 19, 4707–4713 CrossRef CAS.
- T. H. Yeon, H. S. Han, E. D. Park and J. E. Yie, Microporous Mesoporous Mater., 2009, 119, 349–355 CrossRef CAS.
- F. N. Ridha, Y. X. Yang and P. A. Webley, Microporous Mesoporous Mater., 2009, 117, 497–507 CrossRef CAS.
- M. Palomino, A. Corma, F. Rey and S. Valencia, Langmuir, 2009, 26, 1910–1917 CrossRef PubMed.
- H. Liu, Z. Zhang, B. H. Chen and Y. Zhao, J. Porous Mater., 2008, 15, 119–125 CrossRef CAS.
- O. Talu, S. Y. Zhang and D. T. Hayhurst, J. Phys. Chem., 1993, 97, 12894–12898 CrossRef CAS.
- O. M. Dzhigit, A. V. Kiselev, T. A. Rachmanova and S. P. Zhdanov, J. Chem. Soc., Faraday Trans. 1, 1979, 75, 2662–2677 RSC.
- Y. Yang, N. Burke, J. Zhang, S. Huang, S. Lim and Y. Zhu, RSC Adv., 2014, 4, 7279–7287 RSC.
- H. Vinh-Thang, Q. L. Huang, M. Eic, D. Trong-on and S. Kaliaguine, Langmuir, 2005, 21, 5094–5101 CrossRef PubMed.
- K. Kosuge, S. Kubo, N. Kikukawa and M. Takemori, Langmuir, 2007, 23, 3095–3102 CrossRef CAS PubMed.
- H. M. Wen, B. Li, H. L. Wang, R. Krishna and B. L. Chen, Chem. Commun., 2016, 52, 1166–1169 RSC.
- G. G. Chang, B. Li, H. L. Wang, T. L. Hu, Z. B. Bao and B. L. Chen, Chem. Commun., 2016, 52, 3494–3496 RSC.
- M. Eddaoudi, J. Kim, N. Rosi, D. Vodak, J. Wachter, M. O'keeffe and O. M. Yaghi, Science, 2002, 295, 469–472 CrossRef CAS PubMed.
- K. C. Szeto, K. P. Lillerud, M. Tilset, M. Bjorgen, C. Prestipino, A. Zecchina, C. Lamberti and S. Bordiga, J. Phys. Chem. B, 2006, 110, 21509–21520 CrossRef CAS PubMed.
- D. Y. Zhao, J. L. Feng, Q. S. Huo, N. Melosh, G. H. Fredrickson, B. F. Chmelka and G. D. Stucky, Science, 1998, 279, 548–552 CrossRef CAS PubMed.
- Y. K. Seo, G. Hundal, I. T. Jang, Y. K. Hwang, C. H. Jun and J. S. Chang, Microporous Mesoporous Mater., 2009, 119, 331–337 CrossRef CAS.
- J. Shang, G. Li, R. Singh, Q. Gu, K. M. Nairn, T. J. Bastow, N. Medhekar, C. M. Doherty, A. J. Hill, J. Z. Liu and P. A. Webley, J. Am. Chem. Soc., 2012, 134, 19246–19253 CrossRef CAS PubMed.
| This journal is © The Royal Society of Chemistry 2017 |

