 Open Access Article
Copolymerization of Eu(TTA)3Phen doped styrene and methyl methacrylate nanoparticles and use in quantitative detection of pepsinogen
Feng Wu†
a,
Mao Mao† a,
Yu Cena,
Hongtian Yangb,
Zhifeng Qinc and
Lan Ma*a
aDivision of Life Science and Health, Graduate School at Shenzhen, Tsinghua University, Shenzhen, 518055, P. R. China. E-mail: malan@sz.tsinghua.edu.cn
bShenzhen College of International Education, Shenzhen, 518048, P. R. China
cShenzhen Entry-Exit Inspection and Quarantine Bureau of the People's Republic of China (SZCIQ), Shenzhen, 518045, P. R. China
First published on 21st February 2017
Abstract
High fluorescence intensity nanoparticles were prepared by copolymerization of Eu(TTA)3Phen doped styrene and methyl methacrylate. The fluorescent nanoparticles were used as labels for the quantitative detection of serum pepsinogens. Anti-pepsinogen I antibodies and anti-pepsinogen II antibodies were coated on the nitrocellulose membrane as test line 1 and test line 2 respectively. Serum pepsinogen I and pepsinogen II were detected simultaneously in one strip through sandwich immunoassay. This immunoassay strip can analyze the serum pepsinogens in one step and obtain results within 15 minutes. The limit of detection of this immunoassay strip for PG I and PG II standard analytes was 0.5 ng mL−1. The reproducibility and recovery tests shows that the quantitative results were accurate, and the strip can be used in clinical applications.
1. Introduction
Fluorescent nanoparticles have been widely used in the field of biological and medical applications. Such nanoparticles provide a new method for the detection of related medical and biological markers due to their stability and high-yield properties. In the past years, europium complex doped polymers as nano-fibers and nanoparticles were widely researched1–6 and it is known that europium complex doped poly(methyl methacrylate) (PMMA) and europium complex doped polystyrene (PS) show a high fluorescence intensity and thermal stability.3–6 Europium complex doped latex nanoparticles are increasingly applied in clinical applications such as cellular and molecular imaging and immunodetection because of their relatively low cytotoxicity and good biocompatibility.7 In this work, we found that europium complex doped copolymerization of PMMA and PS had stronger fluorescence intensity than single polymerization. The effect on the fluorescence intensity and the relationship between the styrene ratio and the methyl methacrylate ratio were investigated.Pepsinogen (PG) includes pepsinogen I (PG I) and pepsinogen II (PG II), is a prognostic marker in gastrointestinal disease.8 Alteration of serum pepsinogen concentrations has been found to associate with diseases such as Helicobacter pylori infection, peptic ulcer disease, gastritis, and gastric cancer.8–12 Quantitative detection of serum PG I and PG II concentrations can be used as means for monitoring the gastric diseases. To date, numerous analytical methods have been used in the detection of PG concentrations such as radioimmunoassay (RIA), enzyme-linked immunosorbent assay (ELISA) and time-resolved fluoroimmunoassay (TRFIA).13,14 Most of these methods need 2 to 3 hours of incubation and require professional operations. Gastroscopy is the golden standard for gastric disease detection, but it is painful and expensive for patients. Lateral flow immunochromatographic assay (LFIA) have been widely used in detection of medical and biological markers for being convenient, highly efficient, and relatively low cost.15,16 For these reasons, we have developed a rapid and low cost method for the detection of pepsinogen based on LFIA and high fluorescent intensity nanoparticles.
In this paper, we prepared high fluorescence intensity nanoparticles with europium complexes doped copolymerization of PMMA and PS. Carboxyl-functionalized polyvinyl alcohol (PVA) was used as dispersion agents and it provided a long chain carboxyl group. The synthesized nanoparticles were used as fluorescent tags for the detection of serum pepsinogen. Based on LFIA, PG I and PG II were quantitatively analyzed.
2. Materials and methods
2.1. Materials
Europium(III) chloride hexahydrate (EuCl3·6H2O), 2-thenoyltrifluoroacetone (TTA), 1,10-phenanthroline (Phen), poly(vinyl alcohol) (PVA, MW = 9000–10![[thin space (1/6-em)]](https://www.rsc.org/images/entities/char_2009.gif) 000), N,N-dimethylformamide (DMF), succinic anhydride, styrene (St), methyl methacrylate (MMA), potassium persulfate (KPS), 2-(N-morpholino) ethanesulfonic acid (MES), and D-(+)-glucose were purchased from Sigma-Aldrich (Shanghai, China). Sodium phosphate dibasic, sodium phosphate monobasic monohydrate, bovine serum albumin (BSA), dimethyl sulphoxide (DMSO) and Tween-20 were purchased from Shanghai Sangon Ltd. (Shanghai, China). 1-Ethyl-3-[3-dimethylaminopropyl]carbodiimide hydrochloride (EDC), Gibco® newborn bovine serum were purchased from Thermo Fisher Scientific, Inc. (Waltham, MA. U.S.A.). Goat anti-mouse IgG antibody was purchased from Arista Biologicals, Inc. (Allentown, PA. U.S.A.). Pepsinogen I and pepsinogen II antibodies (mAb IgG) were obtained from Life Science Division, Tsinghua University. Pepsinogen I antigen, pepsinogen II antigen were purchased from Fitzgerald company. Human serum samples were donated by the Shenzhen Children's Hospital. Styrene and methyl methacrylate were washed using 10% sodium hydroxide solution and deionized water three times before use to remove the inhibitor.
000), N,N-dimethylformamide (DMF), succinic anhydride, styrene (St), methyl methacrylate (MMA), potassium persulfate (KPS), 2-(N-morpholino) ethanesulfonic acid (MES), and D-(+)-glucose were purchased from Sigma-Aldrich (Shanghai, China). Sodium phosphate dibasic, sodium phosphate monobasic monohydrate, bovine serum albumin (BSA), dimethyl sulphoxide (DMSO) and Tween-20 were purchased from Shanghai Sangon Ltd. (Shanghai, China). 1-Ethyl-3-[3-dimethylaminopropyl]carbodiimide hydrochloride (EDC), Gibco® newborn bovine serum were purchased from Thermo Fisher Scientific, Inc. (Waltham, MA. U.S.A.). Goat anti-mouse IgG antibody was purchased from Arista Biologicals, Inc. (Allentown, PA. U.S.A.). Pepsinogen I and pepsinogen II antibodies (mAb IgG) were obtained from Life Science Division, Tsinghua University. Pepsinogen I antigen, pepsinogen II antigen were purchased from Fitzgerald company. Human serum samples were donated by the Shenzhen Children's Hospital. Styrene and methyl methacrylate were washed using 10% sodium hydroxide solution and deionized water three times before use to remove the inhibitor.
2.2. Synthesis of Eu(TTA)3Phen
Eu(TTA)3Phen was prepared according to a reported method.4 Briefly, 0.73 g of EuCl3·6H2O salt (2 mmol) was dissolved in 20 mL of ethanol in flask. TTA (6 mmol) and Phen (2 mmol) were dissolved in 20 mL of ethanol in another flask. The EuCl3·6H2O salt solution was slowly dropped into the TTA and Phen solution with continuous stirring. The pH value of the solution was adjusted to 7. Then the solution reacted at room temperature for 2 hours. The precipitate produced was washed by ethanol and centrifuged three times at 10![[thin space (1/6-em)]](https://www.rsc.org/images/entities/char_2009.gif) 000g. The product formed is dried for 12 hours at 60 °C in oven.
000g. The product formed is dried for 12 hours at 60 °C in oven.
2.3. PVA functionalization
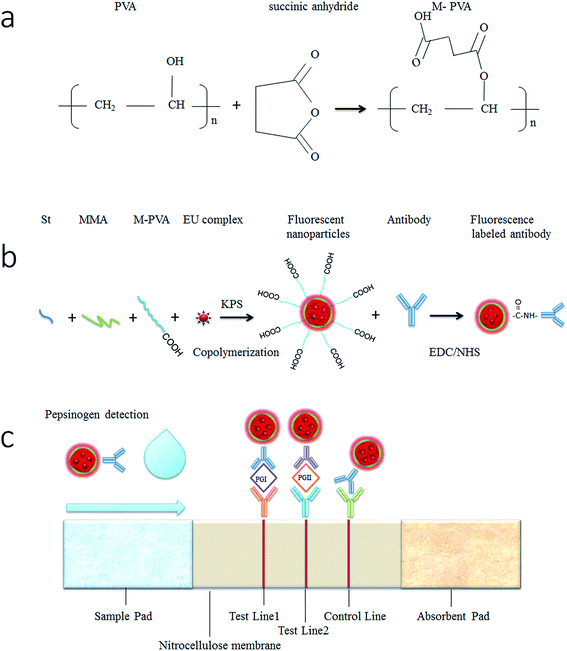
Carboxyl-functionalized PVA was prepared according to the method reported by Stipniece.17 Briefly, 7 g of PVA (MW = 9000–10![[thin space (1/6-em)]](https://www.rsc.org/images/entities/char_2009.gif) 000) was dissolved in 100 mL of DMF in flask at 120 °C using an oil bath. The solution was cooled to 60 °C and 3.2 g of succinic anhydride was added and reacted at the same temperature for 20 hours. The product was cooled to room temperature and poured into 300 mL of cooled ethyl acetate. The precipitate was washed with ethyl acetate twice and dissolved in 100 mL methanol. The solution was further precipitated by adding 200 mL diethyl ether and separated by centrifugation. The product was washed with diethyl ether. Diethyl ether was removed under reduced pressure and the succinate-modified PVA (M-PVA) was dried at 37 °C in oven.
000) was dissolved in 100 mL of DMF in flask at 120 °C using an oil bath. The solution was cooled to 60 °C and 3.2 g of succinic anhydride was added and reacted at the same temperature for 20 hours. The product was cooled to room temperature and poured into 300 mL of cooled ethyl acetate. The precipitate was washed with ethyl acetate twice and dissolved in 100 mL methanol. The solution was further precipitated by adding 200 mL diethyl ether and separated by centrifugation. The product was washed with diethyl ether. Diethyl ether was removed under reduced pressure and the succinate-modified PVA (M-PVA) was dried at 37 °C in oven.
2.4. Preparation of carboxyl-functionalized fluorescent nanoparticle
Eu(TTA)3Phen was dissolved in styrene (St) and methyl methacrylate (MMA) mixture at concentration of 1% using ultrasound. 0.1 g M-PVA and 0.1 g sodium bicarbonate was dissolved in 200 mL deionized water in a three-neck round-bottom flask to form an aqueous phase. The miniemulsion was made by adding the Eu(TTA)3Phen solution to the aqueous phase followed by 15 minutes of ultrasound treatment. The miniemulsion was deoxygenated under nitrogen for 30 min and heated to 80 °C with magnetical stirring. Then 8 mL of 1% potassium persulfate (KPS) in deionized water was added to the reaction mixture and reacted for 12 hours. The fluorescent nanoparticles were purified by filtration and centrifugation and then washed with deionized water containing 0.05% Tween-20.2.5. Conjugation of fluorescent nanoparticles with anti-pepsinogen antibodies
Anti-pepsinogen antibodies were conjugated to carboxyl-functionalized fluorescent nanoparticles via an amide bond. 5 mg of the fluorescent nanoparticles were mixed with 2 mM NHS and 5 mM EDC in MES buffer (pH 4.7) and incubated for 30 min at 37 °C. After washing and centrifugation, the fluorescent nanoparticles were dispersed in 50 mM borate buffer (pH 8.5). Then 0.1 mg of anti-pepsinogen I antibodies and anti-pepsinogen II antibodies were added to 2.5 mg fluorescent nanoparticles individually. The solution was incubated for 3 h at 37 °C. Residual nonspecific binding sites were blocked by BSA solution to a final concentration of 5% and incubated for 30 min at 37 °C. At last, the conjugates were purified by centrifugation. The product was washed 3 times and stored at 4 °C.2.6. Preparation of pepsinogen immunoassay strips
In order to prepare the pepsinogen immunoassay strips, anti-pepsinogen I coating antibodies and anti-pepsinogen II coating antibodies were dispensed onto the nitrocellulose membrane at 1.8 mg mL−1 as the test line 1 and test line 2 respectively. The goat anti-mouse IgG antibodies were dispensed onto the nitrocellulose membrane at 0.6 mg mL−1 as the control line. The conjugated fluorescent nanoparticles of anti-pepsinogen I antibodies and anti-pepsinogen II antibodies were mixed and dispensed at a ratio of 15 μL cm−1 onto the sample pad. The antibodies and conjugates were dispensed using the XYZ3050 dispensing system (BioDot Inc, Irvine, CA) and then dried at 37 °C for 4 h in a vacuum oven. The pepsinogen immunoassay strip was assembled in its standard configuration as shown in Fig. 1c.2.7. Detection of pepsinogen antigens by pepsinogen immunoassay strips
Human pepsinogen I protein and human pepsinogen II protein were used as standard analytes, which were purchased from Fitzgerald Company. PG I and PG II protein were diluted to 0, 0.5, 1, 5, 10, 50, 100, 500 ng mL−1 with newborn bovine serum respectively. Sixty microliters of the analytes were added to the end of sample pad of the pepsinogen immunoassay strips. The fluorescence signals of test line 1, test line 2 and control line were scanned by a fluorescence test strip scanning device at 15 min after the addition of analytes. Since the fluorescent nanoparticles conjugated PG I or PG II antibodies bound specifically to PG I or PG II protein and were captured at the test line 1 or test line 2 to form a sandwich complex, the fluorescence intensity was correlated with the sensitivity of the immunoassay.3. Results and discussion
3.1. Properties of Eu(TTA)3Phen
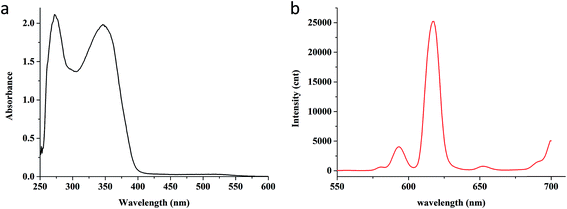
The Eu(TTA)3Phen complex were dissolved in DMSO, UV-visible absorption and fluorescence spectra was measured. As shown in Fig. 2a, the maximum absorption peak of Eu(TTA)3Phen in DMSO solution was at 272 nm and 346 nm which was attributed to the absorption of ligands TTA and Phen. In Fig. 2b, emission spectra of Eu(TTA)3Phen were detected by fluorescence spectrometer (Thermo scientific LUMINA). The maximum emission wavelength at 614 nm was in agreement with literature values for the 5D0 → 7F2 transition of Eu3+ ions.43.2. Properties of the fluorescent nanoparticles
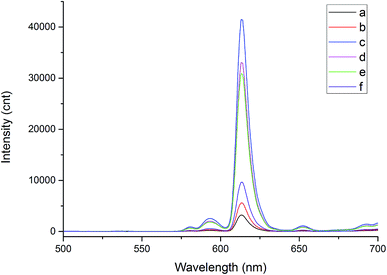
The copolymerization of Eu(TTA)3Phen doped styrene and methyl methacrylate fluorescent nanoparticles (EU–PS–PMMA) was prepared with different monomer ratio of St and MMA. The dynamic light scattering analysis and fluorescence intensity in Table 1 shows the monomer ratio of St and MMA has significant influence on the fluorescence intensity and particle size. Higher the St monomer ratio, larger the size of the nanoparticles, but weaker the fluorescence intensity. Higher the MMA monomer ratio, smaller the particle size but stronger the fluorescence intensity. When the ratio of St to MMA is 3 to 3, the fluorescence intensity is maximum. Further alteration in the ratio results in a decrease in the fluorescence intensity. Fig. 3 shows the fluorescence spectra for different monomer ratios. The coordination of MMA and Eu3+ enhanced the fluorescence intensity while the addition of St reduced the concentration quenching Eu3+ ions.18| Sample | St monomer (mL) | MMA monomer (mL) | Particle diameter (nm) | PDI | Fluorescence intensity at 614 nm (cnt) |
|---|---|---|---|---|---|
| a | 6 | 0 | 190.2 | 0.159 | 3242.10 |
| b | 4 | 2 | 172.7 | 0.013 | 5612.92 |
| c | 3 | 3 | 128.3 | 0.009 | 41![[thin space (1/6-em)]](https://www.rsc.org/images/entities/char_2009.gif) 461.18 461.18 |
| d | 2 | 4 | 114.9 | 0.005 | 33![[thin space (1/6-em)]](https://www.rsc.org/images/entities/char_2009.gif) 046.17 046.17 |
| e | 1 | 5 | 129.7 | 0.005 | 30![[thin space (1/6-em)]](https://www.rsc.org/images/entities/char_2009.gif) 916.35 916.35 |
| f | 0 | 6 | 151.4 | 0.003 | 9650.97 |
In Fig. 4a, FT-IR spectroscopy shows the characteristic frequencies of copolymerization of styrene and methyl methacrylate. The morphology and size of EU–PS–PMMA nanoparticles were characterized by TEM, which indicates that particles are uniform and nearly monodisperse.
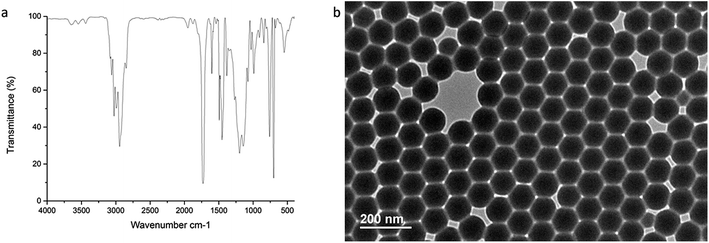 | ||
| Fig. 4 FT-IR spectroscopy and TEM images of EU–PS–PMMA nanoparticles with 3 to 3 ratio of monomer St and MMA. | ||
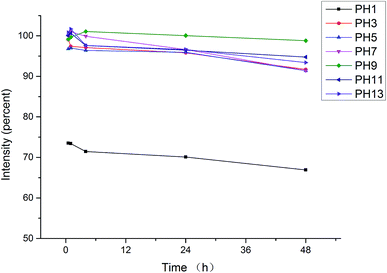
The stability of fluorescence intensity of EU–PS–PMMA nanoparticles in acidic-to-alkaline pH environment was measured. EU–PS–PMMA nanoparticles were dispersed in pH 1–13 water (adjusted by HCl or NaOH), and the fluorescence intensity was detected by fluorescence spectrometry at different time and relative intensity was calculated. Fig. 5 shows that at pH 3–13, the fluorescence intensity changed less than ten percent in 48 hours which suggest that EU–PS–PMMA nanoparticles were stable especially at weak alkaline environment. At pH 1, EU–PS–PMMA nanoparticles was aggregated and fluorescence intensity was declined by 27% suddenly and decreased less than ten percent with increasing time. As we known Eu(TTA)3Phen was unstable in acidic and alkaline environments therefore Eu(TTA)3Phen was coated inside the nanoparticles through self-assembly with St and MMA.
3.3. Detection of pepsinogen immunoassay strips
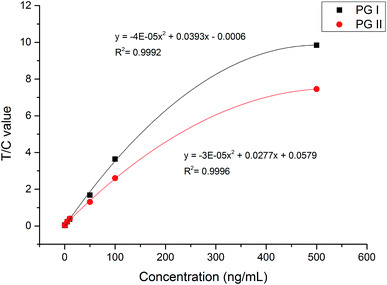
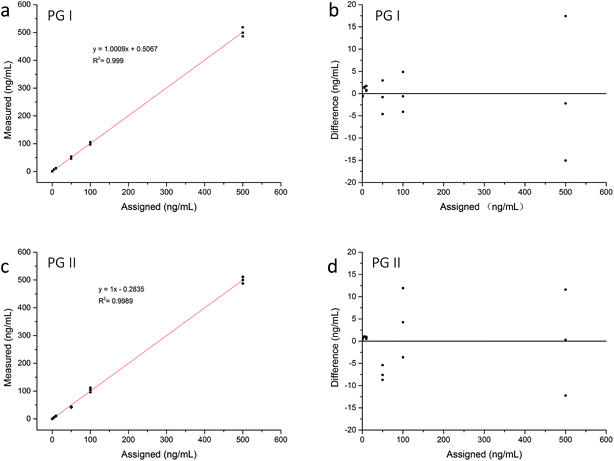
We used EU–PS–PMMA fluorescent nanoparticles with monomer ratio at 3 to 3 as fluorescent probes of pepsinogen immunoassay strips. The highest fluorescence intensity and carboxyl-functionalized PVA make the labeled probes highly efficient. We detected PG I and PG II protein diluted at 0, 0.5, 1, 5, 10, 50, 100, 500 ng mL−1 with newborn bovine serum respectively. The fluorescence intensity of pepsinogen immunoassay strip was scanned using a fluorescence test strip scanner. The signals of test line 1, test line 2 and control line were recorded and a relative intensity of T1/C and T2/C was calculated. When the high concentration samples tested, the conjugated fluorescent nanoparticles bound to the test line is more while bound to the control line is less. And the ratio of T/C concentration difference is greater that of test line. As show in Fig. 6, a standard curve was constructed by plotting T1/C, T2/C relative intensity and PG I, PG II concentration. It shows that the mathematical relationship between T1/C relative intensity and PG I concentration has a correlation coefficient of 0.9992 and the mathematical relationship between T2/C relative intensity and PG II concentration has a correlation coefficient of 0.9996. To evaluate the limit of detection (LOD) of pepsinogen immunoassay strips, a cutoff value, which is the average of the T/C relative intensity plus three times of its standard deviations, was calculated by detecting fifty blank samples. The cutoff value for both PG I and PG II was 0.031. PG I and PG II concentration of 0.5 ng mL−1 or higher could be detected by pepsinogen immunoassay strips, thus the LOD was 0.5 ng mL−1 for standard analytes detection. Fig. 7 shows the linear correlation of both measurements resulted in a correlation coefficient 0.999 of PG I, and 0.9989 of PG II. The dynamic concentration range of PG I and PG II was from 0.5 to 500 ng mL−1.The reproducibility of this pepsinogen immunoassay strips was tested by detecting 20 replicates of the analytes added with various concentrations (1, 10 and 100 ng mL−1). PG I and PG II protein were added to human serum with matrix concentration of PG I at 98.2 ng mL−1 and PG II at 21.8 ng mL−1 respectively. The relative standard deviations (RSD) and recovery rates were later calculated accordingly. Table 2 shows the RSD results and recovery rates. For high concentration samples, the RSD were less than 10% and the recovery rates were within 93.0–108.2%. For low concentration samples, the RSD were higher than 10% and the recovery rates were relatively low. This was because the human serum contains a certain concentration of PG I and PG II protein, when adding low concentration samples, the detection difference was larger. Generally, the pepsinogen immunoassay strips had good reproducibility and the test results were accurate and reliable.
| Samples | Added concentrations (ng mL−1) | RSD/% n = 20 | Test value (x ± SD) ng mL−1 | Recovery rate% |
|---|---|---|---|---|
| PG I | 1 | 13.7 | 0.64 ± 0.09 | 63.7 |
| 10 | 4.8 | 9.3 ± 0.45 | 93.0 | |
| 100 | 6.4 | 98.81 ± 6.35 | 98.8 | |
| PG II | 1 | 14.6 | 0.79 ± 0.12 | 79.2 |
| 10 | 9.1 | 10.82 ± 0.99 | 108.2 | |
| 100 | 6.1 | 105.81 ± 6.45 | 105.8 |
Quantitative detection of serum pepsinogen have significant value in screening for gastric cancer and precancerous lesion, and other gastric diseases.19–22 As preliminary screening method, pepsinogen immunoassay strips can rapidly analyze the sample within 15 min. Compared with chemiluminescent immunoassays, the detection limits are basically the same but the relative standard deviations and range of % differences in measured results are higher than chemiluminescent method.22 The accuracy of solid phase reaction is lower than that of liquid phase reaction, but its rapid and simple operation can be used as a supplement to the precise and quantitative detection.
4. Conclusions
High fluorescence intensity EU–PS–PMMA nanoparticles were prepared via self-assembly. The monomer ratio of St and MMA has significant influence on the fluorescence intensity and particle size. EU–PS–PMMA fluorescent nanoparticles based pepsinogen immunoassay strips can rapidly analyze the serum sample through one step and the results were objectively analyzed within 15 min. The LOD of this pepsinogen immunoassay strips for PG I and PG II standard analytes was 0.5 ng mL−1. The dynamic concentration range of PG I and PG II was from 0.5 to 500 ng mL−1. The reproducibility and recovery tests show that the quantitative results were accurate. The high accuracy and rate for the determination of serum PG I and PG II suggest that this can be used as a supplement method in clinical applications.Conflict of interest
The authors declare that there is no conflict of interest regarding the publication of this paper.Acknowledgements
This work was supported by the following sources: The National High Technology Research and Development Program of China (863 Program, No. 2013AA032204). The Science and Technology Research and Development Capital Projects of Shenzhen (Research and development of immunofluorescence diagnostic reagents for early screening of gastric, NO. ZDSYS20140509172959971).References
- L. Huang, L. Cheng, H. Yu, J. Zhang, L. Zhou, J. Sun, H. Zhong, X. Li, Y. Tian, Y. Zheng, T. Yu, C. Li, H. Zhong, W. Liu, L. Zhang, J. Wang and B. Chen, Opt. Commun., 2012, 285, 1476–1480 CrossRef CAS.
- R. J. Wiglusz, A. Bednarkiewicz and W. Strek, J. Rare Earths, 2011, 29, 1111–1116 CrossRef CAS.
- J. L. Zhang, B. W. Chen, X. Luo and K. Du, Chin. Chem. Lett., 2012, 23, 945–948 CrossRef CAS.
- J. Guan, B. Chen, Y. Sun, H. Liang and Q. Zhang, J. Non-Cryst. Solids, 2005, 351, 849–855 CrossRef CAS.
- Q. Guanming, Y. Changhao, G. Chunfang, W. Wenwuan and Z. Ming, J. Rare Earthss, 2007, 25, 5–8 CrossRef.
- J. Garcia-Torres, P. Bosch-Jimenez, E. Torralba-Calleja, M. Kennedy, H. Ahmed, J. Doran, D. Gutierrez-Tauste, L. Bautista and M. Della Pirriera, J. Photochem. Photobiol., A, 2014, 283, 8–16 CrossRef CAS.
- J. W. Lee and D. K. Kim, Colloids Surf., A, 2016, 511, 162–171 CrossRef CAS.
- I. M. Samloff, K. Varis, T. Ihamaki, M. Siurala and J. I. Rotter, Gastroenterology, 1982, 83, 204–209 CAS.
- K. Miki, M. M. Morita, R. Hoshina, E. Kanda and Y. Urita, Am. J. Gastroenterol., 2003, 98, 735–739 CrossRef PubMed.
- M. Asaka, T. Kimura, M. Kudo, H. Takeda, S. Mitani, T. Miyazaki, K. Miki and D. Y. Graham, Gastroenterology, 1992, 102, 760–766 CrossRef CAS.
- W. Hmitsushima, Gut, 2005, 54, 764–768 CrossRef PubMed.
- M. Kekki, I. M. Samloff, K. Varis and T. Ihamäki, Scand. J. Gastroenterol., Suppl., 2009, 186, 109–116 Search PubMed.
- G. Pals, V. Räsänen, S. G. Meuwissen, R. R. Frants, P. J. Kostense and A. W. Eriksson, Scand. J. Clin. Lab. Invest., 2010, 47, 29–33 CrossRef.
- B. Huang, H. Xiao, X. Zhang, L. Zhu, H. Liu and J. Jin, Anal. Chim. Acta, 2006, 571, 74–78 CrossRef CAS PubMed.
- B. Ngom, Y. Guo, X. Wang and D. Bi, Anal. Bioanal. Chem., 2010, 397, 1113–1135 CrossRef CAS PubMed.
- G. P. Zhang, X. N. Wang, J. F. Yang, Y. Y. Yang, G. X. Xing, Q. M. Li, D. Zhao, S. J. Chai and J. Q. Guo, J. Immunol. Methods, 2006, 312, 27–33 CrossRef CAS PubMed.
- L. Stipniece, K. Salma-Ancane, V. Rjabovs, I. Juhnevica, M. Turks, I. Narkevica and L. Berzina-Cimdina, J. Cryst. Growth, 2016, 444, 14–20 CrossRef CAS.
- M. P. Dandekar, S. B. Kondawar, S. G. Itankar and D. V. Nandanwar, Procedia Mater. Sci., 2015, 10, 580–587 CrossRef CAS.
- K. Miki, M. Ichinose, K. B. Ishikawa, N. Yahagi, M. Matsushima, N. Kakei, S. Tsukada, M. Kido, S. Ishihama and Y. Shimizu, Cancer Sci., 1993, 84, 1086–1090 CrossRef CAS PubMed.
- C. Mukoubayashi, K. Yanaoka, H. Ohata, K. Arii, H. Tamai, M. Oka and M. Ichinose, Intern. Med., 2007, 46, 261–266 CrossRef PubMed.
- R. Lombaviana, M. Dinisribeiro, F. Fonseca, A. S. Vieira, M. J. Bento and H. Lombaviana, Eur. J. Gastroenterol. Hepatol., 2012, 24, 37–41 CrossRef PubMed.
- E. J. Cho, H. K. Kim, T. D. Jeong, D. H. Ko, S. E. Bae, J. S. Lee, W. Lee, J. W. Choe, S. Chun and H. Y. Jung, Clin. Chim. Acta, 2016, 452, 149–154 CrossRef CAS PubMed.
Footnote |
| † These authors contributed equally to this paper. |
| This journal is © The Royal Society of Chemistry 2017 |

