
 Open Access Article
 This Open Access Article is licensed under a Creative Commons Attribution-Non Commercial 3.0 Unported Licence
Preparation and tribological properties of graphene oxide/nano-MoS2 hybrid as multidimensional assembly used in the polyimide nanocomposites†
Yuanshi Xin ,
Tongsheng Li*,
Dafei Gong,
Fanglin Xu and
Mingming Wang
,
Tongsheng Li*,
Dafei Gong,
Fanglin Xu and
Mingming Wang
State Key Laboratory of Molecular Engineering of Polymers, Department of Macromolecular Science, Fudan University, Shanghai, 200433, P. R. China. E-mail: lits@fudan.edu.cn; Fax: +86-021-51630401; Tel: +86-021-51630401
First published on 20th January 2017
Abstract
A three-step strategy was employed to prepare a self-lubricating and anti-wear graphene oxide/nano-MoS2 (GO/nano-MoS2, abbreviated GMS) hybrid by chemical compounding as a novel multidimensional assembly. This development aims to overcome the high friction coefficient of GO/polymer composites and to explore the variations in the tribological properties stemming from the different nanoparticles immobilized on the GO surface. The as-prepared GMS was incorporated into a polyimide (PI) matrix to yield GMS/PI composites by in situ polymerization. The mechanical, thermodynamic, surface, and tribological properties of the GMS/PI composites were investigated, and the synergistic effects of the abovementioned properties between nano-MoS2 and GO were discussed in detail. A homogeneous dispersion of GMS, a suppressive and protective effect of graphene sheets, a rolling friction effect of the detached nano-MoS2 particles, and a transfer film composed of MoS2 were achieved herein, contributing to the enhanced tribological properties. The differences in the enhancement effects of nanohybrids can be mainly attributed to two aspects: the intrinsic characteristics of the assembled nanoparticles and the combinational structure of the multidimensional assemblies.
1. Introduction
Along with tremendous expansion of the application fields of polymeric materials, demands for high-performance polymer composites have experienced an intense surge.1–3 Especially, self-lubrication and wear-resistance properties have received increasing attention, considering the importance of energy conservation, environmental cleanliness, and the useful lifespan of products.4,5 Filling with reinforcing additives is widely used to improve the tribological properties of the polymer composites. However, the incorporation of conventional macrofillers exhibits some deficiencies, such as the requirement for a high addition content and the detriment of other properties, limiting the application of the resulting composites in micromodule equipment and extreme environments.6–8Compared to macrofillers, nanofillers possess a high surface-to-volume ratio, a low effective threshold, and other unique properties related to their nanometer dimensions, which are conducive to optimizing the performance of polymer composites.3,9 In the field of tribological polymeric materials, the advantages of nanofillers have been widely studied. For example, the addition of nanosilica enhanced the glass transition temperature (Tg) and reduced the coefficient of thermal expansion,10 whereas the incorporation of multiwalled carbon nanotubes enhanced the tensile strength and modulus.11 Both of the abovementioned materials improved the tribological properties of the corresponding composites. More significantly, the addition of modified graphene grafted with small molecule segments yielded a 20-fold increase in the wear life of PI nanocomposites.12
Although nanofillers show great superiority in improving composite properties, some significant obstacles still exist in unearthing their potential performance. Because of a tendency to aggregate and incompatibility with polymer matrices, it is difficult to obtain a homogeneous dispersion of nanofillers and a strong interfacial interaction at the filler–matrix interface.13–15 For instance, previous tribological studies indicate that the incorporation of unmodified graphene oxide (GO) into a polymer matrix improved the tribological properties far less than anticipated.16–19 The modification of nanoparticles consequently became the crucial procedure for utilizing them as tribological additives,20,21 which can be seen from the following examples. A 5 wt% addition of modified nano-SiO2 into a PI composite resulted in a two-fold decrease in the friction coefficient compared to unmodified nano-SiO2.22 Likewise, the wear rate of a 1 wt% modified GO/PI composite exhibited an 88% reduction,12 while the corresponding unmodified-GO/PI composite only showed a 14% reduction.18
The incapacity to give consideration to both lubricity and wear resistance is another problem.23,24 An effective strategy to overcome this deficiency is combining various nanoparticles with different enhancement effects into a nanohybrid, and this has been widely undertaken in the fields of photoelectric and energy materials.25–27 Recently, some attempts to introduce nanohybrids into the field of tribology have been carried out, and synergistic effects between nanoparticles have been reported.28–30 In our previous work,31 a superior self-lubricating and anti-wear GO/nano-PTFE (abbreviated GNF) hybrid was prepared and a nearly 60% reduction in the friction coefficient and a reduction of two orders of magnitude in the wear rate were obtained in a PI composite with only 1 wt% addition. Hong et al.32 prepared core–shell structured SiO2@GO hybrid fillers, which showed a remarkable tribological enhancement effect. Chen et al.33 reported an improved tribological performance compared to neat bismaleimide (BMI) resin with a 0.6 wt% addition of an amino-modified reduced graphene oxide/MoS2 interlayer hybrid.
In spite of achievements in the manufacture of tribological nanohybrids, the mechanisms of synergistic effects still require further investigation.34,35 Considering the unique combinational structures and the different sizes and shapes of the precursor nanoparticles, the above-mentioned nanohybrids can be regarded as multidimensional assemblies.36,37 During the friction process, the separation of some immobilized or compounded nanoparticles occurs on the worn surface, due to the typically increased temperature and extremely strong shear force.38,39 Moreover, these multidimensional assemblies possess diverse compatibilities with the matrices because of differences in surface chemistry and structural morphology, which have significant influence on the mechanical, thermodynamic, and tribological properties of the corresponding nanocomposites.40,41 As a result, a comparison of the enhancement effects between multidimensional nanohybrids and precursor nanoparticles is necessary, and deeper understanding is required of the influence of selected ingredients.
In our previous work,31 the synergistic effect of the tribological properties of GNF was revealed. However, the feasibility of the fabrication process of multidimensional assemblies should be examined and the factors influencing the improvement remain to be investigated. Herein, we designed and prepared a graphene oxide/nano-MoS2 (GO/nano-MoS2, abbreviated GMS) hybrid, as nano-MoS2 has a similar size and tribological function to nano-PTFE, but has a different shape and chemical nature. For comparison, modified GO, modified nano-MoS2, and GMS were incorporated into a PI matrix to examine the enhancement effect. The mechanical, thermodynamic, surface, and tribological properties were investigated in detail. Furthermore, the differences in the tribological performance and mechanism of these two multidimensional assemblies (GMS and GNF) were discussed. The results show that a synergistic effect also exists in the GMS nanohybrid, and the improvement in the tribological properties can be primarily attributed to two aspects: the intrinsic characteristics of the immobilized nanoparticles and the combinational structure of the multidimensional nanohybrids.
2. Experimental
2.1 Materials
Expandable graphite powders (99.5%, Yingtai Co., Yangtai, China), nano-MoS2 (99.9%, particle size: 50 nm, Shanghai Zaibang Chemical Industry Co., Ltd., Shanghai, China), and bisphenol-A dianhydride (BPADA, 99%, Shanghai Research Institute of Synthetic Resins, Shanghai, China) were selected and supplied. In addition, 1-ethyl-3-(3-dimethylaminopropyl)carbodiimide hydrochloride (EDC·HCl) and 1-hydroxybenzotriazole (HOBT) were acquired (98.5% and 99%, respectively, Aladdin Reagent Co., Shanghai, China). Sodium dodecylbenzene sulfonate (SDBS), 4,4′-oxydianiline (ODA), maleic anhydride (MA), triethylamine (TEA), and N,N-dimethylformamide (DMF) were provided (99%, 98%, 99.5%, 99.5% and 99.5%, respectively, Sinopharm Group Chemical Reagent Co., Ltd., Shanghai, China).2.2 Preparation of GMS
GO was prepared from expandable graphite powders using a modified Hummers method, as reported elsewhere.18,42To modify nano-MoS2, 2 g nano-MoS2 was dispersed in 100 ml DMF with sonication at room temperature for 1 h. SDBS (2 g) and MA (10 g) were added to the above suspension, and the mixture was mechanically stirred at 90 °C for 12 h, and then filtrated with a 0.2 μm Teflon filter film. To remove unreacted MA, the collected powders were washed with DMF. The resulting silvery solids were vacuum-dried overnight at 70 °C, yielding nano-MoS2–MA.
As shown in Fig. 1, the procedure for chemical combination between GO and nano-MoS2 is as follows: 0.1 g GO and 5 g ODA were dispersed in 200 ml DMF with sonication. The mixture was mechanically stirred at 80 °C for 12 h, and then filtrated with a 0.2 μm Teflon filter film. The collected powders were rinsed with DMF, and the resulting black solids were vacuum-dried overnight at 70 °C, yielding GO–ODA. The mixture of 0.05 g GO–ODA and 0.5 g nano-MoS2–MA was re-dispersed in 200 ml anhydrous DMF with sonication. EDC·HCl (0.65 g), HOBT (0.46 g), and TEA (5 ml) were added to the above suspension, and the mixture was vigorously stirred at 40 °C for 24 h under nitrogen. Powders obtained from the matrix by vacuum filtration were rinsed twice with excess DMF and deionized water. Finally, the solids were dried at 70 °C under vacuum overnight, yielding GMS (selected reaction molar ratio of GO–ODA![[thin space (1/6-em)]](https://www.rsc.org/images/entities/char_2009.gif) :nano-MoS2–MA = 1:10, according to our previous work31).
:nano-MoS2–MA = 1:10, according to our previous work31).
 | ||
| Fig. 1 Covalent combination between GO and nano-MoS2, including chemical modifications of (a) nano-MoS2 with MA, (b) GO with ODA, and (c) preparation of GMS by amidation reaction between GO–ODA and nano-MoS2–MA. | ||
2.3 Fabrication of GMS/PI composites
To investigate the properties of GMS, GMS/PI specimens were prepared with different GMS loadings. In a typical operation, 40 mg GMS was re-dispersed in 32 g DMF with sonication for 2 h, and then 2.19 g ODA and 5.81 g BPADA were added to the above suspension. The mixture was stirred vigorously at room temperature for 24 h under nitrogen, yielding GMS/polyamide acid (GMS/PAA) solution. The obtained GMS/PAA solutions were stored in a freezer until use. The film specimens and coating specimens were prepared by casting GMS/PAA solutions onto glass substrates or stainless steel plates, respectively.12 The specimens were then placed in a vacuum oven at room temperature to remove air bubbles and heated at 70 °C for 2 h at 100, 150, 200, and 300 °C each for 1 h to completely remove volatile components and achieve thermal imidization. The thickness of films and coatings was about 50 μm. GMS/PI specimens (0.1GMS/PI, 0.5GMS/PI, and 1GMS/PI) containing 0.1 wt%, 0.5 wt%, and 1 wt% of GMS were prepared by the above-mentioned experimental steps. For comparison, virgin PI, 0.5GO/PI (PI composite containing 0.5 wt% of GO–ODA), and 0.5MoS2/PI (PI composite containing 0.5 wt% of nano-MoS2–MA) specimens were fabricated in the same manner.2.4 Friction and wear tests
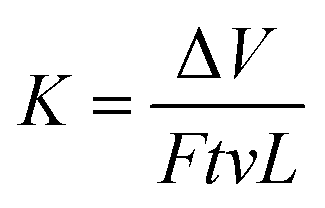
Tribological tests were conducted on a reciprocating friction and wear testing machine (HS-2M, Lanzhou Zhongke Kaihua Technology Development Co., Ltd.). A contact schematic diagram of the frictional couple is included (Fig. S1†). The roughness of the stainless steel ball used was 20 nm and the diameter was 6 cm. The test was performed at temperature: 23 ± 2 °C, relative humidity: 40%, reciprocating frequency: 10 Hz, and applied load: 6 N. The length of stroke in one cycle is 5 mm. Each friction and wear test was carried out for 10 min. The friction coefficient was obtained automatically using a computer. The depth of the wear scar was measured with a stylus surface profiler (Dektak 150, Veeco Instruments Inc.), and the wear volume (ΔV, mm3) of the specimen was calculated from the following equation:
 | (1) |
 | (2) |
2.5 Characterization
Fourier transform infrared (FTIR) spectra were recorded using a Nicolet Nexus 470 spectrometer. Thermogravimetric analysis (TGA) was carried out with a Mettler Toledo Thermogravimetric Analyzer under nitrogen flow at a heating rate of 20 °C min−1. Raman spectra were collected on a HORIBA Jobin Yvon XploRA spectrometer with 638 nm laser excitation. X-ray diffraction (XRD) patterns were acquired with a Panalytical X'pert diffractometer using Cu Kα radiation (λ = 0.154 nm) at an accelerating voltage of 40 kV and a current of 40 mA. Dynamic mechanical analysis (DMA) was performed on a Mettler Toledo DMA/SDTA861e analyzer. Each specimen was tested under a tension mode from 100 to 300 °C at a heating rate of 5 °C min−1 and a frequency of 1 Hz, with the vibration amplitude set to 120 μm, and a static compressive stress of 4 N. The mechanical properties were evaluated by using a universal testing machine (CMT-4102, Sans Co., China) for dumbbell-type specimens, according to ISO 527-3:1995 standard. Data reported here represent the average of five tests. Field emission scanning electron microscopy (FESEM) images were obtained with a Zeiss Ultra 55 FESEM equipped with an Oxford Instruments X-MAX 50 EDS detector to observe the morphology of GMS and the transfer film. Nanoindentation tests were conducted with an Ultra Nanoindentation Tester (CSM Instruments, Switzerland), using a Berkovich diamond indenter. After making contact with the surface, the indenter was pressed into friction specimens with a constant strain rate of 0.05 s−1 until a depth of 2000 nm was reached, held at the maximum load for 50 s, and then withdrawn from the surface with the same rate as for loading. At least five indents were performed on each specimen, and the average value was reported. Microhardness was calculated using the Oliver and Pharr method.44 Scanning electron microscopy (SEM) images of worn surfaces and wear debris were observed on a Tescan 5136 MM SEM. Atomic force microscopy (AFM) graphs and the degree of roughness were obtained using a Bruker Multimode 8 Scanning Probe Microscope in tapping mode.3. Results and discussion
3.1 Preparation and characterization of GMS
Fig. 1 shows a schematic of the fabrication process of GMS, which includes three steps: (a) chemical modification of nano-MoS2 with MA, (b) chemical modification of GO with ODA, and (c) preparation of GMS by amidation reaction between GO–ODA and nano-MoS2–MA.Evidence for the chemical modification of nano-MoS2 and GO was provided by FTIR spectra, as shown in Fig. 2. Regarding the reaction between anhydride groups of MA and hydroxyl groups on the surface of nano-MoS2,45 a distinct absorption at 1206 cm−1 (C–O stretching vibration from ester group) arises in the spectrum of the as-prepared nano-MoS2–MA. Meanwhile, the GO–ODA spectrum shows new bands at 566 cm−1 (N–H out-of-plane bending vibration from amino group), 1072 cm−1 (C–O–C stretching vibration from ether linkage), and 1150 cm−1 (C–N bending vibration), indicating that ODA has been grafted onto the GO surface.12
 | ||
| Fig. 2 (a) FTIR spectra of nano-MoS2 and nano-MoS2–MA. (b) FTIR spectra of GO, GO–ODA, and GMS. (c) Raman spectra, and (d) DTG curves of nano-MoS2–MA, GO–ODA, and GMS. | ||
Compared to GO–ODA and nano-MoS2–MA, absorptions at 1074 cm−1 (C–O–C stretching vibration from ether linkage), 1152 cm−1 (C–N bending vibration), and 1226 cm−1 (C–O stretching vibration from ester group), and another two at 2925 and 2830 cm−1 (C–H stretching vibration from GO–ODA) appear in the spectrum of GMS (Fig. 2b). In addition, the band at 566 cm−1 (N–H out-of-plane bending vibration from amino group) disappears, while the bands at 1152 cm−1 (C–N bending vibration) and 1511 cm−1 (N–H scissoring vibration) intensify. These variations indicate that the amidation reaction between nano-MoS2–MA and GO–ODA is completed, and nano-MoS2–MA has been covalently immobilized on the GMS surface.
Fig. 2c shows the Raman spectra for nano-MoS2–MA, GO–ODA, and GMS. The characteristic peak at 404 cm−1 is ascribed to the A1g mode of MoS2, which involves the out-of-layer symmetric displacement of S atoms along the c axis.46 This peak appears in the spectra of both nano-MoS2–MA and GMS. Moreover, two other Raman peaks at 1350 cm−1 and 1585 cm−1 were detected in the spectra of both GO–ODA and GMS, which conform well to the D and G bands of graphene. These results further confirmed that GMS hybrids were prepared successfully.
Thermogravimetric analysis (TGA) was used to measure the thermal stability of nanoparticles, as shown in Fig. 2d. No obvious loss peak appears under 100 °C in the derivative TG (DTG) plot, indicating the absence of solvent or trapped water. Three major mass-loss peaks of GMS can be observed: the peaks at approximately 325 °C and 450 °C result from the decomposition of GO–ODA, while the third peak at approximately 730 °C results from the desulfurization of nano-MoS2–MA. As revealed in previous work,31 shifts in the peak positions also verified the immobilization of nano-MoS2–MA onto the GO surface. The pyrolysis rate of as-prepared GMS was apparently depressed compared with that of GO–ODA, indicating that the anchored nano-MoS2–MA can serve as an effective obstacle to resist the decomposition of functionalized groups on GMS.47
Detailed structures of nanoparticles were manifested in XRD patterns, as presented (Fig. S2†). The XRD pattern for GO exhibits an obvious diffraction peak at 10.9°, corresponding to an interlayer spacing of 0.82 nm. After modification with ODA, the XRD trace of GO–ODA shows no notable peak, indicating that the stacking of GO–ODA is disordered.48 In addition, a strong diffraction peak as the (002) reflection of MoS2 at 14.8° appears in the traces of nano-MoS2, nano-MoS2–MA, and GMS, corresponding to a d-spacing of 0.60 nm. Using the (103) reflection of MoS2 at 39.9° as reference, both nano-MoS2–MA and GMS show much weaker peaks at 14.8° than nano-MoS2, suggesting that the particle size and number of layers along the c axis diminished after modification and immobilization.49
Achieving uniform dispersion of nanoparticles and avoiding irreversible agglomeration plays an important role in realizing the enhancement effect.50 To illustrate the morphology and granularity of as-prepared additives, FESEM images of nano-MoS2 and GMS are shown in Fig. 3 and 4. Considering the initial size of nano-MoS2, some minor aggregation can be observed in the bulk according to Fig. 3a. After immobilization onto the GO surface, nano-MoS2–MA particles are relatively homogeneously distributed on the hybrid surface with a smaller particle size compared to the bulk, as shown in Fig. 3b. The reduction of obvious agglomerations of nano-MoS2 can help to produce a homogeneous dispersion in the matrix and enhance the synergistic effect of nano-MoS2 and GO.31
 | ||
| Fig. 3 FESEM images of (a) nano-MoS2 (magnification: 5k) and (b) GMS (magnification: 10k). | ||
 | ||
| Fig. 4 (a) FESEM image (the inset shows EDS scanning area) and EDS images of (b) C, (c) Mo, (d) O, and (e) S elemental distributions in GMS (magnification: 10k). | ||
Further analysis of the chemical composition of GMS was conducted using energy dispersive spectrometry (EDS). The distributions of C, Mo, O, and S in GMS are shown in Fig. 4b–e. In comparison with the FESEM image of the EDS scanning area (Fig. 4a), the distributions of Mo and S matched well with the locations of nano-MoS2–MA, indicating that the particles immobilized onto the GMS surface were indeed modified nano-MoS2 grains, not chippings from GO sheets.
3.2 Reinforcing effect of GMS
The tribological properties of nanocomposites depend strongly on the reinforcing effect of additives.51,52 Relationships between mechanical properties and different additives are illustrated in Fig. 5. The GMS/PI composites possess increased tensile strength and elongation at break compared to virgin PI. The mechanical properties exhibit an upward trend with increasing GMS loading, while the increment for the 1GMS/PI specimen is negligibly small compared to that for the 0.5GMS/PI specimen. This suggests that the added GMS is in excess when it reaches 1 wt%, which tallies with correlational studies.12,31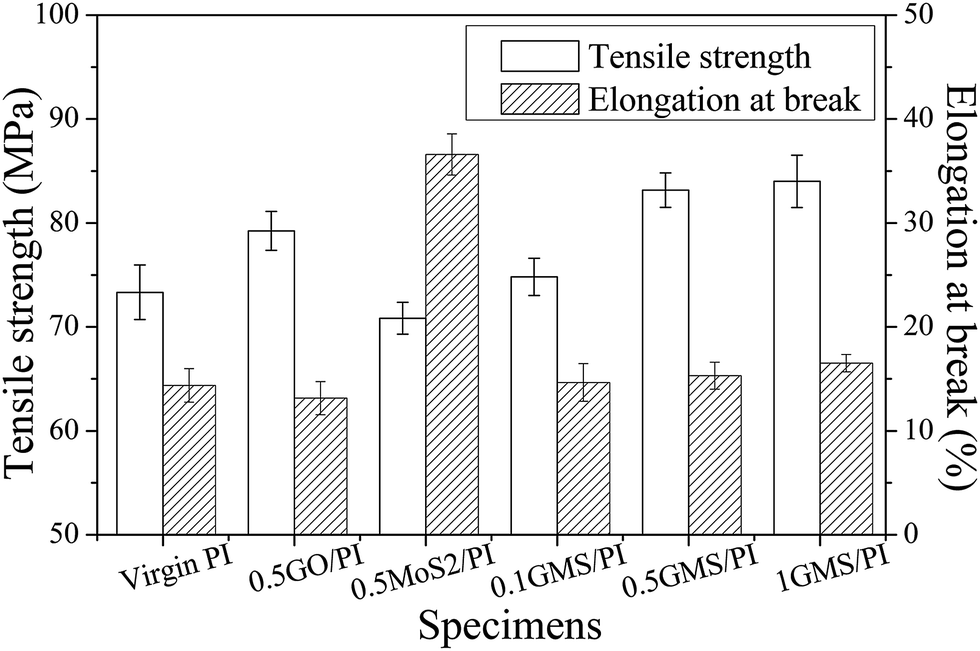 | ||
| Fig. 5 Tensile strength and elongation at break of virgin PI, 0.5GO/PI, 0.5MoS2/PI, 0.1GMS/PI, 0.5GMS/PI, and 1GMS/PI specimens. | ||
Elongation at break is an important parameter affecting tribological behavior. However, unlike previous reports that mentioned the elongation at break of graphene-based nanocomposites lowering gradually with increasing additive loading,53,54 the GMS hybrid shows a different inclination owing to the incorporation of nano-MoS2. As shown in Fig. 5, the elongation at break of the 0.5MoS2/PI specimen reflects an increase by a factor of 2.5, from 14.4% to 36.6%, compared with virgin PI. Moreover, the enhancing effect with respect to toughness is much better than in a previous study, where the addition of 2 wt% of MoS2 resulted in a 2-fold increase in elongation at break,55 indicating that the modification of nano-MoS2 with MA improved the compatibility and interfacial adhesion. In conclusion, GMS/PI composites possess better elongation at break than GO/PI specimens and better tensile strength than MoS2/PI specimens, demonstrating their synergistic effects.
To analyze the reinforcing mechanism of GMS, FESEM images of nanocomposite surfaces with different additives were obtained to evaluate the dispersion and compatibility. As shown in Fig. 6, GMS particles were distributed homogeneously and separately in the 0.5GMS/PI specimen (Fig. 6b), while GO–ODA sheets showed a tendency to stack, causing some defects on the surface of the 0.5GO/PI specimen (Fig. 6c). The nano-MoS2–MA particles gather into aggregates with a similar size to the GMS particles (Fig. 6d). These results manifest that the incorporation of GO–ODA and nano-MoS2–MA restrained the aggregation tendency of the two nanoparticles. In spite of some degree of restacking in the 0.5GO/PI specimen or assembly in the 0.5MoS2/PI specimen, all nanoparticles show an approximate monodispersity with an absence of obvious cracks. On the other hand, the GMS/PI, GO/PI, and MoS2/PI films (except the 1GMS/PI specimen) show a uniform appearance without significant aggregation according to visual observation (Fig. S3†). As discussed in our previous work,31 the modified surface of GMS affords a platform for the construction of an interfacial layer, which prevents restacking of graphene nanosheets and ensures chemical compatibility with the matrix.
 | ||
| Fig. 6 FESEM images showing additive dispersion in (a) virgin PI, (b) 0.5GMS/PI, (c) 0.5GO/PI, and (d) 0.5MoS2/PI specimens (magnification: 50k). | ||
Since thermo-mechanical behavior is especially critical for wear-resistant materials, DMA experiments were undertaken to further explore the reinforcing mechanism and the nature of the interface. The storage modulus of virgin PI and all the GMS/PI nanocomposites was plotted as a function of temperature (Fig. 7a), showing that the storage modulus increases with increasing GMS content below 180 °C. The storage modulus of the 0.5GMS/PI specimens is 5–10% greater than that of neat PI at 100–180 °C, and more significantly, 2-fold greater at 200 °C, because of the uniform dispersion and strong interfacial adhesion,12 as well as the high modulus (0.25 TPa) and intrinsic strength (125 GPa) of graphene.56
 | ||
| Fig. 7 (a) Storage modulus of virgin PI, 0.1GMS/PI, 0.5GMS/PI, and 1GMS/PI specimens as a function of temperature. (b) tanδ and storage modulus at 150 °C of virgin PI, 0.5GO/PI, 0.5MoS2/PI, 0.1GMS/PI, 0.5GMS/PI, and 1GMS/PI specimens. | ||
The tanδ and storage modulus at 150 °C of nanocomposites with different additives are illustrated in Fig. 7b. The values of tanδ are derived from the peaks of the damping spectra (tanδ versus temperature), representing the loss modulus to storage modulus ratio. The impact of additives on tanδ can be ascribed to two aspects: the improved degree of crosslinking and the enhanced interfacial force.57 As shown in Fig. 7b, the tanδ values of GMS/PI specimens are higher than that of virgin PI, while the 1GMS/PI specimen possesses a decreased value compared with the specimens with lower GMS contents. This means that an optimum GMS content exists in terms of damping capacity, and a superfluous amount of GMS generates a tendency for stacking, thereby lessening the interaction between polymer chains and additives.
The thermodynamic properties of GMS/PI specimens reflect the complementary effect of GO–ODA and nano-MoS2–MA. The tanδ value of the 0.5MoS2/PI specimen increases remarkably from 1.13 to 1.47 compared to that of virgin PI (Fig. 7b), which means that mechanical unlocking occurs due to the disengagement of nano-MoS2–MA particles and polymer chains.12 This structural feature contributes to the ductility of the GMS/PI specimen. In addition, the storage modulus at 150 °C of the 0.5GO/PI specimen shows a 20% rise compared to virgin PI, illustrating the confinement effect of graphene sheets at interfaces.12 The combination of nano-MoS2–MA and GO–ODA contributes to the mechanical interlocking, interfacial compatibility, and homogeneous dispersion, thus leading to the enhancement of mechanical and thermodynamic properties.
As is known, the surface strength exerts a tremendous influence on the tribological properties of coating materials. Therefore, the microhardness of the nanocomposites was observed using an ultra nanoindentation tester. Fig. 8a shows typical loading–holding–unloading curves, indicating that resistance to indentation is enhanced with increasing GMS loading, as the depth of penetration reduces when the loading force reaches the same limit. The microhardness of GMS/PI specimens in Fig. 8b presents a similar dependence on the GMS content, although the increment diminishes when the loading reaches 1%, where the effect starts to saturate, as our previous work revealed.47 The 0.5GMS/PI specimen shows better microhardness compared to the 0.5GO/PI and 0.5MoS2/PI specimens, further confirming the synergistic effect.
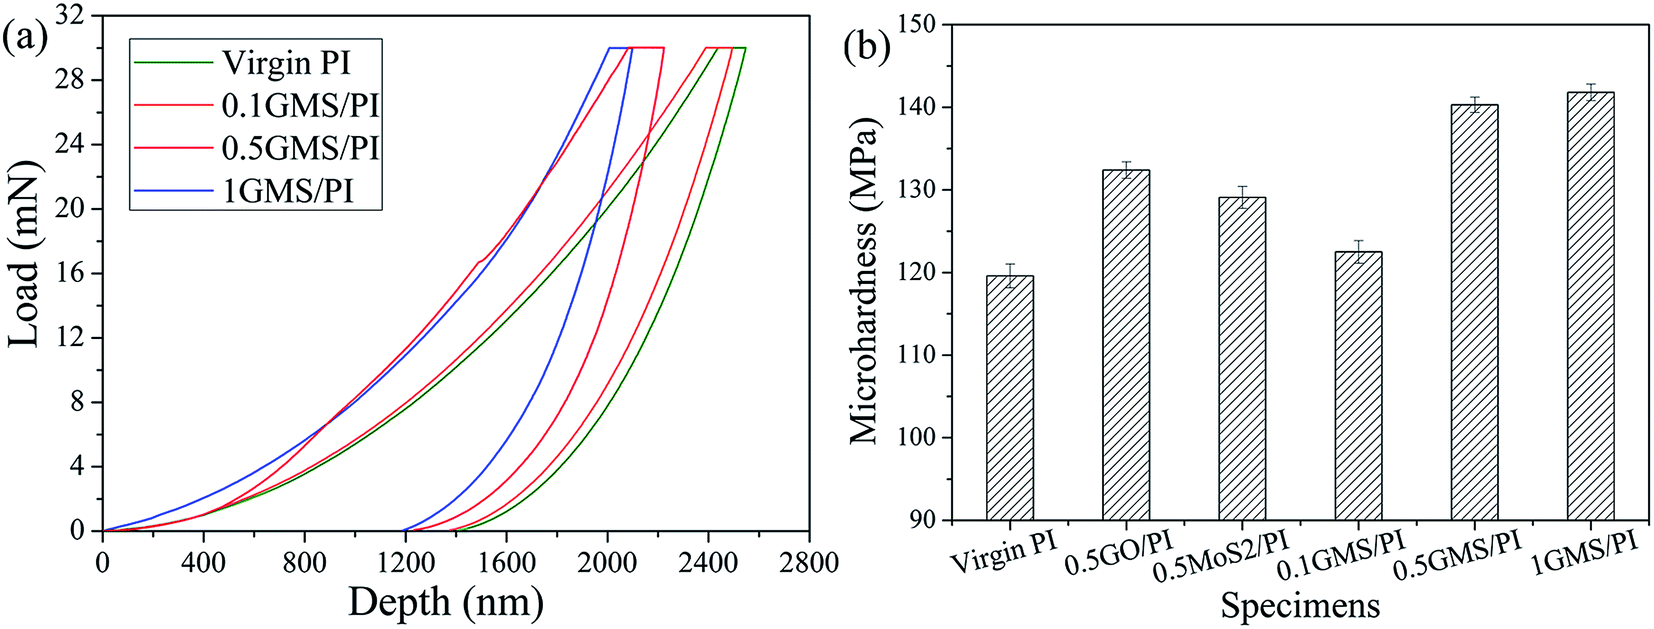 | ||
| Fig. 8 (a) Typical loading-hold-unloading curves of virgin PI, 0.1GMS/PI, 0.5GMS/PI, and 1GMS/PI specimens. (b) Microhardness of virgin PI, 0.5GO/PI, 0.5MoS2/PI, 0.1GMS/PI, 0.5GMS/PI, and 1GMS/PI specimens. | ||
3.3 Tribological effect of GMS
The GMS hybrid derives the attributes of high mechanical strength from GO and admirable toughness from nano-MoS2, which make it an especially self-lubricating and anti-wear additive for polymer nanocomposites. To investigate the tribological effect of GMS, friction tests were conducted on as-prepared specimens using a reciprocating friction and wear testing machine. The appropriate friction conditions were chosen, according to our previous work.12,31Fig. 9a illustrates the friction coefficients of GMS/PI specimens as a function of sliding time. The incorporation of GMS notably reduces the friction coefficient and the run-in period of GMS/PI composites, and the 0.5GMS/PI specimen shows a reduction of about 25% in the average friction coefficient compared with virgin PI, from 0.45 to 0.34. However, the reduction in the friction coefficient diminishes and the fluctuation phenomenon in the friction coefficient curve intensifies when the GMS loading reaches 1 wt%, suggesting that the self-lubricating effect receded, due to the stacking of overloaded GMS sheets.
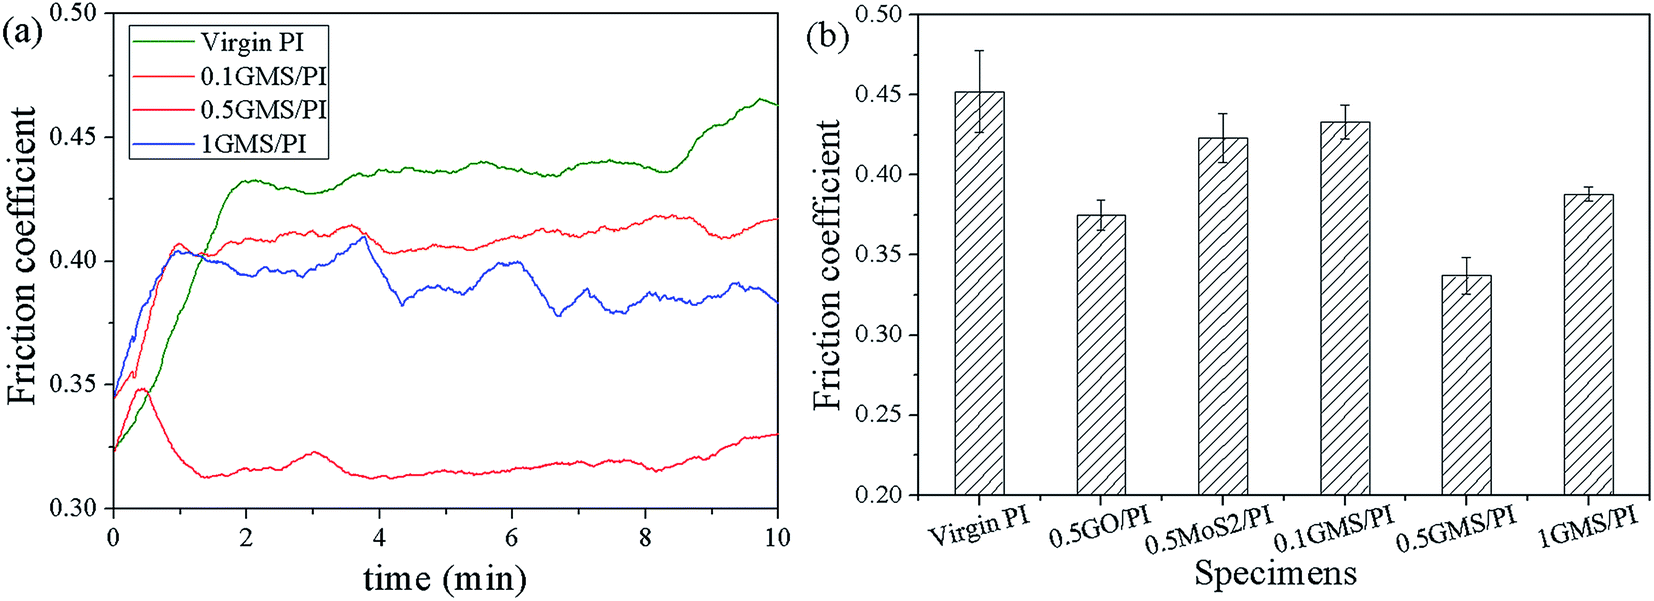 | ||
| Fig. 9 (a) Friction coefficients of virgin PI, 0.1GMS/PI, 0.5GMS/PI, and 1GMS/PI specimens as a function of sliding time. (b) Friction coefficients of virgin PI, 0.5GO/PI, 0.5MoS2/PI, 0.1GMS/PI, 0.5GMS/PI, and 1GMS/PI specimens (reciprocating frequency: 10 Hz, sliding distance: 300 m, load: 6 N, RH: 40%). | ||
Changes in the friction coefficients of PI composites with different additives are shown in Fig. 9b. The reduction in the friction coefficients of 0.5GO/PI and 0.5MoS2/PI specimens is about 17% and 6%, respectively. In our previous work,31 a near 50% reduction was obtained in the friction coefficient with 0.5 wt% GNF (GO/nano-PTFE hybrid), manifesting that the lubrication-assisting effect of nano-MoS2 is weaker than that of nano-PTFE. It is worth mentioning that in the case of GNF, the friction coefficient of the nano-PTFE/PI specimen was lower than that of the GO/PI specimen. However, the reverse is the case for GMS, where the friction coefficient of the 0.5MoS2/PI specimen was higher compared to 0.5GO/PI, and the synergistic effect in the lubricity still appears.
Fig. 10 shows the relationship of the wear rate of PI composites with different additives. The wear rate decreases by about 64% in the GMS/PI specimen with only 0.5 wt% GMS addition. The improvement in the wear resistance of GMS is better than that in GO–ODA and nano-MoS2–MA, owing to the distinct reduction in the friction coefficient and the synergistic effect of these two precursor particles. By contrast, in our previous work,31 a decrease of nearly two orders of magnitude in the wear rate of a PI composite was observed with 0.5 wt% GNF addition. This discrepancy may mainly result from the intrinsic characteristics of the immobilized nanoparticles, as the combination methods were similar in both cases. The organic nature of nano-PTFE endows more optimal compatibility with the polymer matrix, and the peculiar structure of the crystalline slices in nano-PTFE gives better sliding ability, compared to nano-MoS2 as inorganic particles. The above discussion is conducive to optimizing the design scheme of multidimensional assemblies with outstanding tribological function.
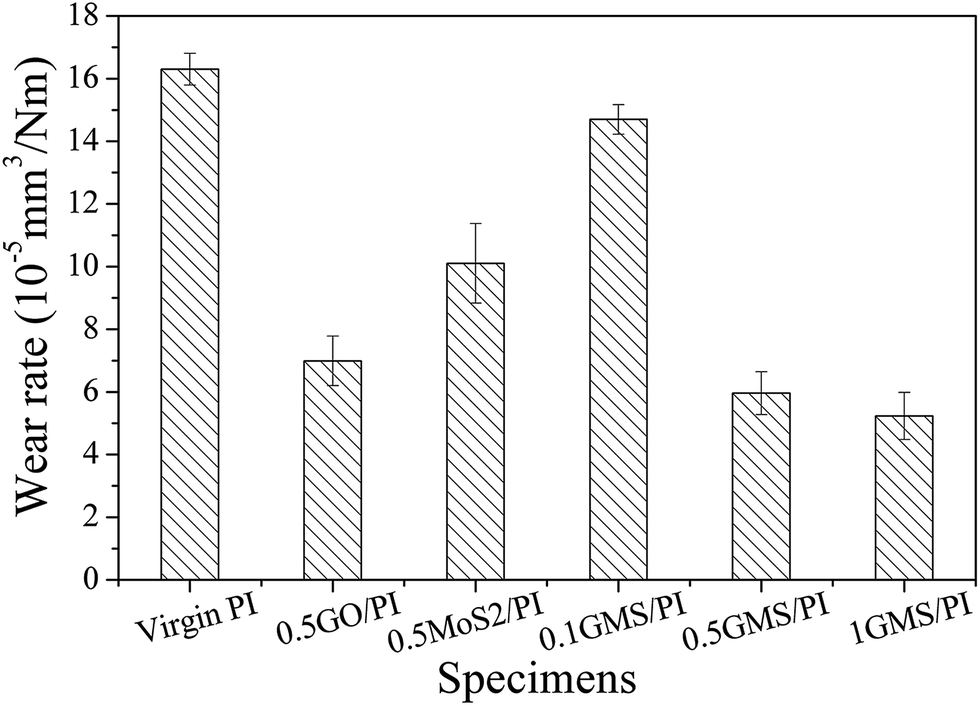 | ||
| Fig. 10 Wear rate of virgin PI, 0.5GO/PI, 0.5MoS2/PI, 0.1GMS/PI, 0.5GMS/PI, and 1GMS/PI specimens (reciprocating frequency: 10 Hz, sliding distance: 300 m, load: 6 N, RH: 40%). | ||
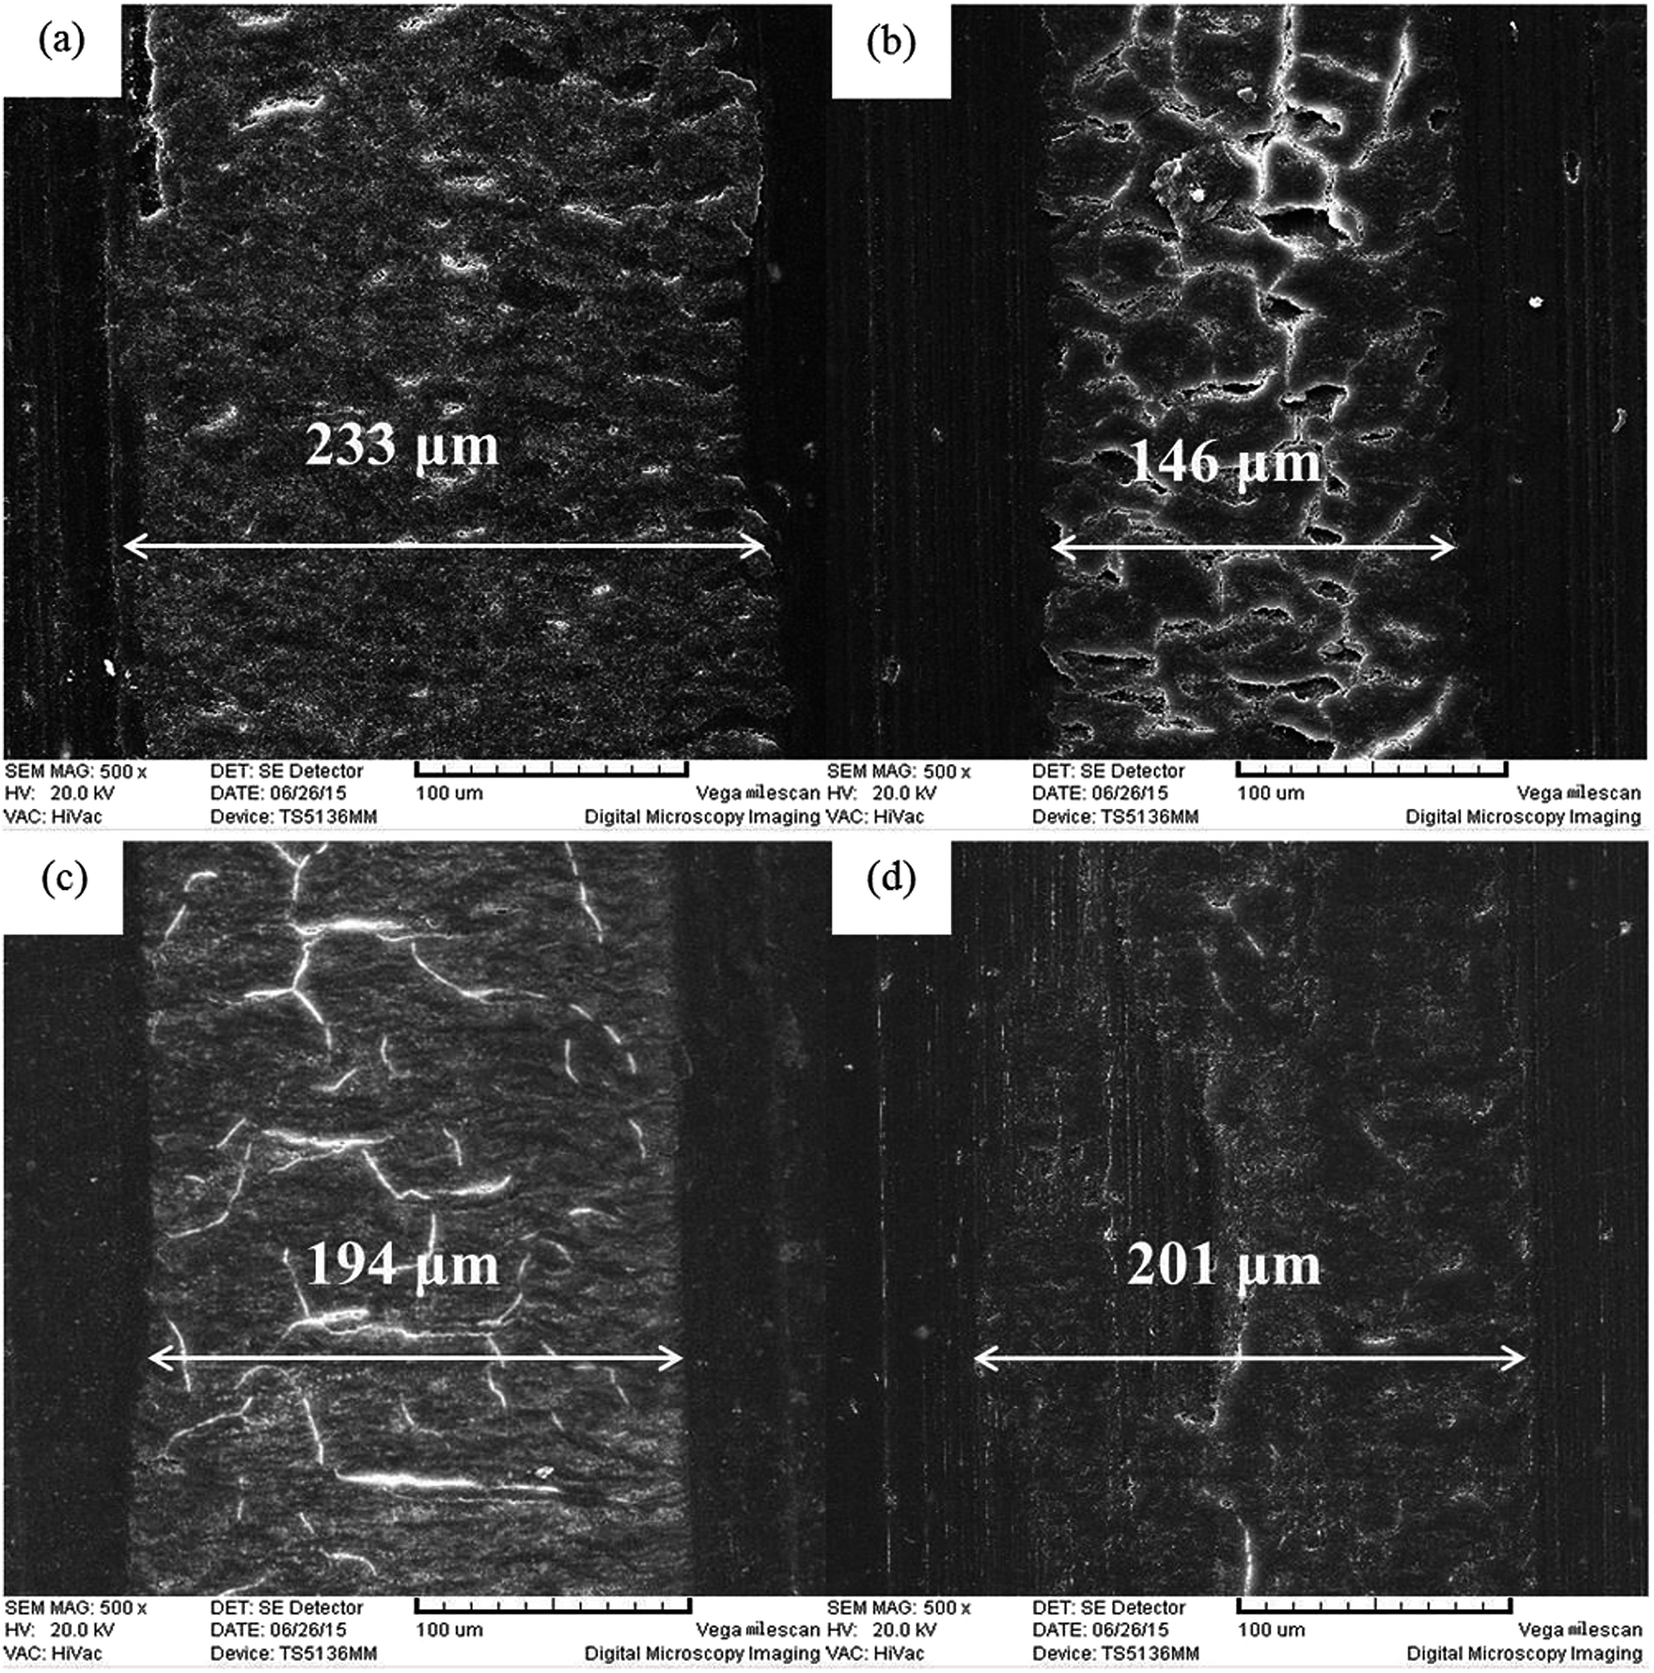
SEM images of worn surfaces of PI composites with different additives were obtained, as shown in Fig. 11. The virgin PI worn surface displays signs of adhesive wear, as some obvious embossments exist. In contrast, the worn surfaces of the 0.5GMS/PI and 0.5GO/PI specimens reflect some typical fatigue deformations with deep cracks and compact furrows. The characteristics of fatigue wear in the 0.5GMS/PI specimen are more evident, with many chasms occurring at the junctions of cracks. For the 0.5MoS2/PI specimen, the type of wear is shown as a combination of adhesive wear and abrasive wear, as slight embossments and furrows appear on the worn surface. Meanwhile, the wear width of 0.5GMS/PI is much narrower (146 μm) than that of virgin PI (233 μm), and the wear widths of the 0.5GO/PI and 0.5MoS2/PI specimens also reveal varying degrees of reduction. The addition of GMS effectively restrained the deformation of worn surfaces and reduced the real contact area. As the tensile strengths of these specimens differ moderately, the large reduction in the real contact area plays the main role in the observed decrease in the friction coefficient.58
 | ||
| Fig. 11 SEM images of worn surface of (a) virgin PI, (b) 0.5GMS/PI, (c) 0.5GO/PI, and (d) 0.5MoS2/PI specimens (magnification: 500). | ||
SEM images of the wear debris of PI composites with different additives are given in Fig. 12. After the incorporation of GMS, the morphology of the wear debris transformed from large platelets into small particles. The wear debris shape of the 0.5GO/PI specimen is more like that of the 0.5GMS/PI specimen by comparison, while the 0.5MoS2/PI specimen is more similar to virgin PI, corresponding to the type of wear, as discussed above. The observed decrease in the size of the wear debris can be attributed to two aspects: the tribological effects of graphene sheets, including the protective effect and the suppression effect, and the increase in mechanical properties, according to previous work.12
 | ||
| Fig. 12 SEM images of the wear debris of (a) virgin PI, (b) 0.5GMS/PI, (c) 0.5GO/PI, and (d) 0.5MoS2/PI specimens (magnification: 200). | ||
The degree of roughness of the nanocomposites before and after wear was also evaluated by atomic force microscopy (Fig. S4†). Before wear, virgin PI, 0.5GMS/PI, 0.5GO/PI, and 0.5MoS2/PI specimens possessed approximately the same degree of roughness. However, after wear, the worn surface of the 0.5GMS/PI specimen was obviously smoother than that of virgin PI, as the Ra value was nearly 80% lower. The improved surface smoothness also contributes to the enhanced tribological properties of GMS/PI specimens.
As is known, the tribological properties of composites depend on multiple factors, including the dispersion and compatibility of fillers, interfacial interaction, mechanical and thermodynamic properties, surface properties, and preparation technology.43,51,52 A simplified schematic diagram is shown in Fig. 13 to explain the different tribological mechanisms of GMS/PI and GNF/PI composites. As shown in Fig. 13c, the peak at 385 cm−1, corresponding to the characteristic peak of MoS2, is much stronger in the Raman spectra of the wear debris of 0.5GMS/PI than that of virgin PI, with the rest of the spectra remaining almost the same, such as the absorptions at 1515 cm−1 (benzene ring stretching vibration), 1392 cm−1 (C–N–C axial stretching vibration), 1262 cm−1 and 1140 cm−1 (C–O–C stretching vibration), 991 cm−1 (C–N–C transverse stretching vibration), and 868 cm−1 (C–N–C out-of-plane bending vibration). Besides, the peak assigned to nano-MoS2–MA is prominent in the spectra of transfer film, while it is hard to identify the peaks assigned to GO–ODA (Fig. 13d). These results indicate that the transfer film is mainly composed of MoS2, and nano-MoS2 particles are peeled off the GMS sheets that lie on the worn surface. This is quite different in the case of GNF/PI composites,31 where the immobilized nano-PTFE generated an extension on the GNF surface under shear force.
 | ||
| Fig. 13 (a) Schematic of the tribological mechanism of PI composites. (b) Comparison of the schematic construction of GMS and GNF hybrids before and after friction. (c) Raman analysis of wear debris of 0.5GMS/PI and virgin PI specimens. (d) Raman spectral comparison between transfer film, nano-MoS2–MA, and GO–ODA. | ||
The different tribological mechanisms of GMS and GNF nanohybrids can be explained using Fig. 13b as a model. Nano-MoS2–MA was yielded by the esterification reaction with maleic anhydride, while nano-PTFE–AA was produced by irradiation grafting with acrylic acid.31 The latter possesses certain oligomers of acrylic acid on its surface, which reduced the steric hindrance effect and increased the probability of engagement with GO–ODA. As a consequence, nano-PTFE–AA has stronger interfacial bonding with GO–ODA. On the other hand, the low activation energy for the slippage of crystalline slices facilitates the extension of nano-PTFE, while the reduction in the number of layers of nano-MoS2 weakens the interlayer slipping effect, which plays a crucial role in the lubrication action of bulk MoS2.59 Due to the above two points, the immobilized nano-PTFE particles tend to overspread the GO sheet, but nano-MoS2 particles are peeled off under the extremely strong shear force caused by friction.
Fig. 14a shows the morphology of the transfer film formed in the friction process of 0.5GMS/PI specimen. A relatively integrated and homogeneous transfer film can be observed on the counterpart. The partially enlarged detail (Fig. 14c) reveals that some irregularly shaped sheets and tiny particles appeared on the transfer film, corresponding to the wear debris and the nano-MoS2 particles peeled off the GMS, respectively. The transfer film mainly contains Mo, O, Fe, and S, as shown in Fig. 14b. In addition, the EDS image of Mo proves the homogeneous Mo dispersion (Fig. 14d). These results verify that the transfer film is basically composed of MoS2, which is consistent with the result from the Raman spectra. The formation of the transfer film greatly reduces direct contact and scraping between the counterpart and specimens, thereby effectively reducing the friction force.60–62 A homogeneous transfer film was also obtained in the case of GNF/PI composites, as reported.31 The transfer film formed by GNF/PI is smoother than that formed by GMS/PI and possesses a more outstanding effect in reducing abrasive wear. In this work, the detached nano-MoS2 particles can take advantage of the rolling friction effect in reducing the friction coefficient.63
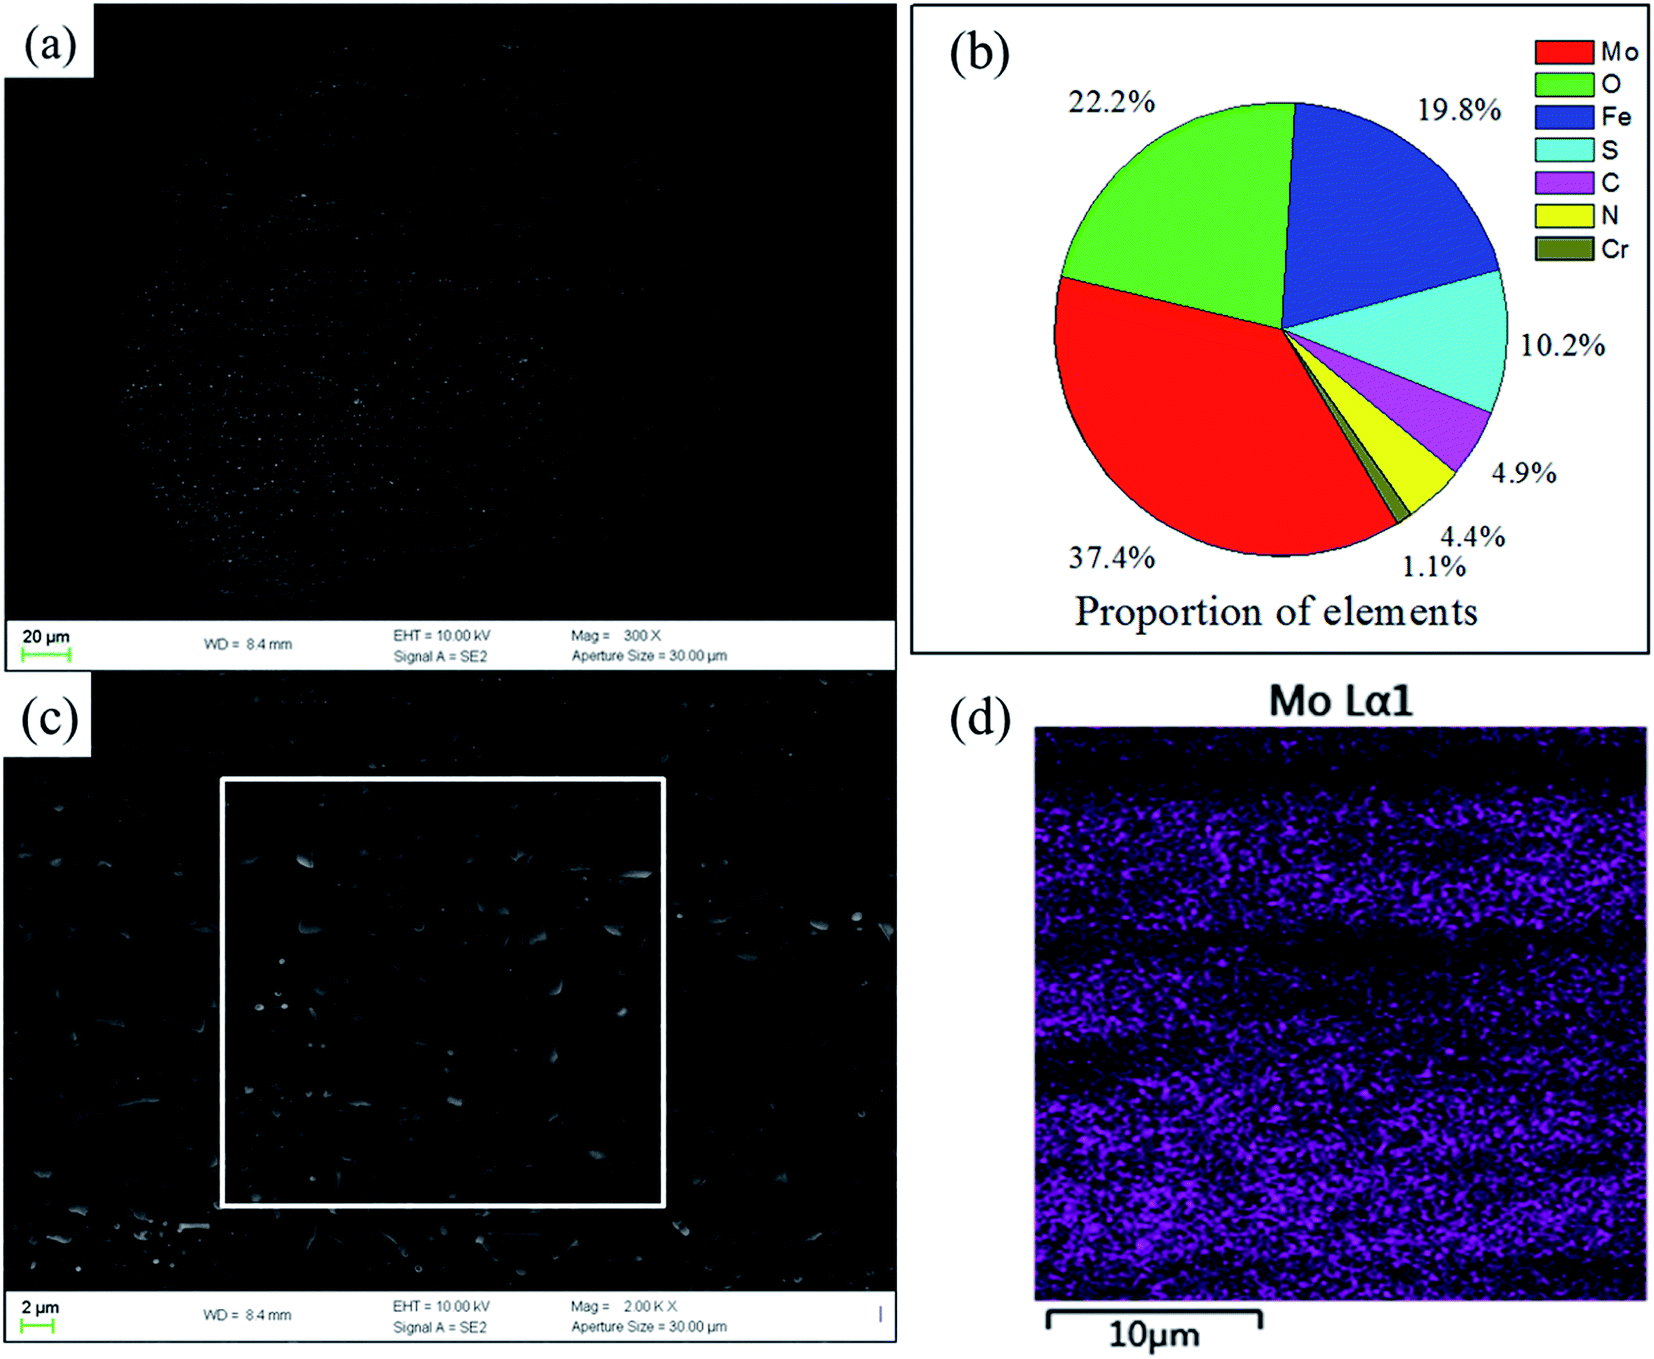 | ||
| Fig. 14 (a) FESEM image of transfer film on the counterpart (magnification: 300). (b) Pie graph showing the elemental content of the transfer film. (c) FESEM image (the inset shows EDS scanning area) showing the dispersion of particles in the transfer film (magnification: 2k). (d) EDS image of Mo elemental distribution in transfer film. | ||
The comparison of the tribological effects of GMS with GNF is beneficial to understanding the unique performance of the so-called multidimensional nanohybrids, which is really a complex function of the precursor nanoparticles. The differences in the tribological mechanisms of GMS/PI and GNF/PI demonstrate that the performance of multidimensional nanohybrids is dependent on the following two aspects: (a) the intrinsic characteristics of the immobilized nanoparticles, noting the rolling friction effect of nano-MoS2 and the slippage of crystalline slices in nano-PTFE, and (b) the combinational structure of the multidimensional assemblies, in view of the differences in interfacial bonding. Considering the various shapes and properties of nanoparticles and their endless combinations, this work offers a concise strategy to minimize the variables and clarify the critical factors.
4. Conclusions
In this work, we utilized a three-step strategy to prepare the GO/nano-MoS2 (abbreviated GMS) nanohybrid as a self-lubricating and anti-wear additive. Subsequently, PI nanocomposites were fabricated by in situ polymerization and thermal imidization. For the reinforcing aspect, the as-prepared GMS/PI composites possess better mechanical, thermodynamic, and surface properties. Meanwhile, the nano-MoS2 particles and GO sheets show a synergistic effect with respect to tensile strength and microhardness and a complementary effect with respect to elongation at break and storage modulus. For the tribological aspect, the 0.5 wt% GMS addition resulted in a 25% reduction in the friction coefficient and a 64% reduction in the wear rate. Furthermore, the synergistic effect of nano-MoS2 and GO was verified, and ascribed to the suppression and protective effect of graphene sheets, the rolling friction effect of detached nano-MoS2 particles, and the transfer film composed of MoS2. As a multidimensional nanohybrid, the tribological effect of GMS reveals some differences compared to GNF in our previous work, which can be attributed to two aspects: the intrinsic characteristics of the immobilized nanoparticles and the combinational structure of the multidimensional assemblies.Conflict of interest
The authors declare no competing financial interest.Acknowledgements
We acknowledge financial support from the National Basic Research Program of China (Grant 2011CB605704).References
- Y. J. Liu, H. Y. Du, L. W. Liu and J. S. Leng, Smart Mater. Struct., 2014, 23, 22 Search PubMed.
- S. B. Ye and J. C. Feng, ACS Appl. Mater. Interfaces, 2014, 6, 9671–9679 CAS.
- T. Hanemann and D. V. Szabo, Materials, 2010, 3, 3468–3517 CrossRef CAS.
- R. Gusain and O. P. Khatri, J. Mater. Chem. A, 2013, 1, 5612–5619 CAS.
- F. Zhou, Y. Liang and W. Liu, Chem. Soc. Rev., 2009, 38, 2590–2599 RSC.
- S. R. Chauhan and S. Thakur, Mater. Des., 2013, 51, 398–408 CrossRef CAS.
- Y. C. Chen, H. C. Lin and Y. D. Lee, J. Polym. Res., 2003, 10, 247–258 CrossRef CAS.
- G. Gorrasi, V. Vittoria, M. Murariu, A. D. S. Ferreira, M. Alexandre and P. Dubois, Biomacromolecules, 2008, 9, 984–990 CrossRef CAS PubMed.
- S. C. Tjong, Mater. Sci. Eng., R, 2006, 53, 73–197 CrossRef.
- Y.-W. Wang and W.-C. Chen, Mater. Chem. Phys., 2011, 126, 24–30 CrossRef CAS.
- J. J. Ge, D. Zhang, Q. Li, H. Q. Hou, M. J. Graham, L. M. Dai, F. W. Harris and S. Z. D. Cheng, J. Am. Chem. Soc., 2005, 127, 9984–9985 CrossRef CAS PubMed.
- T. Huang, Y. S. Xin, T. S. Li, S. Nutt, C. Su, H. M. Chen, P. Liu and Z. L. Lai, ACS Appl. Mater. Interfaces, 2013, 5, 4878–4891 CAS.
- J. Liu, J. Tang and J. J. Gooding, J. Mater. Chem., 2012, 22, 12435–12452 RSC.
- M. T. Mo, W. J. Zhao, Z. F. Chen, E. Y. Liu and Q. J. Xue, RSC Adv., 2016, 6, 7780–7790 RSC.
- H. Yan, S. Li, Y. Jia and X. Y. Ma, RSC Adv., 2015, 5, 12578–12582 RSC.
- Z. Tai, Y. Chen, Y. An, X. Yan and Q. Xue, Tribol. Lett., 2012, 46, 55–63 CrossRef CAS.
- B. Pan, S. Zhang, W. Li, J. Zhao, J. Liu, Y. Zhang and Y. Zhang, Wear, 2012, 294, 395–401 CrossRef.
- H. Liu, Y. Li, T. Wang and Q. Wang, J. Mater. Sci., 2012, 47, 1867–1874 CrossRef CAS.
- H. Song, N. Li, Y. Li, C. Min and Z. Wang, J. Mater. Sci., 2012, 47, 6436–6443 CrossRef CAS.
- M. T. Mo, W. J. Zhao, Z. F. Chen, Q. X. Yu, Z. D. Zeng, X. J. Wu and Q. Xue, RSC Adv., 2015, 5, 56486–56497 RSC.
- C. Liu, H. X. Yan, Z. Y. Chen, L. X. Yuan and Q. Lv, RSC Adv., 2015, 5, 46632–46639 RSC.
- S. Q. Lai, T. S. Li, F. D. Wang, X. J. Li and L. Yue, Wear, 2007, 262, 1048–1055 CrossRef CAS.
- S. Q. Lai, L. Yue, T. S. Li, X. J. Liu and R. G. Lv, Macromol. Mater. Eng., 2005, 290, 195–201 CrossRef CAS.
- T. Huang, R. Lu, H. Wang, Y. Ma, J. Tian and T. Li, J. Macromol. Sci., Part B: Phys., 2011, 50, 1235–1248 CrossRef CAS.
- Y. Xiao, L. Liu, C. B. He, W. S. Chin, T. T. Lin, K. Y. Mya, J. C. Huang and X. H. Lu, J. Mater. Chem., 2006, 16, 829–836 RSC.
- S. J. Guo, D. Wen, Y. M. Zhai, S. J. Dong and E. K. Wang, ACS Nano, 2010, 4, 3959–3968 CrossRef CAS PubMed.
- D. Z. Zhang, Y. E. Sun, P. Li and Y. Zhang, ACS Appl. Mater. Interfaces, 2016, 8, 14142–14149 CAS.
- Z. Y. Chen, H. X. Yan, T. Y. Liu, S. Niu and J. Y. Ma, RSC Adv., 2015, 5, 97883–97890 RSC.
- H. L. Li, L. Jin, J. L. Dong, L. Liu, M. Li, Y. Liu, L. H. Xiao and Y. H. Ao, RSC Adv., 2016, 6, 60200–60205 RSC.
- W. Y. Zhang, D. Demydov, M. P. Jahan, K. Mistry, A. Erdemir and A. P. Malshe, Wear, 2012, 288, 9–16 CrossRef CAS.
- T. Huang, T. S. Li, Y. S. Xin, B. C. Jin, Z. X. Chen, C. Su, H. M. Chen and S. Nutt, RSC Adv., 2014, 4, 19814–19823 RSC.
- J. Hong, C. H. Liu, X. Deng, T. Jiang, L. Gan and J. Huang, RSC Adv., 2016, 6, 89221–89230 RSC.
- Z. Y. Chen, H. X. Yan, T. Y. Liu and S. Niu, Compos. Sci. Technol., 2016, 125, 47–54 CrossRef CAS.
- A. J. Crosby and J. Y. Lee, Polym. Rev., 2007, 47, 217–229 CrossRef CAS.
- M. A. Firestone, S. C. Hayden and D. L. Huber, MRS Bull., 2015, 40, 760–767 CrossRef CAS.
- Y. Chen, Y. M. Zhang and Y. Liu, Chem. Commun., 2010, 46, 5622–5633 RSC.
- S. Q. Liu and Z. Y. Tang, J. Mater. Chem., 2010, 20, 24–35 RSC.
- I. Barel, M. Urbakh, L. Jansen and A. Schirmeisen, Phys. Rev. Lett., 2010, 104, 4 CrossRef PubMed.
- J. Suhr, W. Zhang, P. M. Ajayan and N. A. Koratkar, Nano Lett., 2006, 6, 219–223 CrossRef CAS PubMed.
- A. Salam, L. A. Lucia and H. Jameel, ACS Appl. Mater. Interfaces, 2013, 5, 11029–11037 CAS.
- M. Yoonessi, J. A. Peck, J. L. Bail, R. B. Rogers, B. A. Lerch and M. A. Meador, ACS Appl. Mater. Interfaces, 2011, 3, 2686–2693 CAS.
- Y. Cao, J. Feng and P. Wu, Carbon, 2010, 48, 1683–1685 CrossRef CAS.
- T. Huang, P. Liu, R. Lu, Z. Huang, H. Chen and T. Li, Wear, 2012, 292, 25–32 CrossRef.
- W. C. Oliver and G. M. Pharr, J. Mater. Res., 2004, 19, 3–20 CrossRef CAS.
- J. C. Li, Y. P. Zhang, S. Zhang and X. D. Huang, J. Membr. Sci., 2015, 490, 179–189 CrossRef CAS.
- G. L. Frey, R. Tenne, M. J. Matthews, M. S. Dresselhaus and G. Dresselhaus, Phys. Rev. B: Condens. Matter Mater. Phys., 1999, 60, 2883–2892 CrossRef CAS.
- T. Huang, R. Lu, C. Su, H. Wang, Z. Guo, P. Liu, Z. Huang, H. Chen and T. Li, ACS Appl. Mater. Interfaces, 2012, 4, 2699–2708 CAS.
- Y. Cao, Z. Lai, J. Feng and P. Wu, J. Mater. Chem., 2011, 21, 9271–9278 RSC.
- G. Du, Z. Guo, S. Wang, R. Zeng, Z. Chen and H. Liu, Chem. Commun., 2010, 46, 1106–1108 RSC.
- M. Sharma and J. Bijwe, J. Mater. Sci., 2012, 47, 4928–4935 CrossRef CAS.
- W. Brostow, H. E. H. Lobland and M. Narkis, J. Mater. Res., 2006, 21, 2422–2428 CrossRef CAS.
- X. Z. K. Loy and S. K. Sinha, Wear, 2012, 296, 681–692 CrossRef CAS.
- J.-Y. Wang, S.-Y. Yang, Y.-L. Huang, H.-W. Tien, W.-K. Chin and C.-C. M. Ma, J. Mater. Chem., 2011, 21, 13569–13575 RSC.
- H. W. Ha, A. Choudhury, T. Kamal, D.-H. Kim and S.-Y. Park, ACS Appl. Mater. Interfaces, 2012, 4, 4623–4630 CAS.
- E. Basavaraj, B. Ramaraj, J. H. Lee and H. Siddaramaiah, Polym. Eng. Sci., 2013, 53, 1676–1686 CAS.
- R. J. Young, I. A. Kinloch, L. Gong and K. S. Novoselov, Compos. Sci. Technol., 2012, 72, 1459–1476 CrossRef CAS.
- S. N. Goyanes, P. G. Konig and J. D. Marconi, J. Appl. Polym. Sci., 2003, 88, 883–892 CrossRef CAS.
- P. Samyn, G. Schoukens, F. Verpoort, J. Van Craenenbroeck and P. De Baets, Macromol. Mater. Eng., 2007, 292, 523–556 CrossRef CAS.
- X. Zhang, B. Luster, A. Church, C. Muratore, A. A. Voevodin, P. Kohli, S. Aouadi and S. Talapatra, ACS Appl. Mater. Interfaces, 2009, 1, 735–739 CAS.
- K. Tanaka, Y. Uchiyama and S. Toyooka, Wear, 1973, 23, 153–172 CrossRef CAS.
- H. Wang, R. Lu, T. Huang, Y. Ma, P. Cong and T. Li, Mater. Sci. Eng., A, 2011, 528, 6878–6886 CrossRef CAS.
- G. W. Yi and F. Y. Yan, Wear, 2007, 262, 121–129 CrossRef CAS.
- S. S. Kandanur, M. A. Rafiee, F. Yavari, M. Schrameyer, Z.-Z. Yu, T. A. Blanchet and N. Koratkar, Carbon, 2012, 50, 3178–3183 CrossRef CAS.
Footnote |
| † Electronic supplementary information (ESI) available: Schematic diagram of the contact configuration of the reciprocating friction and wear testing machine; XRD patterns of nano-MoS2, nano-MoS2–MA, GO, GO–ODA and GMS; digital photographs of virgin PI, 0.5GO/PI, 0.5MoS2/PI, 0.1GMS/PI, 0.5GMS/PI and 1GMS/PI specimens; degree of roughness of virgin PI, 0.5GO/PI, 0.5MoS2/PI and 0.5GMS/PI specimens before and after wear. See DOI: 10.1039/c6ra27108a |
| This journal is © The Royal Society of Chemistry 2017 |