 Open Access Article
A low-cost and water resistant biomass adhesive derived from the hydrolysate of leather waste†
Jianfei Zhouab,
Teng Xu‡
b,
Xiaoling Wanga,
Chang Liua,
Xuepin Liao*ab,
Xin Huang ab and
Bi Shi
 b
b
aDepartment of Biomass Chemistry and Engineering, Sichuan University, Chengdu 610065, China. E-mail: xpliao@scu.edu.cn
bNational Engineering Laboratory for Clean Technology of Leather Manufacture, Sichuan University, Chengdu 610065, China
First published on 16th January 2017
Abstract
A low-cost and water resistant biomass adhesive, collagen hydrolysate–silane coupling agent hybrids (CSH), was prepared by using collagen hydrolysate (CH) extracted from leather waste as the starting material, and silane coupling agent (SCA) as the crosslinking agent. The as-prepared adhesive was fully characterized by Fourier transform infrared spectroscopy (FTIR), 29Si CP-MAS NMR spectroscopy, differential scanning calorimetry (DSC), scanning electron microscopy (SEM), ANS assay and ninhydrin assay. The as-prepared CSH exhibited pretty good adhesive strength and water resistance. Moreover, the water resistance of CSH can be conveniently tuned by changing the type and dosage of the silane coupling agent. When used as a wood adhesive, the dry adhesive strength of CSH was as high as 1.57 MPa, and the corresponding wet adhesive strength reached 0.95 MPa. Our experimental results suggest that the collagen hydrolysate extracted from leather waste has a great potential to be used as a low-cost and highly effective adhesive in the wood composite industry.
1. Introduction
Each year, a huge amount of chromium-containing leather waste is generated in the leather making industry owing to the procedures of splitting, shaving and buffing.1,2 This waste needs proper handling otherwise serious threats would be engaged in terms of people's health and environmental safety. In this regard, conventional methods, such as land filling and burning, are frequently employed for the treatment of this waste while these approaches are now being considered less cost-effective and environmentally benign owing to the release of toxic gases and secondary pollution to ground water.3,4 From the point of view of sustainable development, a more effective and economic strategy is required to properly handle the problem caused by chromium-containing leather waste. Along this direction, collagen proteins are extracted from the leather waste, which are utilized as food in domestic animal raising. However, the utilization of these extracted collagen proteins is currently forbidden owing to their potential threat to food safety.5 As a consequence, it is extremely urgent to develop a practical solution to properly handle the leather waste.Although petrochemical-based adhesives dominate the market of wood composite panels, it is still necessary to develop other alternatives, particularly the renewable biomass-based adhesives.6 The utilizations of renewable biomass for preparing low-cost adhesives have received considerable attentions over the past decades, and the already investigated biomaterials include, soy protein,7 tannin,8 and lignin,9 etc. As we discussed above, the leather wastes mainly consist of collagen proteins, which account for ∼90% weight of leather wastes. In principle, the polar groups of collagen proteins can interact with wood to form a network structure. These behaviours of collagen proteins strongly suggest that a low-cost wood adhesive could be prepared by using collagen contained in leather wastes as the starting material. However, the hydrolysis of leather wastes is usually carried out via basic hydrolysis. The obtained collagen hydrolysate (CH) usually has a low molecular weight and abundant hydrophilic groups. The direct use of these collagen hydrolysates as adhesives will have the problems of poor gluing strength and water resistance. Therefore, it is necessary to enhance the adhesive properties of collagen hydrolysate by increasing their molecular weight through crosslinking and introducing hydrophobic groups.10–12
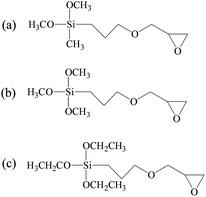
In this work, silane coupling agents (SCA) constituted of epoxy group and alkoxy group were employed as the crosslinking agent to increase the molecular weight of CH extracted from leather wastes.13 Based on the reactions between SCA and collagen hydrolysate, the resultant CSH gained the desired structure, which can form stable adhesive network with high mechanical strength. Moreover, the long hydrophobic alkyl chains grafted onto CSH can provide excellent hydrophobicity for the as-prepared adhesives. In this way, a low-cost and water resistant biomass adhesive can be obtained by using collagen extracted from leather wastes as the raw material. In the present investigation, three types of SCA with different molecular structures were employed for the preparation of CSH adhesives, including (3-glycidyloxypropyl)dimethoxymethylsilane (GPDMS), (3-glycidyloxypropyl)trimethoxysilane (GPTMS) and (3-glycidyloxypropyl)triethoxysilane (GPTES). Fourier transform infrared spectroscopy, 29Si CP-MAS NMR spectroscopy, differential scanning calorimetry (DSC), scanning electron microscope (SEM), ANS assay and ninhydrin assay were carried out to analyze the physiochemical properties of CSH. Subsequently, the adhesive properties of CSH were systematically evaluated by using it as the adhesive to bond the wood panels, including gluing strength and water resistance.
2. Experimental section
2.1 Materials
1-Anilino-8-naphthalene sulfonate acid (ANS) and ninhydrin were purchased from Huaxia reagent Co., Ltd., (Beijing, China). GPTMS, GPTES and GPDMS were purchased from Aladdin Co., Ltd., (Shanghai, China) and used without further purification. All chemicals were analytical reagents and deionized water was used for the preparation of all solutions. Birch veneers with dimensions of 100 mm (length) × 25 mm (width) × 2 mm (thickness) were provided by Sichuan University (China).2.2 Preparation of collagen hydrolysate–SCA hybrids (CSH)
4.0 g of NaOH was added into 200 mL of water, followed by the addition of 100 g of chrome-containing leather waste. The mixture reacted at 95–180 °C (0.7 MPa) for 4–5 h, and then treated by filtration and spray drying. The obtain material was CH powder. The characteristics of chrome-tanned leather waste and CH powder are shown in Table 1. As shown in Table 1, the chromium content is extremely low in the CH powder.CH powder (10 g) was suspended in 100 mL of deionized water and stirred for 10 min at room temperature. The pH of the resultant mixture was adjusted to 9.0 by adding 1 M NaOH solution. Then, different ingredients of SCAs (Fig. 1) were added into the above solution, respectively, and the pH of the mixture was adjusted to 9.0. The system was stirred at 50 °C for 12 h. Finally, the CSH solution was dialyzed with a dialysis membrane (Spectra/Por®) and freeze-dried. Here, we prepared CSH with different compositions, as shown in Table 2.
| Reactants | 1# | 2# | 3# | 4# | 5# |
|---|---|---|---|---|---|
| CH | 1.0 | 1.0 | 1.0 | 1.0 | 1.0 |
| GPDMS | 0.1 | 0.5 | 1.0 | 1.5 | 2.0 |
| GPTMS | 0.1 | 0.5 | 1.0 | 1.5 | 2.0 |
| GPTES | 0.1 | 0.5 | 1.0 | 1.5 | 2.0 |
2.3 Measurements of adhesive strength and water resistance
Birch veneers were preconditioned in a chamber (model HWS-150, Jinghong Co., Ltd., Shanghai) for 7 days at 23 °C with 50% relative humidity. The CSH slurry was brushed onto each end of birch veneer with dimensions of 152 × 25 mm (length × width) until the entire area was completely wetted (ca. 5.0 ± 0.1 mg cm−2 CSH solid concentration). The preparation of specimens was described by Z. Zhong et al.14 The variation of slurry amount on each piece was minimized by using a consistent brushing procedure. The two pieces of slurry-brushed birch veneer were allowed to rest open at room temperature for 10 min. After assembled and pressed at 90 °C for 2 h, the wood assembly glued with CSH was cooled down and cut into five 25 mm-wide specimens (glued area of 25 × 25 mm).The required force (N) to shear the glued wood specimens was tested with an Universal Testing Machine (model AI-7000S, GOTECH Co., Ltd., Canton) at a crosshead speed of 2 mm min−1 (tension mode). All the reported adhesive strength data were means of five replications. Water resistance of the wood assemblies was measured in accordance with Chinese national standard (GB/T 9846.3-2004) for plywood for general use. Specifically, the preconditioned specimens were soaked in tap water at 30 °C for 2 h and then dried at 63 °C for 1 h. The specimens were left at room temperature for 10 min and then immediately tested for wet strength. The measured date was the average of five measurements.
2.4 Characterization
The crosslinking extent of CH was determined by ninhydrin assay of primary amine group (α-amine) of CH before and after crosslinking.15 Briefly, 2 mL of 0.1 g L−1 CSH solution (in triplicate) and 1 mL of 0.5% (w/v) ninhydrin solution in 0.5 mol L−1 phosphate buffer (pH 6.0) was added into the colorimetric tubes. Then, the resultant ninhydrin-containing suspension was heated in a covered boiling water bath for 20 min, followed by cooling below 30 °C in a cold water bath. The cooled suspension was diluted with 7 mL of 45% ethanol/water solution (v/v) and the optical absorbance of the supernatant solution was recorded at 570 nm. Values are means of three measurements. Crosslinking degree was calculated as below:
 | (1) |
Surface hydrophobicity of CSH was determined by using the 1-anilino-8-naphthalene sulfonate (ANS) as a fluorescence probe according to the literature.16 Accordingly, the CSH samples with concentration ranging from 0.5 to 2.5 g L−1 were prepared by using 10 mM phosphate buffer (pH 7.0) as the solvent. 100 μL of the ANS (8 mM ANS in 10 mM phosphate buffer) was added in 10 mL of CSH solution. The ANS–CSH conjugates were excited at 380 nm and the relative fluorescence intensities were measured at 450 nm in a fluorescence spectrophotometer (model G9800A, Agilent Technologies Co., Ltd., USA) with 5 nm slit widths. The slope (S0) of the plot of fluorescence intensity (arbitrary units) versus CSH concentration (g L−1) was calculated by linear regression and was used as the index of the CSH hydrophobicity.
FT-IR spectroscopic data were collected in the region of 4000–400 cm−1 with an FT-IR spectrometer (model IS10, Thermo Fisher Scientific Co., Ltd., USA). The fracture surface morphologies of birch were observed by a scanning electron microscope (model Phenom Pro, PhenomChina Co., Ltd., Shanghai) operating at 10 kV.
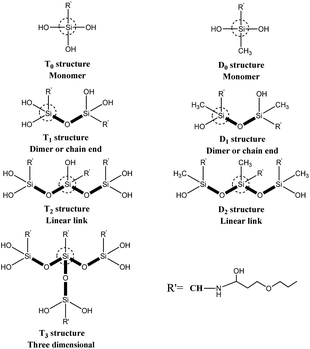
Solid-state 29Si CP-MAS NMR measurements were carried out using solid NMR spectrometer (model AVANCE III 500 MHz, Bruker Co., Ltd., Switzerland) operating at 99.35 MHz and 11.746 T with 10 s recycle delays. Sample spinning rate was approximately 4–4.5 kHz. The samples were placed in 7 mm ZrO2 rotors. A 39 kHz spectral width was used. The 29Si scale was calibrated with the signal from the external standard polydimethylsilane (PDMS, δ = −34 ppm). Ti corresponds to R′–Si(–OSi)i–OR(3−i), a tri-functional silicate. Thus, four T types can be presented, namely T0, T1, T2 and T3, as sketched in Fig. 2. These peaks have the typical chemical shift ranges: T0: −37 to −39 ppm, T1: −46 to −48 ppm, T2: −53 to −57 ppm, and T3: −61 to −66 ppm. For R′–Si(–OSi)i–OR(2−i), a di-functional silicate, three ‘D’ peaks can be presented, namely D0, D1, D2, as sketched in Fig. 2, with the following typical chemical shift ranges: D0: −3 to −5 ppm, D1: −8 to −12 ppm, and D2: −13 to −19 ppm.17,18
3. Results and discussion
3.1 Preparation and characterization of CH–SCA hybrids (CSH)
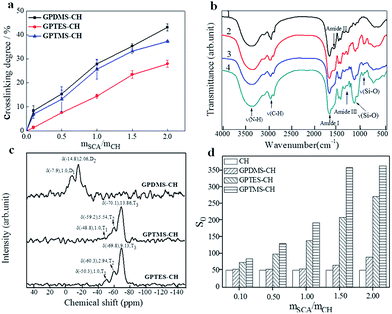
We prepared three types of CSH adhesives, and their crosslinking degrees were determined by ninhydrin assay of uncrosslinked primary amine groups (α-amine) of CH since the preparation of CH–SCA was mainly based on the reaction between epoxy group of SCA and the α-amine of CH.19 As shown in Fig. 3a, when the molar ratio of SCA (GPDMS, GPTMS and GPTES) to CH is increased from 0 to 2, the crosslinking degree is increased accordingly, suggesting the successful cross-linkage between SCA and CH. The crosslinking degrees of GPDMS–CH, GPTMS–CH and GPTES–CH were determined to be 43%, 37% and 27%, respectively. It is noted that the crosslinking efficiency of SCA to CH obeys the following order: GPDMS > GPTMS > GPTES. These results suggest that the use of SCA with smaller steric hindrance is beneficial for the crosslinking of CH.Fig. 3b shows the FT-IR transmittance spectra of CH, GPDMS–CH, GPTMS–CH and GPTES–CH, respectively. The FT-IR of CH shows the typical bands of amide I, amide II and amide III of collagen at 1600–1700 cm−1, 1500–1550 cm−1 and 1200–1300 cm−1, respectively.20,21 The peak at 3500–3300 cm−1 arises from the stretching of amine groups. After crosslinking with SCA, the broad band between 1000 and 1200 cm−1 was caused by stretching of C–O and Si–O bonds as shown in the spectra of Fig. 3b(2–4).22,23 Moreover, a characteristic band is started to appear at 910 cm−1 in Fig. 3b(2–4), corresponding to the stretching vibration of Si–O–H.24 These new formed bonds indicate that the CH was successfully cross-linked with SCA.
The 29Si solid-state NMR spectra of the CH cross-linked with GPDMS, GPTMS and GPTES are shown in Fig. 3c, respectively. The chemical shift and relative peak area (%) of each Ti and Di units are shown in Table S1.† The NMR patterns of GPTMS–CH and GPTES–CH show no significant difference in the chemical shift from −40 ppm to −80 ppm. The quantitative analysis of GPTMS–CH spectra shows that the GPTMS–CH is composed of 5.15% T1 units, 26.02% T2 units and 68.83% T3 units. As for GPTES–CH, it composed of 7.37% T1 units, 21.47% T2 units and 71.16% T3 units. Both GPTMS–CH and GPTES–CH have a high proportion of T3 units, which indicates that the main content of those adhesive is three dimensional oligomeric network, which is formed from the hydrolysis and condensation of tri-alkoxy.25 The quantitative analysis of GPDMS–CH shows that GPDMS–CH is composed of 30.55% D1 units and 69.45% D2 units. These results suggest that GPDMS–CH mainly consists of linear runs of Si–O–Si groups, which is formed from the hydrolysis and condensation of di-alkoxy.26
We further measured the surface hydrophobicity of CSH. With the molar ratio of SCA over CH (mSCA/mCH) increased from 0.1 to 2.0, the surface hydrophobicity of GPDMS–CH, GPTMS–CH and GPTES–CH was determined to be 51–91, 51–366, 51–274, respectively (Fig. 3d). It is apparent that increasing the dosage of SCA improves the surface hydrophobicity of CSH, owing to the increased number of hydrophobic alkyl chains. We noted that along with the increase of mSCA/mCH, the hydrophobicity growth trend of GPTMS–CH and GPTES–CH are significantly faster than that of GPDMS–CH. Based on above analysis of 29Si solid-state NMR spectra, the structure of GPTMS–CH and GPTES–CH features to a dimensional network, which could provide more effective hydrophobic protection to CH than that of linear-structured GPDMS–CH, thus showing improved water resistance.
3.2 Adhesive properties of birch wood bonded by CSH adhesives
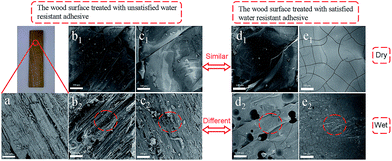
Adhesive strength is a critical factor to evaluate the property of adhesives, we thus tested the shear strength of CSH glued wood specimen. As shown in Fig. 4, the optimized dry shear strength of CSH glued wood specimens can be as high as 1.36, 1.51 and 1.57 MPa, respectively, which is substantially higher than that (0.91 MPa) of CH glued wood specimens. Fig. 5a is the SEM image showing the surface microstructure of native birch veneer without treated by adhesive, which features to a strip-like rough surface. As for the fractured wood specimens glued with CH, the surface on the fractured area showed very smooth surface, which is due to the coverage and filling of CH over the rough surface of native birch veneer. Similar phenomenon was also observed on the fractured surfaces of CSH-glued wood species, where abundant adhesives reside on the fracture surface, revealing that the three types of CSH adhesive have excellent dry strength to birch wood. We know that there are abundant hydroxyls on birch wood, which can form hydrogen bond or covalent bond with the silanol groups of CSH, thus improving the adhesive strength between wood and CSH. On the other hand, the network structure of CSH derived from the condensation of silanol in adhesive can also help to enhance the adhesive strength. These factors together bring us the excellent dry adhesive strength for CSH-glued wood species.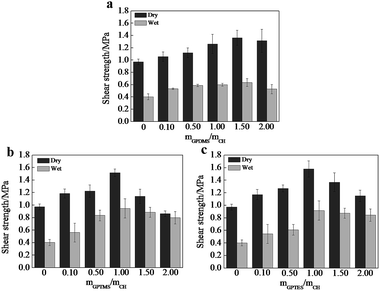 | ||
| Fig. 4 Influences of the molar ratio of (a) GPDMS/CH, (b) GPTMS/CH and (c) GPTES/CH on shear strengths. | ||
As for wood adhesives, the water resistance is also an important property. Table S2† shows the wood failure results of the plywood panels bonded with different CH-based adhesives in soak tests. The plywood panels bonded with CH adhesive containing SCA have less failed specimens than those bonded without SCA. Moreover, no specimen is failed in the soak test when the molar ratio of SCA over CH is more than 1.0. Apparently, the use of GPDMS, GPTMS and GPTES improves the water resistance of the bonded plywood panels. As shown in Fig. 4, the wet shear strength of CH glued wood specimen is 0.51 MPa, substantially lower than its dry shear strength. Based on SEM observation, we found that the fractured surface of CH glued wood specimens has very limited CH covered, which is similar to the morphology of un-glued birch veneer. Obviously, CH glued wood specimens has quite poor water resistance due to its weak interactions with the wood surface in the presence of water. The optimized wet shear strength of CSH glued wood specimens are 0.63, 0.95 and 0.92 MPa, respectively. In spite that the wet shear strength of CSH glued wood specimens are lower than those of corresponding dry shear strength, the wet adhesive strengths of GPTMS–CH and GPTES–CH glued wood specimens are still high enough to meet the requirement of Chinese national standard (GB/T 9846.3-2004, 0.7 MPa). As shown in Fig. 5c2, the fractured surface of GPDMS–CH glued wood specimen is still very rough, and features to the typical strip-like microstructure, similar to the surface microstructure of native birch veneer. In contrast, the fractured surfaces of GPTMS–CH and GPTES–CH glued wood specimens are still fully covered by the used adhesives (Fig. 5d2 and e2). All these results suggest that the use of GPTMS–CH and GPTES–CH as adhesives can provide pretty good wet adhesive strength owing to their strong interactions with wood. It is reasoned that GPDMS mainly forms in linear link in the adhesives, which is not effect enough to cover and protect the hydrophilic surface of wood, thus leading to poor wet shear strength. For GPTMS and GPTES, they mainly forms three dimensional networks in the adhesives and a large number of crosslinking structures might be formed between silanol and the hydroxyls of wood surface, producing much better hydrophobicity.
It is noted that the dry and wet shear strength both decline as further increasing the dosage of SCA beyond the optimized value. This phenomena can be attributed to the formation of abundant covalent bonds, which causes the reduction of wetting ability and the gel of CSH with poor flow ability, hindering the physical attraction and chemical bonding with wood.27,28
4. Conclusions
In summary, a novel biomass adhesive was facilely prepared using collagen hydrolysate extracted from leather wastes as the raw material. The as-prepared low-cost adhesive exhibited a properly crosslinked three dimensional structure network, which allowed good interactions with wood, thus showing pretty good adhesive strength and water resistance. Our experimental results suggest that the collagen hydrolysate extracted from leather wastes has a great potential to be used as low cost and high effective adhesive in wood composite industry.Acknowledgements
The research was financially supported by National High Technology R&D program (2011AA06A108). Jianfei Zhou and Teng Xu have equal contribution to this work.References
- J. Kanagaraj, K. C. Velappan, B. N. K. Chandra and S. Sadulla, J. Sci. Ind. Res., 2006, 65, 541–548 CAS.
- T. Basegio, C. Haas, A. Pokorny, A. M. Bernardes and C. P. Bergmann, J. Hazard. Mater., 2006, 137, 1156–1164 CrossRef CAS PubMed.
- B. Ocak, A. Aslan and G. Gulumser, J. Am. Leather Chem. Assoc., 2011, 106, 232–238 CAS.
- A. Malek, M. Hachemi and V. Didier, J. Hazard. Mater., 2009, 170, 156–162 CrossRef CAS PubMed.
- K. Kolomazník, M. Adámek, I. Andel and M. Uhlirova, J. Hazard. Mater., 2008, 160, 514–520 CrossRef PubMed.
- Q. J. Lin, N. R. Chen, L. P. Bian and M. Z. Fan, Int. J. Adhes. Adhes., 2012, 34, 11–16 CrossRef CAS.
- N. S. Hettiarachchy, U. Kalapathy and D. J. Myers, J. Am. Oil Chem. Soc., 1995, 72, 1461–1464 CrossRef CAS.
- K. Li, X. Geng, J. Simonsen and J. Karchesy, Int. J. Adhes. Adhes., 2004, 24, 327–333 CrossRef CAS.
- M. A. Khan, S. M. Ashraf and V. P. Malhotra, Int. J. Adhes. Adhes., 2004, 24, 485–493 CrossRef CAS.
- G. Y. Qi, N. B. Li, D. H. Wang and X. S. Sun, Ind. Crops Prod., 2013, 46, 165–172 CrossRef CAS.
- D. G. Liu, H. H. Chen, P. R. Chang, Q. L. Wu, K. F. Li and L. T. Guan, Bioresour. Technol., 2010, 101, 6235–6241 CrossRef CAS PubMed.
- L. Halasz, O. Vorster, A. Pizzi and J. V. Alphen, J. Appl. Polym. Sci., 2000, 75, 1296–1302 CrossRef CAS.
- T. C. Tonda, P. Gentile, S. Saracino, V. Chiono, V. K. Nandagiri, G. Muzio, R. A. Canuto and G. Ciardelli, Int. J. Biol. Macromol., 2011, 49, 700–706 CrossRef PubMed.
- Z. K. Zhong, X. S. Sun, X. H. Fang and J. A. Ratto, Int. J. Adhes. Adhes., 2002, 22, 267–272 CrossRef CAS.
- S. Prochazkova, K. M. Vårum and K. Ostgaard, Carbohydr. Polym., 1999, 38, 115–122 CrossRef CAS.
- Y. H. You, Y. H. Zeng and Y. S. Liu, J. Soc. Leather Technol. Chem., 2014, 98, 69–75 CAS.
- M. P. J. Peeters, W. J. J. Wakelkamp and A. P. M. Kentgens, J. Non-Cryst. Solids, 1995, 189, 77–89 CrossRef CAS.
- T. M. Alam, R. A. Assink and D. A. Loy, Chem. Mater., 1996, 8, 2366–2374 CrossRef CAS.
- Y. Shirosaki, K. Tsuru, S. Hayakawa, A. Osaka, M. A. Lopes, J. D. Santos, M. A. Costa and M. H. Fernandes, Acta Biomater., 2009, 5, 346–355 CrossRef CAS PubMed.
- M. C. Chang and J. Tanaka, Biomaterials, 2002, 23, 4811–4818 CrossRef CAS PubMed.
- N. P. Camacho, P. West, P. A. Torzilli and R. Mendelsohn, Biopolymers, 2001, 62, 1–8 CrossRef CAS PubMed.
- M. Bengtsson and K. Oksman, Composites, Part A, 2006, 37, 752–765 CrossRef.
- J. W. Gu, J. Dang, W. C. Geng and Q. Y. Zhang, Fibers Polym., 2012, 13, 979–984 CrossRef CAS.
- M. Pantoja, B. B. Díaz, F. Velasco, J. Abenojar and J. C. R. Del, Appl. Surf. Sci., 2009, 255, 6386–6390 CrossRef CAS.
- M. C. B. Salon, G. Gerbaud, M. Abdelmouleh, C. Bruzzese, S. Boufi and M. N. Belgacem, Magn. Reson. Chem., 2007, 45, 473–483 CrossRef CAS PubMed.
- S. K. Young, W. L. Jarrett and K. A. Mauritz, Polymer, 2002, 43, 2311–2320 CrossRef CAS.
- Y. Wang, X. Mo, X. S. Sun and D. H. Wang, J. Appl. Polym. Sci., 2007, 104, 130–136 CrossRef CAS.
- M. Gindl, G. Sinn, W. Gindl, A. Reiterer and S. Tschegg, Colloids Surf., A, 2001, 181, 279–287 CrossRef CAS.
Footnotes |
| † Electronic supplementary information (ESI) available. See DOI: 10.1039/c6ra27132d |
| ‡ Co-first author. |
| This journal is © The Royal Society of Chemistry 2017 |

