 Open Access Article
Creative Commons Attribution 3.0 Unported Licence
Design and synthesis of dual probes for detection of metal ions by LALDI MS and fluorescence: application in Zn(II) imaging in cells†
Arundhoti Mandala,
Asim Maitya,
Swarnendu Bagb,
Prabuddha Bhattacharyaa,
Amit K. Dasc and
Amit Basak *a
*a
aDepartment of Chemistry, Indian Institute of Technology, Kharagpur 721302, India. E-mail: absk@chem.iitkgp.ernet.in
bCentre for Healthcare Science and Technology, Indian Institute of Engineering Science and Technology, Shibpur-711103, India
cDepartment of Biotechnology, Indian Institute of Technology, Kharagpur 721302, India
First published on 23rd January 2017
Abstract
A Label-Assisted Laser Desorption/Ionization (LALDI) technique has recently been applied to the detection of metal ions through a time of flight (TOF) mass spectrometric measurement. In this paper, we report the synthesis of two terpyridine based ligands L1 and L2 containing a pyrene moiety. The presence of the latter helped the ligand metal complex to desorb from the surface and ionize upon laser irradiation and finally show up in the TOF MS. Both ligands were able to detect Zn2+, Ni2+ and Co2+ ions while Cu2+, Fe2+ and Mg2+ remained LDI silent. Complexation with the ligands also caused a red fluorescence only with Zn2+ ions that allowed Zn2+ imaging in cells. Thus the pyrene moiety acted as a dual probe for metal ion detection exploiting both LALDI MS and fluorescence techniques.
Introduction
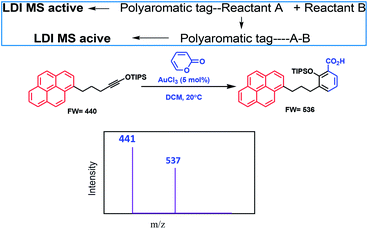
Metal ions play a crucial role in normal cellular function.1 In biological systems, they can function in a number of different ways. They act as cofactors for many critical enzymatic reactions.2 Some metals operate as structural elements3 and maintain charge and osmotic balance.4 Transition metal ions such as zinc(II), function as structural elements in superoxide dismutase5 and in zinc finger proteins.6 There are also a number of reports on activation of chemical reactivity of small molecules upon metal ion chelation.7 For example, acyclic enediynes with terminal ligands undergo Bergman cyclization8 at a lower temperature for the metal complexed system as compared to the uncomplexed one. Interestingly, presence of metal ions in excess or less in biological systems can have adverse effects. Every essential element follows a dose–response curve. At very low dosages, the organism struggles to survive, whereas in deficiency regions, the organism exists with sub-optimal function. Beyond the concentration plateau in the optimum dosage region, higher dosages cause toxic effects in the organism, eventually becoming lethal.9 Thus detection of metal ions that are playing critical roles in living systems, even at low concentrations, is of utmost importance for assessing health risk and environmental monitoring. The usual detection procedure includes traditional techniques like UV-VIS spectroscopy,10 fluorescence spectroscopy,11 Liquid Chromatography-Mass Spectrometry (LC-MS),12 Atomic Absorption Spectroscopy (AAS),13 Inductively Coupled Plasma Atomic Emission Spectrometry (ICP/AES),14 Inductively Coupled Plasma Mass Spectrometry (ICP/MS),15 Neutron Activation Analysis (NAA),16 X-ray fluorescence (XRF),17 Ion Chromatography (IC) and High Performance Liquid Chromatography (HPLC),18 surface plasmon resonance based optical sensors19 and microfluidics based sensors.20 However, these methods have their own limitations like interference from other analytes. Even electrospray mass spectrometry (ESI MS)21 may be difficult for mixture of analytes as all the constituents will show up in the spectrum and make the analysis difficult. A method which can detect specific metal ions in biological or environmental samples will be extremely useful and the LALDI MS technique coupled with fluorescence can offers a viable solution.Kozmin et al.22 used an LALDI MS technique for new reaction-discovery. Their strategy was based on labeling one of the reactants with a polyaromatic chemical tag (pyrene), which selectively underwent a photoionization/desorption process upon laser irradiation, without the assistance of an external matrix, and enabled rapid mass spectrometric detection of products originating from such labeled reactants in complex reaction mixtures without the need of any chromatographic separation. An example along with the principle behind their work is shown in Fig. 1.
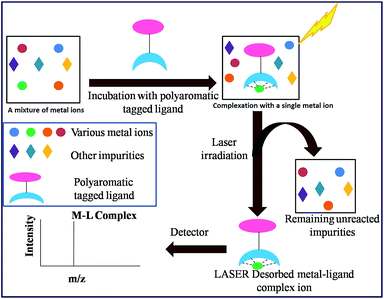
In recent years, our group has demonstrated the use of LALDI MS technique involving an oxine carboxylic acid–pyrene conjugate ligand for selective detection of metal ions like Zn2+.23 However, although the detection was easily discernible, the quality of the spectra was less than satisfactory. This is because of low sensitivity and low absorption of the ligand at laser wavelength of 337 nm as well as appearance of extra peaks originating from the ligand. With the aim of improving the spectra particularly at the low level of detection and removal of extraneous peaks, we have designed the terpyridine based ligands L1 and L2 (Fig. 2) attached with a pyrene moiety through ester linkage or through conjugation. Terpyridine is a tridentate ligand that binds metals at three meridional sites and it forms complexes with transition metal ions. The ligand has been well exploited for complexation with various metal ions. Recently, Ghosh et al.24 have reported in an interesting paper the design and synthesis of an alkynyl terpyridine which has been shown to form octahedral complexes with metal ions like Fe2+, Zn2+, Cd2+, Ru2+ and Pb2+. Another recent work has been reported by Patra et al.25 on terpyridine based sensor for detection of Cd2+. However, to our knowledge, there is no report of any pyrene based terpyridine ligand which has been used to serve the dual purpose of detection of metal ions by both LALDI MS as well as by fluorescence sensing. Pyrene moiety is known for its ability to act as an excellent LDI tag, due to its chemical inertness, ability to form radical cations and most importantly, very high molar extinction coefficient in the range 335–360 nm which allowed it to absorb laser radiation and subsequent desorption-cum-ionization. The pyrene–terpyridine conjugate should form chelate complex with analyte metal ions and the entire complex upon laser irradiation is expected to undergo desorption-cum-ionization and should be detectable by LDI-MS. The working principle is shown in the Fig. 3. In addition, the pyrene moiety was also expected to serve as the fluorophore changing its emission spectra upon complexation. In this paper, we describe the synthesis of ligands L1 and L2 and report their ability to detect metal ions by using a combination of LALDI MS and fluorescence.
Results and discussion
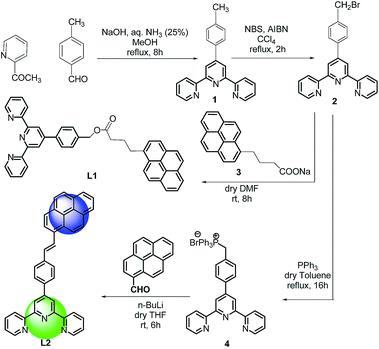
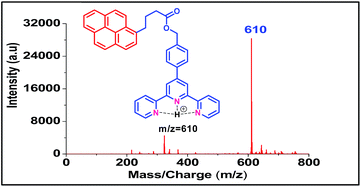
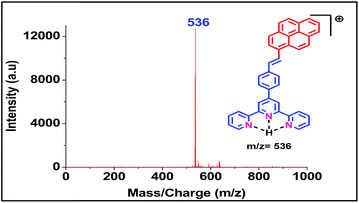
Both the ligands were synthesized starting from a common intermediate, namely 4′-(4-bromomethylphenyl)terpyridine 2 (Fig. 4). For this, the tolyl terpyridine 1 was first synthesized following the literature procedure reported by Zecher and Kröhnke.26 This synthetic protocol involves condensation reaction between 2-acetyl pyridine and 4-methylbenzaldehyde in presence of ammonia and NaOH to yield intermediate 1. Allylic bromination was performed using NBS and AIBN on 1 to obtain compound 2. The desired ligand L1 was formed when 2 was reacted with sodium salt of pyrene butyric acid 3. The ligand L2 was synthesized via Wittig reaction between the Wittig salt 4 and pyrene aldehyde in presence of n-BuLi. The structures of L1 and L2 have also been confirmed by 1H, 13C NMR (included in ESI†).With the ligands in hand, we first checked whether these are LDI active. For this, an aliquot of 1 μL of the prepared ligand solution of 1 μM in chloroform was spotted in the LDI plate and the mass spectrum (TOF-MS) was recorded. Due to high molar extinction coefficient of pyrene, ligand L1 showed a strong [MH]+ peak at m/z 610 (Fig. 5) while ligand L2 showed the peak at m/z 536 (Fig. 6). Expectedly, because of greater conjugation, the ligand L2 absorbs the laser to a greater extent and hence the corresponding LALDI spectrum of ligand L2 appeared to be clearer than ligand L1.
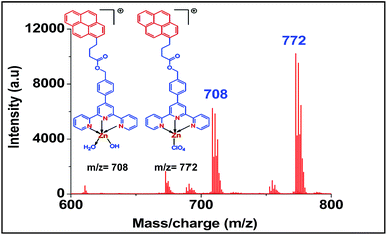
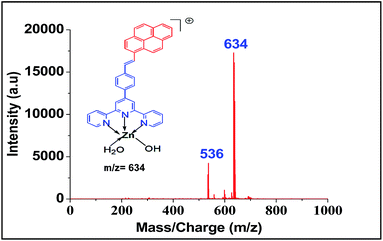
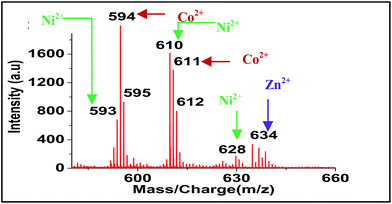
For screening the metal ion complexation, the concentration of probe (L1 or L2) was maintained at 0.1 μM and that of metal perchlorate salts at 1 μM in acetonitrile. The reaction mixtures were incubated for 2 h at 40 °C. An aliquot of 1 μL from the reaction mixture were taken from each reaction mixture and analyzed (TOF-MS) in positive ion mode. The captured complexes of Zn2+, Co2+, Ni2+ were LDI active with typical isotopic distributions27 while Fe2+, Cu2+ remained LDI silent. The summarized results of the screening process are given below in Table 1. The spectrum for Zn2+ with L1 and L2 are shown in Fig. 7 and 8 respectively.
| Metal ions | Obtained peak of metal complexes of ligand L1 (m/z) | Obtained peak of metal complexes ligand L2 (m/z) |
|---|---|---|
| Zn2+ | 708, 772 | 634 |
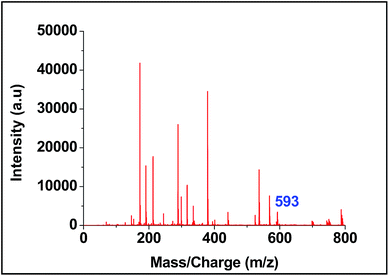
| Ni2+ | 667, 684, 702, 766 | 593, 610, 628, 692 |
| Co2+ | 668, 685, 703 | 594, 611 |
| Fe2+ | No significant peak | No significant peak |
| Cu2+ | No significant peak | No significant peak |
| Mg2+ | No significant peak | No significant peak |
Regarding sensitivity of detection for Zn2+ using the present protocol, we could determine Zn2+ at an impressive level of 0.025 μM (Fig. 9). The isotopic distribution also followed the theoretically predicted one (Fig. 10).
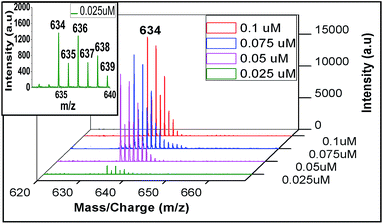 | ||
| Fig. 9 Sensitivity detection of zinc ion by LALDI-MS using ligand L2, blown up spectra for 0.025 μM concentration is shown in the inset. | ||
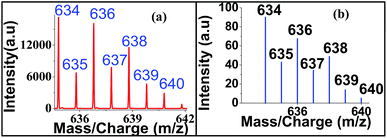 | ||
| Fig. 10 Isotopic distribution of zinc–ligand L2 complex in LALDI mass spectra (a) experimentally (b) calculated obtained. | ||
The LALDI mass spectrum of ligand L2 and Co(ClO4)2 was compared with the spectra obtained via conventional MALDI technique (Fig. 11). It clearly showed the advantage of LALDI over MALDI for small molecule detection.28
Moreover our synthesized probe can detect metal ion in presence of other organic impurities, ubiquitous in biological fluids like glucose, amino acid, α-ketoglutaric acid and tartaric acid, which cannot be accomplished by any other LDI techniques (Fig. 12). Even it can detect the presence of all three metal ions like Co2+, Zn2+ and Ni2+ in a mixture (Fig. 13).
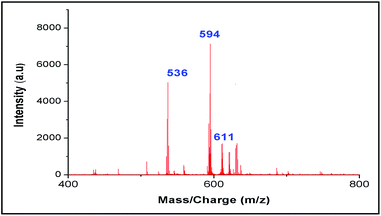 | ||
| Fig. 12 LALDI mass spectrum of ligand L2 and Co(ClO4)2 in presence of other organic impurities like amino acids, α-ketoglutaric acid, tartaric acid and glucose. | ||
We have also recorded the fluorescence and UV-spectral changes upon complexation (Fig. 14 and 15). The UV and fluorescence experiments were carried out in acetonitrile medium at 10−5 M concentration of ligand solution upon addition of incremental amount of metal perchlorate (in order of 200 μM). The UV-VIS spectrum of the ligand L1 exhibits maxima at 242 nm and 275 nm. For Zn2+, Ni2+ and Co2+, upon gradual increase of metal ion concentration, a new peak (284 nm for Co2+ and 285 nm for Zn2+ and Ni2+) was observed. No change was observed for Fe2+, Cu2+, Mg2+. Ligand L2 exhibited maxima at 384 nm. For Zn2+, Ni2+ and Co2+ shift of ligand peak was observed i.e., 384 nm to 407 nm for Zn2+, to 403 nm for Co2+ and to 405 nm for Ni2+. No change was observed for Fe2+, Cu2+, Mg2+. This also indicates the greater chelating ability of terpyridine moiety towards Zn2+, Ni2+ and Co2+.
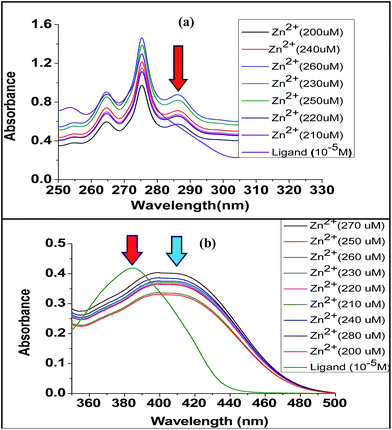 | ||
| Fig. 14 Comparative UV-VIS titration curve: (a) ligand L1 and (b) ligand L2, each with increasing concentration with Zn(ClO4)2. | ||
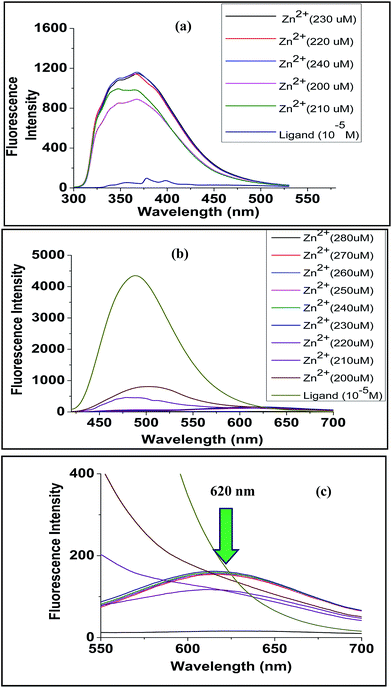 | ||
| Fig. 15 Comparative fluorescence titration curve for (a) ligand L1 when titrated with Zn(ClO4)2 and (b) ligand L2 when titrated with Zn(ClO4)2 (c) expanded portion of (b). | ||
Fluorescence data for ligand L2 were recorded at excitation wavelength of 360 nm. The free ligand showed emission maxima at 487 nm. Upon gradual increase of metal ion concentration, quenching of fluorescence was observed for all metal ions. Many transition metals are known to be fluorescence quenchers, and they can quench fluorescence through energy transfer or electron transfer mechanisms.29 The phenomenon of quenching in case of Zn2+, Ni2+ and Co2+ was very high compared to Fe2+, Mg2+, Cu2+. The greater extent of quenching in case of Zn2+, Ni2+ and Co2+ suggested formation of complexes causing easier energy transfer. This is also supported by LALDI-MS and UV-VIS studies. In case of Zn2+, apart from quenching of fluorescence, a new peak was observed at 620 nm with increasing Zn2+ concentration (Fig. 15b and c), it also showed a vivid colour change from yellow to red under UV lamp (Fig. 16). The new peak may be due to ligand to metal ion intramolecular charge transfer (ICT).30 The synthesized ligand L1 had very low fluorescent power, thus the experiment was carried out using a greater slit width of the fluorimeter. The fluorescence spectrum (Fig. 15a) of L1 was recorded at an excitation wavelength of 280 nm and it showed emission maxima at 378 nm. Upon gradual addition of Zn2+ concentration, the nature of the curve completely changed indicating strong complexation. However, unlike L2, no new band in the visible region was observed. Small changes were also noticed for Ni2+ and Co2+, but no change was observed for Fe2+, Mg2+, Cu2+.
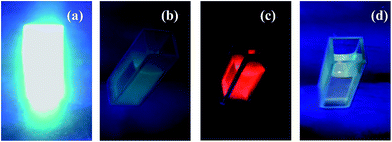 | ||
| Fig. 16 Color change under UV radiation for different metal ions incubated with ligand L2: (a) ligand L2 (b) ligand L2 + Co2+ (c) ligand L2 + Zn2+ and (d) ligand L2 + Ni2+. | ||
Encouraged by the outcome of fluorescence study we proceeded to the in vitro cell imagine for the staining of the zinc ion by the ligand L2. In this experiment we targeted HaCaT cell line for imaging studies. HaCaT is a spontaneously transformed aneuploid immortal keratinocyte cell line from adult human skin, widely used in scientific research.31
Considering the merits required for cell-imaging study, our object was to locate zinc ion in living cell by employing the higher fluorescent property of the ligand L2 and its greater affinity for zinc ion at biologically relevant environment.
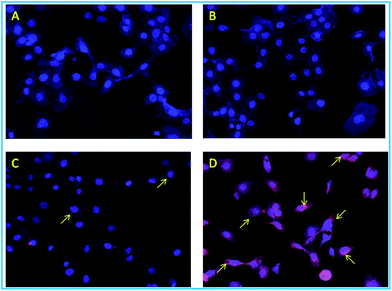
As predicted beforehand, the ligand L2 can selectively sense zinc ions in cell. The control cells and the cells only treated with Zn(ClO4)2 showed no red (Fig. 17A and B) but blue fluorescence was observed due to staining of the nucleus by DAPI. The cells treated with only ligand L2 showing the red fluorescence having less intensity (Fig. 17C) but the cells treated with both zinc salt and ligand showed more intense red fluorescence in high intensity (Fig. 17D).
When HaCaT cell were incubated with only ligand L2 very faint fluorescence expression was observed due to the zinc containing enzymes like metalloproteases, super oxide dismutase which reside in extracellular region (SoD1 in cytoplasm, SoD2 in mitochondria), but the zinc treated cell showed strong red fluorescent signal after incubating it with ligand indicating a subcellular distribution of zinc ion. It suggests that zinc mapping is possible for the synthesized probe L2.
Conclusion
In conclusion, we have successfully synthesized pyrene–terpyridine ligands for detection of their metal ion complexation property. One of the ligand also acted as a new fluorescent probe highly selective for zinc ion in presence of other metal ions in the biologically relevant range. Zinc ion imaging was demonstrated using ligand L2 in HaCaT cell by observing interaction of Zn2+ with ligand L2. Ligand L2 showed strong red fluorescence for Zn2+ accumulated in the mitochondrial part of HaCaT cell.Acknowledgements
We thank Professor Sanjib K. Patra, Department of Chemistry, IIT Kharagpur, for helpful discussion and suggestion. DST is acknowledged for an SERC grant (SB/S1/OC-94/2013) and for the JC Bose Fellowship to AB which supported this research. AM is grateful to IIT Kharagpur for a senior research fellowship and PB is grateful to CSIR, Government of India, for a research fellowship.References
- R. M. Roat-Malone, Bioinorganic Chemistry, Wiley, Hoboken, 2007 Search PubMed.
- (a) D. J. Sauke, D. E. Metzler and C. M. Metzler, Biochemistry: the chemical reactions of living cells, Harcourt/Academic Press, San Diego, 2nd edn, 2001 Search PubMed; (b) A. Sigel, H. Sigel, and R. K. O. Sigel, Metal ions in life sciences, Wiley, Chichester, 2006 Search PubMed.
- S. J. Lippard and J. M. Berg, Principles of Bioinorganic Chemistry, University Science Books, Mill Valley, CA, 1994 Search PubMed.
- Binding, Transport and Storage of Metal Ions in Biological Cells, ed. W. Maret and A. Wedd, RSC publications, 2013 Search PubMed.
- B. R. Roberts, J. A. Tainer, E. D. Getzoff, D. A. Malencik, S. R. Anderson, V. C. Bomben, K. R. Meyers, P. A. Karplus and J. S. Beckman, J. Mol. Biol., 2007, 373, 877 CrossRef CAS PubMed.
- J. H. Laity, B. M. Lee and P. E. Wright, Curr. Opin. Struct. Biol., 2001, 11, 39 CrossRef CAS PubMed.
- (a) A. Basak, S. Mandal and S. S. Bag, Chem. Rev., 2003, 103, 4077 CrossRef CAS PubMed; (b) B. Konig, H. Hollnagel, B. Ahrens and P. G. Jones, Angew. Chem., Int. Ed. Engl., 1995, 34, 2538 CrossRef; (c) B. P. Warner, S. P. Miller, R. D. Broee and S. L. Buchwald, Science, 1995, 269, 814 CrossRef CAS PubMed; (d) A. Basak and K. R. Rudra, Tetrahedron Lett., 2000, 41, 7231 CrossRef CAS; (e) D. S. Rawat and J. M. Zaleski, Chem. Commun., 2000, 2493 RSC.
- (a) R. G. Bergman, Acc. Chem. Res., 1973, 6, 25 CrossRef CAS; (b) R. R. Jones and R. G. Bergman, J. Am. Chem. Soc., 1972, 94, 660 CrossRef CAS.
- M. Jaishankar, T. Tseten, N. Anbalagan, B. B. Mathew and K. N. Beeregowda, Interdiscip. Toxicol., 2014, 7, 60 Search PubMed.
- (a) A. Manz, N. Graber and N. M. Widmer, Sens. Actuators, B, 1990, 1, 244 CrossRef CAS; (b) D. J. Harrison, A. Manz, Z. Fan, H. Ludi and M. H. Widmer, Anal. Chem., 1992, 64, 1926 CrossRef CAS; (c) S. Hiki, K. Mawatari, A. Hibara, M. Tokeshi and T. Kitamori, Anal. Chem., 2006, 78, 2859 CrossRef CAS PubMed.
- (a) Z. Dai and J. W. Canary, New J. Chem., 2007, 31, 1708 RSC; (b) J. R. Lakowicz, Principles of Fluorescence Spectroscopy, Springer, New York, 2006 Search PubMed; (c) B. Valeur, Molecular Fluorescence Principles and Applications, Wiley-VCH, New York, 2002 Search PubMed; (d) Y. Choi, Y. Park, T. Kang and L. P. Lee, Nat. Nanotechnol., 2009, 4, 742 CrossRef CAS PubMed.
- (a) J. J. Pitt, Clin. Biochem. Rev., 2009, 30, 19 Search PubMed; (b) C. Lauridsen, S. W. Leonard, D. A. Griffin, D. C. Liebler, T. D. McClure and M. G. Traber, Anal. Biochem., 2001, 289, 89 CrossRef CAS PubMed.
- B. V. L'vov, J. Anal. Chem., 2005, 60, 382 CrossRef.
- S. Ghosh, V. L. Prasanna, B. Sowjanya, P. Srivani, M. Alagaraja and D. Banji, Asian J. Pharm. Anal. Med. Chem., 2013, 3, 24 Search PubMed.
- D. Pröfrock and A. Prange, Appl. Spectrosc., 2012, 66, 843 CrossRef PubMed.
- E. Witkowska, K. Szczepaniak and M. Biziuk, J. Radioanal. Nucl. Chem., 2005, 265, 141 CrossRef CAS.
- B. Beckhoff, B. Kanngießer, N. Langhoff, R. Wedell and H. Wolff, Handbook of Practical X-Ray Fluorescence Analysis, Springer, 2006 Search PubMed.
- G. J. Van Berkel and V. Kertesz, Rapid Commun. Mass Spectrom., 2013, 27, 1329 CrossRef CAS PubMed.
- (a) K. V. Kong, Z. Lam, W. K. O. Lau, W. K. Leong and M. Olivo, J. Am. Chem. Soc., 2013, 135, 18028 CrossRef CAS PubMed; (b) S. K. Srivastava, R. Verma and B. D. Gupta, Sens. Actuators, B, 2011, 153, 194 CrossRef CAS.
- H. F. Li and J. M. Lin, Anal. Bioanal. Chem., 2009, 393, 555 CrossRef CAS PubMed.
- R. B. Cole, Electrospray and MALDI Mass Spectrometry Fundamentals, Instrumentation, Practicalities, and Biological Applications, Wiley, Hoboken, 2010 Search PubMed.
- J. R. Cabrera-Pardo, D. I. Chai, S. Liu, M. Mrksich and S. A. Kozmin, Nat. Chem., 2013, 5, 423 CrossRef CAS PubMed.
- P. S. Addy, S. Basu Roy, S. M. Mandal and A. Basak, RSC Adv., 2014, 4, 23314 RSC.
- B. N. Ghosh, F. Topić, P. K. Sahoo, P. Mal, J. Linnera, E. Kalenius, H. M. Tuononen and K. Rissanen, Dalton Trans., 2015, 254 RSC.
- A. Sil, A. Maity, D. Giri and S. K. Patra, Sens. Actuators, B, 2016, 226, 403 CrossRef CAS.
- W. Zecher and F. Kröhnke, Chem. Ber., 1961, 94, 690 CrossRef CAS.
- An alternate structure of Zn(II) complex could be thought of where the two ligands H2O and OH are replaced by Cl. However the absence of isotopic peaks due to 35Cl and 37Cl made us to believe that it is indeed OH and H2O acting as the ligands. We have not seen the formation of dimers as was reported by Ghosh, et al. during incubation of ligand with the metal perchlorates which may be due to the bulky pyrene ring adding some steric compression in the dimeric complex. We thank the referee for drawing our attention to this aspect.
- The spectrum showed in Fig. 12 is that of cobalt(II) complex with L2. The spectrum is not that bad even in presence of matrix as the polyaromatic absorbing the laser is already present. But if we use acetylacetone as the ligand, the spectrum of the cobalt complex in presence of matrix showed a small peak for Co(acac)3 complex. This showed the advantage of using the polyaromatic label. The new spectrum of Co(acac)3 in presence of matrix is included in ESI.†.
- (a) J. A. Kemlo and T. M. Shepherd, Chem. Phys. Lett., 1977, 47, 158 CrossRef CAS; (b) A. W. Varnes, R. B. Dodson and E. L. Wehry, J. Am. Chem. Soc., 1972, 94, 946 CrossRef CAS PubMed; (c) L. Fabbrizzi, M. Licchelli, P. Pallavicini, A. Perotti, A. Taglietti and D. Sacchi, Chem.–Eur. J., 1996, 75 CrossRef CAS.
- A. Vogler and H. Kunkely Coord, Chem. Rev., 2000, 208, 321 CAS.
- P. Boukamp, R. T. Breitkreutz, D. Hornung, J. Hornung, A. Markham and N. E. Fusenig, J. Cell Biol., 1988, 106, 761 CrossRef CAS PubMed.
Footnote |
| † Electronic supplementary information (ESI) available. See DOI: 10.1039/c6ra27302e |
| This journal is © The Royal Society of Chemistry 2017 |

