 Open Access Article
Creative Commons Attribution 3.0 Unported Licence
Multifunctional chitosan modified Gd2O3:Yb3+,Er3+@nSiO2@mSiO2 core/shell nanoparticles for pH responsive drug delivery and bioimaging
Shanshan Huanga,
Ping'an Ma*a,
Ziyong Chenga,
Bei Liua,
Xiaoran Denga,
Zhongxi Xieac,
Jun Lin a and
Yanqiu Han*b
aState Key Laboratory of Rare Earth Resource Utilization, Changchun Institute of Applied Chemistry, Chinese Academy of Sciences, Changchun 130022, China. E-mail: mapa675@ciac.ac.cn
bDepartment of Neurology, No. 2 Hospital, Jilin University, Changchun 130041, P. R. China. E-mail: yanqiu9@hotmail.com
cUniversity of Science and Technology of China, Hefei 230026, P. R. China
First published on 6th February 2017
Abstract
Gd2O3:Yb3+,Er3+@nSiO2@mSiO2 (Gd@mSi) core/shell structure nanospheres were synthesized through a sol–gel method. Then biocompatible polysaccharide chitosan (CS) was grafted onto the surface of the nanoparticles to fabricate a pH responsive CS@Gd@mSi system. Furthermore, cancer targeting ligand folic acid (FA) was modified through the abundant amino groups on the chitosan polymer shell. The nanospheres with a Gd2O3:Yb3+,Er3+ core can be candidates for T1-weighted magnetic resonance imaging (MRI) contrast agents. The CS decorated nanocomposites showing good biocompatibility and red emission under 980 nm laser excitation can be potential candidates for bioimaging in vitro. FA modified nanospheres loaded with doxorubicin hydrochloride (DOX) show higher cytotoxicity for HeLa cells in vitro compared with those nanoparticles with chitosan shells only and pure DOX. The CS@Gd@mSi system can be a potential drug carrier with MRI, UCL, and finely controlled pH-dependent drug release properties.
Introduction
In recent years, pH-responsive drug delivery systems were designed and synthesized for controlled release of the drug at targeting sites and for reducing the toxicity for normal tissues.1–3 Most tumor tissues have an acidic microenvironment (pH = 6.0–7.0) compared with normal tissues and the blood stream (pH 7.4).4 The different pH values in endosomal (pH = 5.5–6.5) and lysosomal (pH = 4.5–5.5) compartments of cells enable the delivery system to have a precise pH dependent manner.5,6 pH-responsive drug delivery systems based on MSN have been fabricated using polymers,7,8 polyelectrolytes9 and acid-decomposable nanoparticles10,11 as pore blockers. Natural polymers such as gelatin,12 chitosan13 and alginate14,15 have been reported for the application of pH controlled drug release systems.Chitosan have been widely studied in biomedical applications based on its biocompatibility, biodegradability, bioactivity, antibacterial activity and the decoration of particles with specific ligands.16 Due to the abundant amino groups on the chains of the polymer, chitosan shows pH-sensitive features and has been used in drug delivery systems.17 The coating of chitosan was realized through various methods. MCM-41 type mesoporous silica nanoparticles (MSNs) decorated with chitosan have been synthesized based on the phosphoramidate chemistry18 and cross-linking reactions.19 Monodispersed chitosan–silica hollow nanospheres have been produced and investigated for delivering TNF-α to MCF-7 breast cancer cells under both in vitro and in vivo conditions.20 A biodegradable mesoporous chitosan–silica hybrid pH-responsive system has been synthesized by self-assembly of non-toxic F127 Pluronic non-ionic surfactant, biodegradable chitosan and silica source forming “NH2–Zn–DNR (daunorubicin)” coordination architecture.21
Gd2O3 nanoparticles have been widely studied for the existence of seven unpaired electrons in the 4f orbitals of Gd3+ ions can be used as effective imaging contrast agents in NMR imaging.22,23 Our group had synthesized composite composed of ordered mesoporous silica encapsulating Gd2O3:Eu3+ down-conversion luminescence nanoparticles24 and Gd2O3:Er3+ up-conversion luminescence nanoparticles25 with core shell structures and good biocompatibility as drug carriers. Though chitosan coated MSNs have been synthesized, upconversion luminescent Gd2O3:Yb3+,Er3+@nSiO2@mSiO2 decorated with chitosan have rarely been reported.
Based on our previous reports, we first synthesized Gd2O3:Yb3+,Er3+@nSiO2@mSiO2 nanoparticles with diameter of about 300 nm, then chitosan was coated onto the as-synthesized nanoparticles to realize the finely tuning the release of DOX response to the different pH environment. Folic acid was introduced to the chitosan due to the amino groups of the polymer as cancer targeting ligand. The anticancer drug doxorubicin (DOX) was loaded in the pores of the composite to investigate the pH-responsive controlled release behavior and cytotoxicity for HeLa cells. It was demonstrated that the DOX loaded CS@Gd@mSi and CS-FA@Gd@mSi system could be potential candidate for drug delivery in vitro.
Experimental section
Chemicals and materials
Rare earth oxides of Gd2O3 (99.99%), Yb2O3 (99.99%), and Er2O3 (99.99%) were purchased from the Science and Technology Parent Company of the Changchun Institute of Applied Chemistry. Tetraethyl orthosilicate (TEOS, 99%), cetyltrimethylammonium bromide (CTAB), ethanol (EtOH), hydrochloric acid (HCl), NaOH were purchased from the Beijing Yili Fine Chemical Regent Company (P. R. China). Doxorubicin hydrochloride (DOX) was purchased from Nanjing Duobo Chemical Limited Company (China). Chitosan (CS, medium molecular weight), folic acid (FA, ≥97%), N-(3-dimethylaminopropyl)-N-ethylcarbodiimide hydrochloride (EDC, 98%), N-hydroxysuccinimide (NHS, 98%), (3-glycidyloxypropyl)trimethoxysilane (GPTMS) and 3-[4,5-dimethylthiazol-2-yl]-2,5-diphenyl tetrazolium bromide (MTT) were purchased from Aldrich. The rare earth chlorides YCl3, YbCl3 and ErCl3 were prepared by dissolving the corresponding rare earth oxides in HCl at elevated temperature followed by evaporating the solvent under vacuum. Deionized water was used in all experiments and to prepare all buffers.Synthesis of Gd2O3:Yb3+,Er3+@nSiO2@mSiO2
The Gd0.80Yb0.17Er0.03(OH)CO3 spheres were prepared according to the previous report with some modification.24,25 1 mL of Gd0.80Yb0.17Er0.03Cl (1 M) and 1.5 g of urea were dissolved in 50 mL of deionized water. The above solution was stirring at room temperature for several minutes and then reacted at 90 °C for 2 h in water bath. The sample was separated by centrifugation and collected after washing with deionized water.The Gd2O3:Yb3+,Er3+@nSiO2@mSiO2 nanocomposite was prepared based on the previous report with some modification.24,25 In a typical procedure, the as-prepared Gd0.80Yb0.17Er0.03(OH)CO3 nanoparticles were treated with ethanol by ultrasonication for 30 min. Subsequently, the treated nanoparticles were separated by centrifugation, and then well dispersed in a mixture of ethanol (40 mL), deionized water (10 mL), and concentrated ammonia aqueous solution (28 wt%, 0.5 mL). TEOS (0.015 g) was then added dropwise to the solution. After stirred for 6 h, the products were separated by centrifugation and washed with ethanol and water, and then redispersed in a mixed solution containing cetyltrimethylammonium bromide (CTAB) (0.15 g), deionized water (40 mL), concentrated ammonia aqueous solution (28 wt%, 0.6 mL), and ethanol (30 mL). The resulting solution was stirred for 30 min. TEOS (0.2 g) was then added dropwise to the solution with stirring. After another stirring for 6 h, the products were collected and separated by centrifugation, washed with ethanol and water several times, and dried in air at 80 °C for 24 h and calcined at 550 °C for 6 h. Finally, the CTAB-removed product was denoted as Gd@mSi.
Preparation of chitosan coated Gd@mSi and folic acid modified CS@Gd@mSi
Chitosan coated Gd2O3:Yb3+,Er3+@nSiO2@mSiO2 was prepared based on previous report with modification.19,20 0.5 g of chitosan was dissolved in 50 mL of 1% aqueous solution of acetic acid. After magnetic stirring overnight at room temperature and filtration, a transparent solution of chitosan (1% w/v) was formed. 30 mg of Gd@mSi powders were dispersed in 5 mL of ethanol ultrasonically for 10 min followed by addition of acetic acid to make pH 4.5. 300 μL of GPTMS was then quickly injected into the dispersion and stirred at room temperature for 2 h. Afterward, 15 mL of chitosan solution was injected into the mixtures and stirred at room temperature for 24 h to obtain CS@Gd@mSi. After centrifugation and rinsing with deionized water and EtOH, these CS@Gd@mSi were freeze dried overnight to obtain the final product.As the chitosan polymer own abundant amino groups, cancer cell targeting ligand folic acid was conjuncted onto the chitosan shell. 5 mg of CS@Gd@mSi were suspended in 2 mL dimethyl sulfoxide (DMSO) and sonicated for 10 min. 2 mg FA, 3.2 mg EDC and 2.2 mg NHS were dissolved in 2 mL DMSO and added into the above mixture and stirred overnight at room temperature. The materials were recovered by centrifugation and washed twice with DMSO and ethanol. The obtained sample was denoted as CS-FA@Gd@mSi.
In vitro cell viability of CS@Gd@mSi
The Dulbecco's modified Eagle's medium (DMEM) contains 55 mL fetal bovine serum (FBS), 30 mg penicillin, 50 mg streptomycin and 500 mL medium. L929 fibroblast cells were purchased from the cell bank, Chinese Academy of Science, China. About 8000 L929 fibroblast cells were cultured in 100 mL DMEM per well in a 96-well plate at 37 °C in a humidified 5% CO2 atmosphere for 24 h to make the cells attach to the plate. CS@Gd@mSi and CS-FA@Gd@mSi NPs were diluted at the concentrations of 6.25, 12.5, 25, 50, 100 and 200 μg mL−1, respectively. Then, 100 μL of the above solution was added to different columns of the plate. As a control, 100 μL pure DMEM free nanoparticles was added to the last column. The cells were incubated at 37 °C in 5% CO2 for another 24 h. After that, 20 μL of MTT solution was added into each well and cultivation was continued. After 4 h, the supernatant from incubation was removed and 150 μL of DMSO was added to each well. Finally, the 96-well plate was placed in a Versamax microplate reader to monitor the absorbance at the wavelength of 490 nm. The cell viability was obtained by comparing to the control values.The vitro drug loading and pH-controlled release
DOX, a typical and widely used chemotherapeutic drug for cancer treatment, was chosen as a model drug for the drug loading and release experiment. The typical process for DOX loading was as follows: first, 5 mg of CS@Gd@mSi were dispersed in an aqueous solution of DOX (3 mL, 1.0 mg mL−1) and the pH value of this mixture was adjusted to 4.0 with a 0.1 M aqueous solution of HCl. After shaking for 24 h in the dark, a 0.1 M aqueous solution of NaOH was added to adjust the pH value of the mixture to 7.4 and the mixture was stirred for a further 2 h. Then, the DOX-loaded CS@Gd@mSi (denoted as DOX-CS@Gd@mSi) were collected by centrifugation and washed. The supernatant was collected to determine the drug loading by UV/Vis spectrophotometry at λ = 480 nm. The loading content was calculated by the following equation: drug loading content (%) = (weight of drug in CS@Gd@mSi/weight of drug loaded CS@Gd@mSi) × 100%. The DOX loading of CS-FA@Gd@mSi was similar to the above process. For in vitro DOX releasing, the DOX loaded sample was suspended in 2 mL phosphate buffer solution (PBS), the suspension was shaken at 37 °C in buffers with different pH values (pH 4.0, 5.0, 6.0 and 7.4). At predetermined time intervals, the suspensions were centrifuged and the supernatant was withdrawn for analysis and replaced with an equal volume of fresh medium. The amount of released DOX was determined using UV-Vis spectrophotometer at a wavelength of 480 nm.In Vitro cytotoxicity of CS@Gd@mSi against HeLa cells
The in vitro cytotoxicities of CS@Gd@mSi and CS-FA@Gd@mSi were assayed against HeLa cells. HeLa cells were plated out in 96-well plates at a density of 8000 cells per well and were allowed to attach and grow for 24 h. CS@Gd@mSi and CS-FA@Gd@mSi, DOX-CS-FA@Gd@mSi, DOX-CS@Gd@mSi and free DOX were added to the medium and the cells were incubated in 5% CO2 at 37 °C for 24 h. The concentrations of DOX were 1.5625, 3.125, 6.25, 12.5, 25.0 and 50.0 μg mL−1. At the end of the incubation, the media containing the nanocomposites was removed and MTT solution (20 μL) was added to each cell and incubated for another 4 h. The supernatant in each well was aspirated, DMSO (150 μL) was added to each well before the plate was examined by using a microplate reader (Thermo Multiskan MK3) at a wavelength of λ = 490 nm.For quantification of the cell uptake of the nanoparticles, HeLa cells were plated out in 6-well plates at a density of 2 × 10⁵ cells per well and were allowed to attach and grow for 24 h. These cells were then incubated with CS@Gd@mSi (100 μg) and CS-FA@Gd@mSi (100 μg) at 37 °C for 1 h and 4 h. After washing with PBS three times, cells were lysed by cell lysis buffer. Gadolinium content in the cell lysis solution was measured by ICP-OES.
In vitro MRI assay
The MRI measurements were performed in on Huantong 1.2 T MR scanner for small animal imaging system (Shanghai, China). CS@Gd@mSi was dispersed in water at various Gd concentrations. T1 was acquired using an inversion recovery sequence. T1 measurements were performed using a nonlinear fit to changes in the mean signal intensity within each well as a function of TR using the provided quantification software. Finally, the r1 relaxivity value was determined through the curve fitting of 1/T1 relaxation time (s−1) vs. the Gd concentration (mM).UCL imaging of CS@Gd@mSi
The instrument of upconversion luminescence microscopy (UCLM) was rebuilt on an inverted fluorescence microscope (Nikon Ti–S), and an external continuous wave (CW) λ = 980 nm laser diode was illuminated on the samples. UCL imaging of HeLa cells (5 × 10⁴ per well) were seeded in 6-well culture plates and grown overnight as a monolayer and incubated with CS@Gd@mSi and CS-FA@Gd@mSi at 37 °C for 1 h and 4 h. Finally, the cells were washed with PBS three times, fixed with 2.5% formaldehyde at 37 °C for 10 min, and then washed with PBS three times.Characterization
Powers X-ray diffraction (XRD) measurements were performed on a D8 Focus diffractometer (Bruker) with use of Cu Kα radiation (λ = 0.15405 nm). The morphologies of the samples were obtained using a field emission scanning electron microscope (FE-SEM, S-4800, Hitachi). Transmission electron microscopy (TEM) micrographs were obtained from a FEI Tecnai G2 S-Twin transmission electron microscope operating at an acceleration of 200 kV. Nitrogen adsorption/desorption analysis was measured using a Micromeritics ASAP 2020 M apparatus. The specific surface area was determined by the Brunauer–Emmett–Teller (BET) method using the data between 0.05 and 0.35. The pore volume was obtained from the t-plot method. Pore size distribution was estimated from the adsorption branch of the isotherm by the Barrett–Joyner–Halenda (BJH) method. The UC emission spectra were obtained by using a 980 nm laser diode as the excitation source. The emission spectra were dispersed by a monochromator of the Acton Spectra Pro-2758 equipped with R928 PMT, and the data were recorded from 400 to 700 nm. All the measurements were performed at room temperature. The photos of upconversion luminescence were obtained digitally on a Nikon multiple CCD camera (DS-Ri1). The T1-weighted images were acquired on Huantong 1.2 T MR scanner for small animal imaging system (Shanghai, China) with the following parameters: TR = 2500 ms, TE = 19.2 ms. The UV-vis adsorption spectral values were measured on a U-3310 spectrophotometer. Thermogravimetry (TG) and differential scanning calorimetry (DSC) was carried out on a Netzsch Thermoanalyzer STA 449F3 instrument in an ambient environment with a heating rate of 10 °C min−1 from room temperature to 800 °C. Inductively Coupled Plasma Optical Emission Spectrometer (ICP-OES) was taken on an iCAP 6300 of Thermo scientific. The dynamic light scattering (DLS) were measured using a Malvern Zetasizer Nano ZS 90.Results and discussion
Scheme 1 demonstrates the synthesis process of the multifunctional nanocomposites. Firstly, Gd2O3:Yb3+,Er3+@nSiO2@mSiO2 core/shell nanoparticles were synthesized. Then, chitosan molecules were coated onto the nanospheres via the GPTMS conjunction. As the amino groups existing on the chitosan, targeting molecules folic acid were grafted onto the nanocomposites. The pH responsive release profiles of the drug delivery system were investigated. The Gd2O3:Yb3+,Er3+ core of the structure made it candidates for UCL in cell imaging and MRI.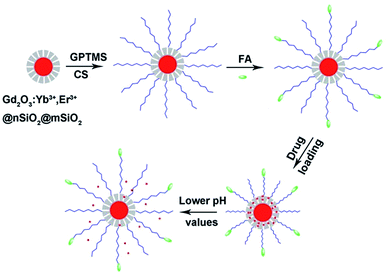 | ||
| Scheme 1 The fabrication process and pH responsive drug delivery of the multifunctional nanocomposites. | ||
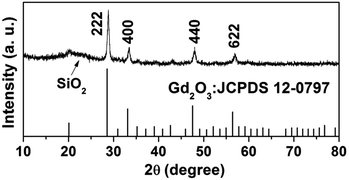
The wide-angle XRD pattern of the Gd2O3:Yb3+,Er3+@nSiO2@mSiO2 after calcination was shown in Fig. 1. The broad band at 2θ = 22° can be attributed to the amorphous SiO2 (JCPDS 29-0085). The diffraction peaks at 2θ = 20.12° (211), 28.62° (222), 33.15° (400), 47.64° (440), 56.46° (622) can be indexed to phase for Gd2O3 (JCPDS no. 12-0797), which suggest that Gd2O3:Yb3+,Er3+ particles were well retained in the silica matrix.
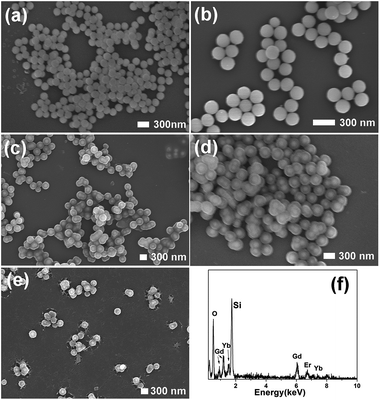
As can be seen in Fig. 2, the as-synthesized Gd(OH)CO3:Yb3+,Er3+ consists of monodisperse nanospheres with a mean particle size of 200 nm. These particles with smooth surface show non-aggregation and narrow size distribution. Gd(OH)CO3:Yb3+,Er3+@nSiO2 with a solid silica layer was prepared through a modified Stöber procedure. The formation of mesoporous silica layer on the Gd(OH)CO3:Yb3+,Er3+@nSiO2 was performed by using CTAB as the organic template. After calcination at 550 °C for 6 h, the template removed samples was obtained and designated as Gd2O3:Yb3+,Er3+@nSiO2@mSiO2. The SEM images of the sample demonstrated that the particles owning uniform size and shape. After the coating of chitosan, the thin layer of chitosan can be seen in Fig. 2e, which confirms the successful introduction of the polymer. The EDX spectra in Fig. 2f confirmed the existence of Gd, Yb, Er and Si elements.
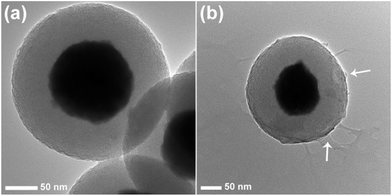
The TEM image of Gd2O3:Yb3+,Er3+@nSiO2@mSiO2 shows the core shell structure clearly because of the different electron penetrability between the solid Gd2O3:Yb3+,Er3+ core and mesoporous silica shell (Fig. 3). The Gd2O3:Yb3+,Er3+ cores are black spheres with mean diameter of about 150 nm, and the silica shell shows gray color with an average thickness of 50 nm. Ordered mesopore channels are found to be perpendicular to the sphere's surface. The chitosan thin layer can be seen clearly outside of the mesoporous silica. What's more, the mesopore channels can still be observed after the conjunction of the chitosan polymer. The DLS results are in agreement with the images shown in the SEM and TEM. The hydrodynamic diameter of CS@Gd@mSi varied from 317, 335, 342, 368 nm with pH (7.4, 6.0, 5.0, 4.0). It can be seen that the dimensions of the nanocomposites increased when the pH was lowered. The pH decrease of the PBS may lead to the protonation of the chitosan chains and induce the swelling of the nanocomposites.26
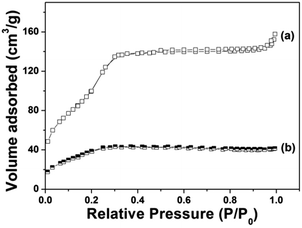
Fig. 4 demonstrates the N2 adsorption/desorption isotherm of Gd@mSi. The sample exhibited typical type IV isotherms, which confirm the presence of uniform mesoporous channels. The BET surface area of Gd@mSi is 441 m2 g−1, the pore volume is 0.29 cm3 g−1 and the average pore size of the sample is about 2.37 nm. This result indicates that the synthesized composites possess mesopore channels and space for the loading and entrance of drug molecules. According to the pore diameter and pore structure of the sample, we choose DOX which can be transported freely as the model drug. After the coating of chitosan, the BET surface and the pore volume of the sample decreased to 28.2 m2 g−1 and 0.03 cm3 g−1, respectively.
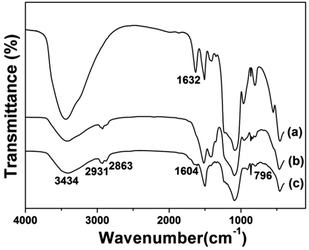
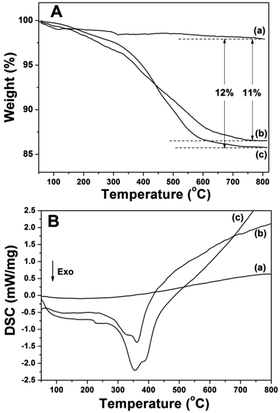
Fig. 5 displays the FTIR spectra of the prepared samples. All the samples displayed the stretching vibrations of Si–O–Si around 1084 cm−1 and 801 cm−1. CS@Gd@mSi show 2931, 2863 cm−1 ascribed to C–Hx stretching vibrations of alkyl groups after the coating of chitosan.15 This result indicated that chitosan had been grafted onto the surface of the particles through the GPTMS bridge. CS-FA@Gd@mSi shows peak at 1604 cm−1 ascribed to the N–H bending vibration of the CONH group, which confirmed the successful introduction of folic acid.27 The thermogravimetry analysis curves of the CS@Gd@mSi and CS-FA@Gd@mSi show 11%, 12% weight loss compared with the bare Gd@mSi nanoparticles, respectively (Fig. 6), which can be attributed to the degradation of chitosan molecules. These results can be further confirmed by the exothermic peaks in the range of 300–400 °C of the DSC curves for CS@Gd@mSi and CS-FA@Gd@mSi. While the Gd@mSi exhibited no exothermic peaks.
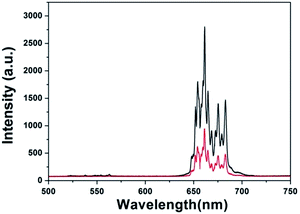
Fig. 7 shows the UCL spectrum of Gd@mSi under 980 nm laser excitation. The spectrum is composed of an intense band around 660 nm and some weak emission, which can be attributed to the 4F9/2–4I15/2 and 2H11/2/4S3/2–4I15/2 transitions of Er3+ ions,28 respectively. CS@Gd@mSi shows similar spectra with decreased intensities. The hydroxyl group possessing high-energy vibrational modes (2700–3600 cm−1) would quench the excited states of Er3+ ions by multiphonon relaxation and thus impact the upconversion processes.29–31 These results demonstrated that the chitosan coated particles can be potentially used for the cell imaging.
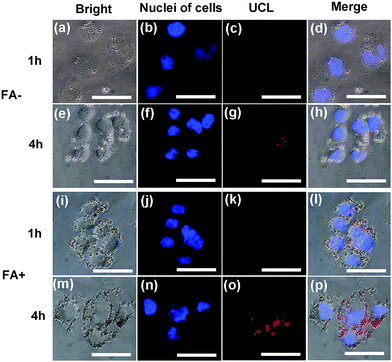
HeLa cells were incubated with the CS@Gd@mSi and CS-FA@Gd@mSi for 1 h and 4 h at 37 °C, and the luminescence images were taken with an external 980 nm laser as the excitation source. After rinsing with abundant PBS to remove surface-attached particles, the cells were investigated by UCLM (Fig. 8). The upconversion luminescence of the nanoparticles became brighter with increasing incubation time, which indicated that more and more nanoparticles were internalized into the cells. What's more, the UCL of CS-FA@Gd@mSi showed much brighter image compared with those nanoparticles without folic acid, which suggests that more CS-FA@Gd@mSi were internalized into HeLa cells.
To quantitatively evaluate the cell uptake of CS@Gd@mSi and CS-FA@Gd@mSi in HeLa cells, ICP-OES was used to measure the concentration of Gd3+ internalized by HeLa cells. The Gd3+ concentration for CS-FA@Gd@mSi in HeLa cells is measured to be 11.06, 13.92 μg mL−1 at 1 h and 4 h, respectively. While the values of Gd3+ concentrations for CS@Gd@mSi are 3.56 and 5.43 μg mL−1. Obviously, the uptake amount of CS-FA@Gd@mSi is almost 3 times as high as that of CS@Gd@mSi in HeLa cells. These results demonstrated that more and more nanoparticles were internalized into the HeLa cells with increasing time. What's more, it confirms that folic acid grafting is favorable for the cell uptake of the nanocomposites.32 It can be concluded that CS@Gd@mSi and CS-FA@Gd@mSi can be used as an excellent luminescence probe for cell imaging and monitoring the cell endocytosis process.
T1 relaxation time was measured in aqueous dispersions with different Gd3+ concentrations to evaluate the potential application of CS@Gd@mSi. As shown in Fig. 9, the longitudinal relaxivity (r1) was estimated to be 1.19 s−1 mM−1 from the slope of the relaxation rate (1/T1) as a function of Gd3+ concentration. The representative T1 weighted MR images of the CS@Gd@mSi suspensions clearly showed positive signal enhancement of the effect on T1-weighted sequences as the Gd3+ concentration increased, leading to brighter images. Compared with the previous reports, the longitudinal relaxivity (r1) value was in the same range with NaGdF4:Yb/Er@NaGdF4:Yb@mSiO2-PEG nanocomposites (0.83 s−1 mM−1).33 These results suggest that the as-prepared spheres could be employed as a potential T1 contrast agent.
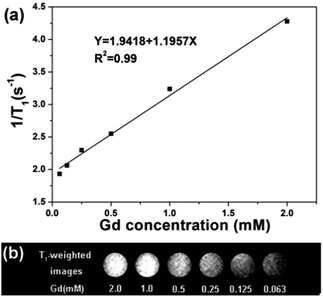 | ||
| Fig. 9 (a) Relaxation rate R1 (1/T1) versus various molar concentrations of CS@Gd@mSi dispersions at room temperature. (b) T1 weighted images of various molar concentrations of Gd3+ in CS@Gd@mSi. | ||
The loading content of DOX into the composites was determined to be 8.0%. In vitro drug release behavior of the DOX loaded samples in PBS with various pH values (4.0, 5.0, 6.0 and 7.4) were investigated. It can be seen from Fig. 10 that the release of DOX from DOX-CS@Gd@mSi increased with decreasing pH value of the media. The left side image in Fig. 10 exhibits the magnification of the drug release in 8 h. In the first 0.5 h the drug released in PBS with lower pH show higher initial burst release. The DOX released in PBS (pH = 4.0) reached 62% within 4 h, which is much higher than others. At pH 7.4, about 19% of DOX was released out from within 72 h, while around 49%, 55% and 70% of DOX was released at pH 6.0, 5.0 and 4.0, respectively. When DOX-CS@Gd@mSi was immersed in acidic buffer solution, the chitosan polymer chains became positively charged due to the protonated amino groups, which lead to the swelling of the chitosan layers and opening of the mesopore of the particles.20 The loaded DOX molecules could be quickly released from the channels of the sample and diffuse into the aqueous solutions. While, at relatively high pH value (pH 7.4), the deprotonated polymer chains of chitosan condensed and form a shielding layer that covered the porous surface of the particles. The DOX was blocked in the mesopores of the sample and the release of the DOX molecules become slower compared with those in lower pH values. Therefore, the release of DOX can be finely tuned by the chitosan polymer layer.
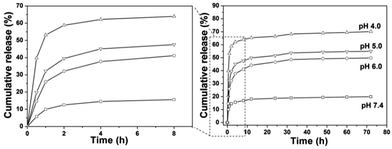 | ||
| Fig. 10 Cumulative release profiles of DOX from DOX-CS@Gd@mSi systems in PBS with different pH values. | ||
To evaluate the cytotoxicity and biocompatibility of CS@Gd@mSi and CS-FA@Gd@mSi, the standard MTT cell assay was performed on L929 fibroblast cells. As shown in Fig. 11, more than 90% cell viability can be observed in the whole concentration range of 6.25–200 μg mL−1 after 24 h incubation with CS@Gd@mSi and CS-FA@Gd@mSi. It can be concluded that these nanoparticles have good biocompatibility.
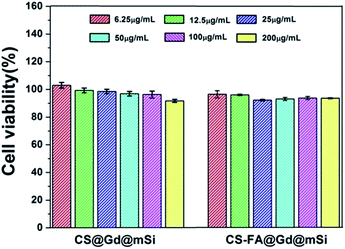 | ||
| Fig. 11 The L929 fibroblast cell viability after incubating with different concentrations of CS@Gd@mSi and CS-FA@Gd@mSi nanoparticles for 24 h. | ||
The cytotoxicity effects of CS@Gd@mSi, CS-FA@Gd@mSi and DOX loaded samples were further tested in vitro with the MTT assay (Fig. 12). For pure CS@Gd@mSi and CS-FA@Gd@mSi nanoparticles, HeLa cells were not impaired obviously with a concentration as high as 625 μg mL−1 after the 24 h culture, indicating the good biocompatibility of the as-prepared nanocomposites. HeLa cells were incubated in a culture medium containing free DOX, DOX-CS@Gd@mSi and DOX-CS-FA@Gd@mSi for 24 h at different DOX concentrations. The inhibitory concentration values for DOX, DOX-CS@Gd@mSi and DOX-CS-FA@Gd@mSi showed an increasing inhibition against HeLa cells with an increased concentration. The DOX-CS@Gd@mSi exhibited similar cytotoxicity to that of free DOX, whereas DOX-CS-FA@Gd@mSi showed the highest cytotoxicity in these cases (Fig. 12). This may be attributed to the fact that FA modified nanoparticles can be taken up via receptor-mediated endocytosis by HeLa cells and DOX molecules were released inside to induce cell death. Compared with CS@Gd@mSi, folic modified particles can be taken up more into HeLa cells, which results in more DOX molecules released in the cells. The IC50 (the concentration of drug required to reduce cell growth by 50%) values found at 24 h for HeLa cells were 3.18, 6.87, and 5.15 μg mL−1 for DOX-CS-FA@Gd@mSi, DOX-CS@Gd@mSi and free DOX, respectively. The IC50 value of DOX-CS-FA@Gd@mSi was lower than the pure DOX. This might be attributed to the efficient cellular uptake of the FA modified sample. The higher IC50 value of DOX-CS@Gd@mSi than pure DOX may be ascribed to its comparable drug effect for inducing cancer cell death while the side effect of DOX was greatly abated due to the encapsulation of the nanocomposites.34 Based on these results, the CS-FA@Gd@mSi can potentially be used as a vector to store and transport anti-cancer drugs, target cancer cells and enhance the efficacy of anti-cancer drug delivery.
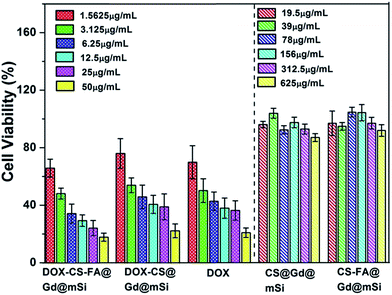 | ||
| Fig. 12 In vitro HeLa cell viabilities after incubation 24 h with CS@Gd@mSi, CS-FA@Gd@mSi, DOX-CS-FA@Gd@mSi, DOX-CS@Gd@mSi and pure DOX at different concentrations. | ||
Conclusions
Biocompatible chitosan polymer modified Gd2O3:Yb3+,Er3+@nSiO2@mSiO2 core/shell nanoparticles with uniform size were synthesized. The composite with Gd2O3:Yb3+,Er3+ core could be employed as an effective T1 contrast agent for MRI and a potential candidate for bioimaging because of showing red signals under the 980 nm laser excitation. The chitosan decorated sample show pH-dependent release, the release rate increase with decreasing pH values of the PBS. The chitosan decorated sample with folic acid loaded with DOX molecules shows higher cytotoxicity for HeLa cells in vitro. This multifunctional composite can be a potential drug delivery system with MRI, UCL, cell targeting and pH responsive drug release properties.Acknowledgements
This project is financially supported by the National Natural Science Foundation of China (NSFC 51402287, 51572257, 51672269, 51628201), National Basic Research Program of China (2014CB643803), Projects for science and technology development plan of Jilin province (20170414003GH).References
- H. P. Rim, K. H. Min, H. J. Lee, S. Y. Jeong and S. C. Lee, Angew. Chem., Int. Ed., 2011, 50, 8853–8857 CrossRef CAS PubMed.
- L. Yuan, Q. Tang, D. Yang, J. Z. Zhang, F. Zhang and J. Hu, J. Phys. Chem. C, 2011, 115, 9926–9932 CAS.
- Q. Gan, X. Lu, Y. Yuan, J. Qian, H. Zhou, X. Lu, J. Shi and C. Liu, Biomaterials, 2011, 32, 1932–1942 CrossRef CAS PubMed.
- I. F. Tannock and D. Rotin, Cancer Res., 1989, 49, 4373–4384 CAS.
- Q. Yang, S. H. Wang, P. W. Fan, L. F. Wang, Y. Di, K. F. Lin and F. S. Xiao, Chem. Mater., 2005, 17, 5999–6003 CrossRef CAS.
- H. J. Lee, S. E. Kim, I. K. Kwon, C. Park, C. Kim, J. Yang and S. C. Lee, Chem. Commun., 2010, 46, 377–379 RSC.
- R. Liu, P. H. Liao, J. K. Liu and P. Y. Feng, Langmuir, 2011, 27, 3095–3099 CrossRef CAS PubMed.
- L. Xing, H. Q. Zheng, Y. Y. Cao and S. A. Che, Adv. Mater., 2012, 24, 6433–6437 CrossRef CAS PubMed.
- F. Chen and Y. C. Zhu, Microporous Mesoporous Mater., 2012, 150, 83–89 CrossRef CAS.
- F. Muharnmad, M. Y. Guo, W. X. Qi, F. X. Sun, A. F. Wang, Y. J. Guo and G. S. Zhu, J. Am. Chem. Soc., 2011, 133, 8778–8781 CrossRef PubMed.
- S. S. Wu, X. Huang and X. Z. Du, J. Mater. Chem. B, 2015, 3, 1426–1432 RSC.
- Z. Zou, D. G. He, X. X. He, K. M. Wang, X. Yang, Z. H. Qing and Q. Zhou, Langmuir, 2013, 29, 12804–12810 CrossRef CAS PubMed.
- Q. Gan, J. Y. Zhu, Y. Yuan, H. L. Liu, J. C. Qian, Y. S. Lib and C. S. Liu, J. Mater. Chem. B, 2015, 3, 2056–2066 RSC.
- W. Feng, W. Nie, C. L. He, X. J. Zhou, L. Chen, K. X. Qiu, W. Z. Wang and Z. Q. Yin, ACS Appl. Mater. Interfaces, 2014, 6, 8447–8460 CAS.
- Y. J. Yang, X. Tao, Q. A. Hou, Y. Ma, X. L. Chen and J. F. Chen, Acta Biomater., 2010, 6, 3092–3100 CrossRef CAS PubMed.
- A. Hakeem, R. X. Duan, F. Zahid, C. Dong, B. Y. Wang, F. Hong, X. W. Ou, Y. M. Jia, X. D. Lou and F. Xia, Chem. Commun., 2014, 50, 13268–13271 RSC.
- M. Zhang, J. Liu, Y. Kuang, Q. L. Li, H. Y. Chen, H. F. Ye, L. Guo, Y. L. Xu, X. Q. Chen, C. Li and B. B. Jiang, J. Mater. Chem. B, 2016, 4, 3387–3397 RSC.
- A. Popat, J. Liu, G. Q. Lu and S. Z. Qiao, J. Mater. Chem., 2012, 22, 11173–11178 RSC.
- X. X. Hu, Y. Wang and B. Peng, Chem.–Asian J., 2014, 9, 319–327 CrossRef CAS PubMed.
- Z. W. Deng, Z. P. Zhen, X. X. Hu, S. L. Wu, Z. S. Xu and P. K. Chu, Biomaterials, 2011, 32, 4976–4986 CrossRef CAS PubMed.
- H. Q. Zheng, Z. H. Huang and S. N. Che, Dalton Trans., 2012, 41, 5038–5044 RSC.
- K. Y. Ni, Z. H. Zhao, Z. J. Zhang, Z. J. Zhou, L. Yang, L. R. Wang, H. Ai and J. H. Gao, Nanoscale, 2016, 8, 3768–3774 RSC.
- M. W. Ahmad, W. Xu, S. J. Kim, J. S. Baeck, Y. Chang, J. E. Bae, K. S. Chae, J. A. Park, T. J. Kim and G. H. Lee, Sci. Rep., 2015, 5, 8549 CrossRef CAS PubMed.
- Z. H. Xu, Y. Gao, S. S. Huang, P. A. Ma, J. Lin and J. Y. Fang, Dalton Trans., 2011, 40, 4846–4854 RSC.
- Z. H. Xu, C. X. Li, P. A. Ma, Z. Y. Hou, D. M. Yang, X. J. Kang and J. Lin, Nanoscale, 2011, 3, 661–667 RSC.
- L. Sun, X. G. Zhang, J. X. An, C. Su, Q. Q. Guo and C. X. Li, RSC Adv., 2014, 4, 20208–20215 RSC.
- Y. F. Zhu, Y. Fang and S. Kaskel, J. Phys. Chem. C, 2010, 114, 16382–16388 CAS.
- G. Jia, H. You, Y. Song, Y. Huang, M. Yang and H. Zhang, Inorg. Chem., 2010, 49, 7721–7725 CrossRef CAS PubMed.
- J. W. Zhao, Y. J. Sun, X. G. Kong, L. J. Tian, Y. Wang, L. P. Tu, J. L. Zhao and H. Zhang, J. Phys. Chem. B, 2008, 112, 15666–15672 CrossRef CAS PubMed.
- Y. F. Wang, W. Xu, Y. S. Zhu, S. Xu, H. N. Cuib and H. W. Song, J. Mater. Chem. C, 2014, 2, 4642–4650 RSC.
- H. Li, S. X. Song, W. Wang and K. Z. Chen, Dalton Trans., 2015, 44, 16081–16090 RSC.
- C. X. Li, Z. Y. Hou, Y. L. Dai, D. M. Yang, Z. Y. Cheng, P. A. Ma and J. Lin, Biomater. Sci., 2013, 1, 213–223 RSC.
- Y. Y. Chen, P. A. Ma, D. M. Yang, Y. Wu, Y. L. Dai, C. X. Li and J. Lin, Chem.–Asian J., 2014, 9, 506–513 CrossRef CAS PubMed.
- Z. Y. Hou, C. X. Li, P. A. Ma, Z. Y. Cheng, X. J. Li, X. Zhang, Y. L. Dai, D. M. Yang, H. Z. Lian and J. Lin, Adv. Funct. Mater., 2012, 22, 2713–2722 CrossRef CAS.
| This journal is © The Royal Society of Chemistry 2017 |

