 Open Access Article
Creative Commons Attribution 3.0 Unported Licence
A homogenous “signal-on” aptasensor for antibiotics based on a single stranded DNA binding protein-quantum dot aptamer probe coupling exonuclease-assisted target recycling for signal amplification†
Caiye wuab,
Ning Gan *b,
Changrong Ou*a,
Haiqing Tangc,
You Zhoub and
Jinxuan Caoa
aFaculty of Marine, Ningbo University, Ningbo, 315211, China. E-mail: ouchangrong@nbu.edu.cn; Fax: +86-574-8760998; Tel: +86-574-87609987
bFaculty of Material Science and Chemical Engineering, Ningbo University, Ningbo, 315100, China. E-mail: ganning@nbu.edu.cn
cSchool of Food Science and Technology, Zhejiang Pharmaceutical College, Ningbo, 315211, China
First published on 24th January 2017
Abstract
A novel fluorescent “signal-on” switch aptasensor based on a single stranded DNA binding protein (SSB) labeled quantum and exonuclease-assisted target recycling was designed for detecting antibiotics in homogeneous media. In this assay, streptomycin (STR) was employed as a model and the fluorescent probe was synthesized by labeling SSB on quantum dots (QDs–SSB). The SSB can specifically bind an aptamer. When an aptamer serving as a bridging ligand is added, it can hybrid with SSB. Meanwhile, the quantum dots dispersed in the solution were aggregated, which resulted in self-quenching of the QDs' fluorescence and its intensity decreased sharply and switched from “on” to “off”. When the fluorescent probe coexisted with STR and Exo I, the aptamer preferentially bound with a target, and the aptamer-target was digested into mononucleotides by Exo I. Then the liberated target could be further involved in the reaction cycling to produce a strong fluorescence signal. Consequently, the distance of QDs increased and the fluorescence intensity was recovered. Thus, the switch changed from the “off” state to “on”. Under optimized conditions, the assay indicates good linear relationship in a range from 0.1 to 100 ng mL−1 and the detection limit of STR was 0.03 ng mL−1 (S/N = 3). And after 8 times of detecting streptomycin, the fluorescence intensity of the system was still able to reach the initial 90.19% efficiency. In addition, this type of switch fluorescent probe provides a simple and specific approach for antibiotics detection especially suitable for a homogeneous system.
1 Introduction
Antibiotics with the ability to treat bacterial infections have been extensively used in medicine and agriculture. However, abuses of antibiotics in food products are a potential threat to human health, which could evoke serious allergic reactions.1–3 Consequently, establishing a simple and accurate approach to monitor antibiotics residues in food is urgently required. Unfortunately, traditionally reported techniques including gas chromatography (GC), high performance liquid chromatography (HPLC), liquid chromatography and mass spectrometry (LC-MS) suffer from tedious sample pretreatment and time-consuming and high technical demands.4–8 Enzyme-linked immunosorbent assay (ELISA) is portable, sensitive, and easy to manipulate.9,10 However, that assay is normally used for qualitative rather than quantitative analyses. Moreover, a probe based on an antibody is inexpensive which influenced its wide range of promotion. Thus, it is imperative to develop an alternative cheap, sensitive, and rapid method for detection of antibiotic residues.Fluorescence analysis has received extensive reviews due to its high sensitivity and ease of application. An aptamer is a kind of single strand DNA or RNA with a certain sequence, which is selected by the SELEX technique.11,12 It can be easily synthesized in vitro in large quantities using a Polymerase Chain Reaction (PCR); therefore, the cost can be greatly decreased and batch stability is excellent. Thus, PCR can be used to replace an expensive antibody for the development of florescent probe. Liu et al.13 developed a sensor using aptamer-DNA–quantum dots (QDs) for detecting cancer cells with high selectivity and sensitivity, but the probe could only be used once and the system was easily polluted. Wang et al.14 developed a novel aptamer–quantum dot fluorescence probe based on a DNA hybridization reaction for specific detection of antibiotics which was facile and sensitive. Previously our group designed a novel fluorescence aptasensor using an aptamer labeled on functionalized magnetic beads which could be used for detection of a target with high sensitivity and rapid response.15 However, with this method a fluorescence signal cannot be obtained in a homogeneous phase; thus, magnetic separation procedures were needed. Moreover, it could prolong measurement time and increase the complexity of the experiment. In view of these disadvantages of the method, we hoped to establish a type of fluorescence probe which could be employed for a homogeneous detection. Namely, when a target was added, the system generated a fluorescent signal excluding separation.
Furthermore, it's also desirable to develop the fluorescent “switch” probe based on labeling the aptamer with quantum dots. At this point, composite probes were prepared based on a hybridization reaction between the aptamer and its complementary strand.16–18 This meant that the signal labels successfully replaced must guarantee that the binding force of the DNA double chain was lower than the aptamer toward the target, whereas Du et al.19 reported the binding force of aptamer related to a complementary strand and target had a large kinetic barrier. This indicated that the detection process could not be completely realized. In addition, when the probe was synthesized, we had to design the length of the complementary chain according to the DNA sequence of a different aptamer. Consequently, the difficulty of designing the probe was enhanced, causing the experimental procedure to become increasingly complicated and time consuming. In view of the above issues, SSB was employed to connect the signal tag with a quenching component containing an aptamer of streptomycin to obtain the switch probe. The reason we choose SSB was that it can specifically bind to single stranded DNA without a coupling reagent,20 which meant that the probe labeled on the aptamer could combine with SSB. Moreover, SSB can tightly bind to free ssDNA rather than the duplex DNA,21 which showed that if the target was captured by the aptamer it would not combine with the SSB.
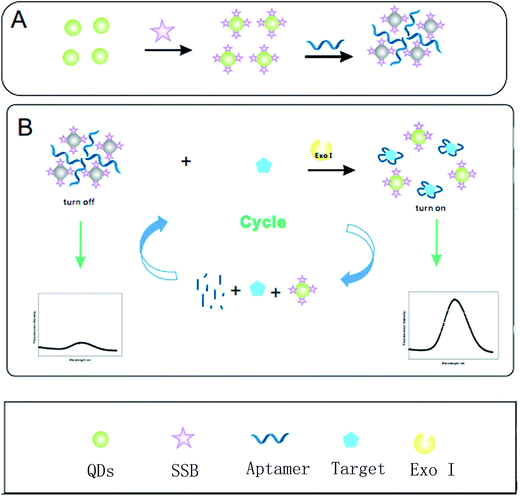
To further amplify the signals from fluorescent probes in order to increase detection sensitivity, a target recycling strategy based on exonuclease was proposed.22–24 An exonuclease is an enzyme which can decompose a nucleotide from 5′ to 3′ terminus and release a target involved in the next cycle. Above all, the signal amplified fluorescence switch assay was investigated to detect streptomycin based on SSB labeled on the QDs as a signal tag and Exo I-assisted target recycling. As shown in Fig. 1, SSB labeled on the surface of QDs supported as a signal tracer was gathered by the aptamer, which caused the fluorescence to be effectively quenched. After adding the target into the reaction system, the STR was captured preferentially by the aptamer. Subsequently, the QDs were re-dispersed into solution, contributing to the fluorescence recovery and the probe in the complexes changed the “turn on” state into “turn off”. Furthermore, the aptamer in a homogeneous medium can be decomposed by the Exo I to liberate the target. The released targets can combine with the aptamer again to trigger the next cycle. All the components for preparing a sensor can be easily achieved. In addition, this was employed for determination of STR in real milk samples to confirm practical utility.
2 Experimental
2.1 Materials, reagents and apparatus
The oligonucleotides were synthesized by Shanghai Sangon Biological Engineering Technology & Services Co., Ltd (Shanghai, China); the sequences of oligonucleotides are as follows:25 5′-GGG GTC TGG TGT TCT GCT TTG TTC TGT CGG GTCGT. The single strand DNA-binding protein was supplied by Promega Corporation (Madison, WI, USA). Amino CdSe quantum dots were obtained from WuHan JiaYuan Quantum Dot Co., Ltd (WuHan, China). The commercial STR ELISA kit was provided by Huaan Magnech Bio-tech Co., Ltd (Beijing, China). 1-Ethyl-3-[3-dimethylaminopropyl]carbodiimide hydrochloride (EDC/NHS) borate saline buffer (BR, pH 8.4, 13.7 M H3BO3, 5.6 M Na2B4O7·10H2O) was applied as diluent. Kanamycin (Kana), oxytetracycline (OTC) thiamphenicol (TAP), florfenicol (FF), and streptomycin were purchased from Sigma Company (Milan, Italy). All other chemicals used in the experiment were analytical grade and used without further purification. Double-distilled water was used for all the preparations.2.2 Apparatus
Fluorescence measurements were measured on an F-4600 spectrophotometer (Hitachi, Japan). Transmission electron microscopic (TEM) images were performed on a H600 transmission electron microscope (Hitachi, Japan). UV-vis spectra were obtained from a UV-1800 spectrophotometer (Shimadzu, Japan). The size distribution of nanoparticles was estimated with dynamic light scattering (DLS) measurements using a Zeta-sizer Nano ZS (Malvern Instruments, United Kingdom).2.3 Fabrication of fluorescent switch probe
The signal labels were prepared per previous reported methods with some modification.26 Borate saline buffer was utilized for dilution of the 4 μL 8 μM QDs in advance. EDC/NHS was introduced to couple the free amino and carboxylic acid groups. In brief, in the presence of 200 μL of 0.1 M EDC/NHS, 1 mg SSB was added to a diluted solution of QDs and reacted for 5 h. Subsequently, the conjugated QDs were obtained by centrifugation at 15![[thin space (1/6-em)]](https://www.rsc.org/images/entities/char_2009.gif) 000 rpm for 10 min and stored at 4 °C for further usage. The aptamer was then added to the prepared solution and the mixture was incubated for 1 h at room temperature. Finally, fluorescent switch probes were synthesized.
000 rpm for 10 min and stored at 4 °C for further usage. The aptamer was then added to the prepared solution and the mixture was incubated for 1 h at room temperature. Finally, fluorescent switch probes were synthesized.
2.4 Analytical procedure for STR
The fluorescence detection of STR is corroborated in Fig. 1. Concisely, to monitor the STR, 50 μL of various concentrations of STR were incubated with the probe for 1 h at room temperature to ensure complete reaction. A mixture with the fluorescence signal was determined at 525 nm by a fluorescent spectrophotometer for quantitative analysis. To avoid an interference of background signals, the normalization method was utilized to quantify the fluorescence intensity change rate using different concentrations of STR. The calculation is as follows:ΔI/ΔI0 is the fluorescence intensity change rate, I represents the fluorescence signal of the signal probe in the presence of STR, and I0 depicts the fluorescence signal of the signal probe.
2.5 Analytical procedure for STR
Several milk samples were purchased from a local market and kept at 4 °C until analysis. First, the milk samples (5 mL) were defatted using centrifugation for 15 min; subsequently, 150 μL 0.4 M sodium nitroprusside solution was added to the tubes for protein precipitation and the mixture was shaken on a mini-shaker for 1 min. Then, 150 μL 1.8 M zinc sulfate solution was added with centrifugation for 15 min at 4000 rpm. The supernatant was collected and dissolved in the complex solution provided with an ELISA kit and 50 μL portions were used for the test.3 Results and discussion
3.1 Characteristics of QDs
Morphology and structure of the QDs were evaluated by TEM. Fig. S1A,† exhibits a fluorescence signal with a different excitation wavelength and the peak position of the emission spectrum barely moved, which suggests the QDs dispersed in solution have excellent stability. As shown in Fig. S1B,† the QDs display good dispersion and uniform particle size and the inset of the DLS test shows a narrow size distribution of the QDs with an average diameter of 6 nm.3.2 Validation of the fluorescence switch probe and the detection mechanism
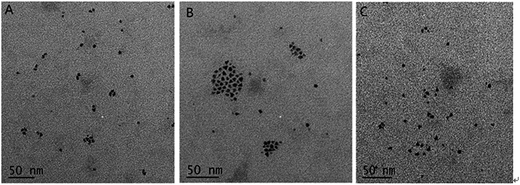
To confirm the detection principle, the QDS–SSB, QDs–SSB–Aptamer, QDs–SSB–Aptamer–STR, was characterized by a UV-vis spectrophotometry fluorescence spectrum and TEM, and the results are shown in Fig. 2. From the UV-vis absorption spectrum of QDs–SSB and QDs, we observed a characteristic absorption peak at 280 nm which was ascribed to SSB characteristic absorption (Fig. 2A). This indicated that SSB was successfully combined with QDS. The fluorescence response changes in the absence and presence of STR also were investigated. As indicated from Fig. 2B, it was found that the fluorescence was extensively quenched in the presence of the aptamer. In Fig. 3B, the TEM image of the QDS–SSB–Aptamer further manifested that the aptamer caused the aggregation of QDs and the state of the probe was “turn off”. Since the aptamer had high affinity and specificity to the target,27–29 then when the target was captured the aggregation of quantum dots would be scattered, which then caused fluorescence recovery. Fig. 2B reveals the fluorescence intensity was enhanced when STR was introduced into the mixture solution that included the QDs–SSB–Aptamer. Meanwhile, the disaggregation of QDs induced by STR was substantiated by the TEM image in Fig. 3C because when the STR was introduced the QDs were dispersed again. All these experimental results proved that the fluorescence switch probe was successfully fabricated.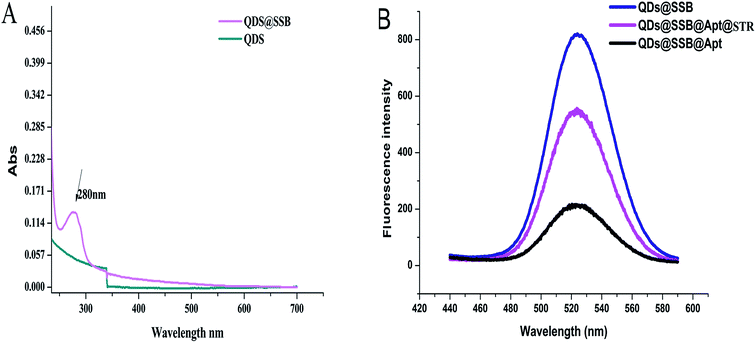 | ||
| Fig. 2 (A) UV-vis absorption spectrum of QDs and QDs@SSB; (B) fluorescence spectra of QDs@SSB, QDs@SSB@Apt, QDs@SSB@Apt@STR. | ||
3.3 Signal amplification performance of exonuclease I
To verify the results of signal amplification with exonuclease-assisted target circulation, fluorescence responses of the switch probe in the distinctive conditions were presented in Fig. S2.† Using the aptamer (curve a) and the random sequence (curve b) in a switch probe resulted in a low fluorescence signal. The fluorescence intensity of the random sequence was close to that of the aptamer, which can be ascribed to the specific recognition between the aptamer and STR rather than a random sequence. The fluorescence signal was further enhanced after the addition of STR (5 ng mL−1) and 35 U Exo I (curve d). There was a 2.0-fold fluorescence intensity higher than with the absence of Exo I (curve c), because the aptamer of STR released from SSB can be digested by Exo I. Then, the released targets can further be involved in the next reaction cycling to generate additional fluorescence signal. Moreover, these results verify the amplification ability of the proposed aptasensor.3.4 Optimization of the reaction conditions
To obtain the best analytical performance of the method, the incubation time between the switch probe and target, the concentration of QDs and SSB, and the incubation temperatures were investigated using STR (20 ng mL−1) as a model. As shown in Fig. S3A,† the concentrations of QDs were changed from 30 to 70 nM and the results suggested that the fluorescence responses of the system improved and then reached the saturated condition after 50 nM. Thus, 50 nM QDs was selected as the optimum condition. At this condition, the concentration of SSB was also exhibited in Fig. S3B† and the fluorescence signal achieved a maximum value at 35 μg mL−1. Other conditions such as the incubation time and incubation temperature are presented. With an increase in incubation time from 10 to 60 min, the maximum intensity value was obtained at 40 min. Besides, the effect of incubation temperature was also explored in Fig. S3D.† A temperature of 37 °C presented the highest fluorescence signal; hence, the temperature of 37 °C was chosen.3.5 Specificity and precision of the assay
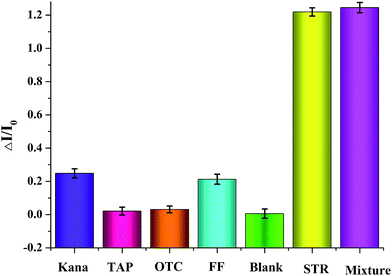
To further estimate the analytical performance of the proposed analysis, diverse similar antibiotics containing thiamphenicol (TAP), florfenicol (FF), oxytetracycline (OTC), and kanamycin (Kana) were employed. As shown in Fig. 4B, the solution including STR (20 ng mL−1) showed a much stronger signal, while the other antibiotics with an identical concentration of STR were observed to be relatively weaker. Moreover, the mixture including STR and the above 4 antibiotics was also utilized for interference experiments and the resulting signal nearly coordinated with the sample having STR alone. This result showed that there was no apparent cross reaction between streptomycin analogues and other antibiotics. In conclusion, the results indicated that the selectivity and specificity of the fluorescence switch probe for STR detection was acceptable.3.6 Analytical performance of the fluorescence switch probe
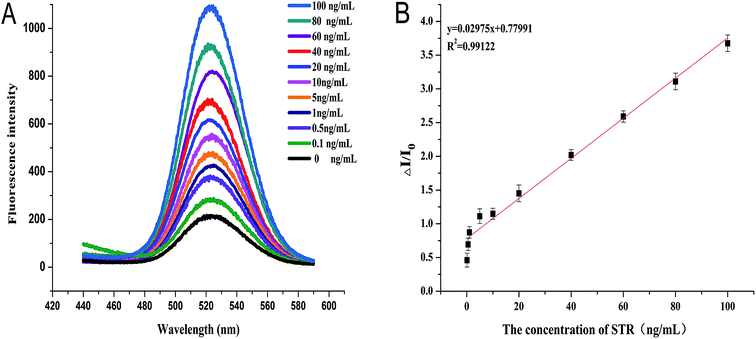
Under optimum conditions, sensitivity and detection range of streptomycin was quantified by measuring the emission peak of fluorescence at 525 nm. As shown in Fig. 5A, the calibration curve of STR was in the range from 0.01 ng mL−1 to 100 ng mL−1, and the fitting linear regression equation can be described as ΔI/ΔI0 = 0.02975x + 0.77991 with a correlation coefficient R2 = 0.99122 which exhibits a positive linear relationship (Fig. 5B). The precision of the method was evaluated through three repeated measurements of 4 ng mL−1 and 40 ng mL−1 STR respectively, and the relative standard deviation (RSD) was 2.82% and 3.25% (<5%). These results demonstrated that the proposed method has good sensitivity with detection limits of 0.03 ng mL−1 (S/N = 3).3.7 Analytical application
We compared the performance of this assay with reported methods in recent literature, and the results are shown in Table S1.† By contrast, all the listed methods in our strategy indicated a wider linear range and lower detection limits than others. Meanwhile, the linear concentration range achieved 4 orders of magnitude. Thus, these show that the proposed method in a homogenous phase without separation is not only simple and sensitive but also applicable to a wide range of concentrations.Feasibility of the applied strategy was evaluated using several milk samples. Results presented in Table 1 were almost in accordance with the ELISA method without significant difference (T-test). The accuracy of detection with STR in milk samples was also measured by determining its recovery through a criterion addition method. As shown in Table 1, the recoveries for STR were all between 90.4% and 101.0%. These results distinctly imply that the fluorescence switch probe is applicable to the detection of antibiotics in milk samples.
| Sample | Blank concentration (ng mL−1) | Added concentration (ng mL−1) | Proposed method | ELISA method (ng mL−1) | Recovery |
|---|---|---|---|---|---|
| 1 | 0.11 | 0.50 | 0.56 ± 0.041 | 0.43 ± 0.013 | 91.8 |
| 0.11 | 1.0 | 1.10 ± 0.026 | 1.20 ± 0.032 | 99.0 | |
| 2 | 0.046 | 0.50 | 0.40 ± 0.023 | 0.48 ± 0.065 | 90.4 |
| 0.046 | 1.0 | 1.05 ± 0.095 | 1.04 ± 0.038 | 100.4 | |
| 3 | 0 | 0.50 | 0.45 ± 0.082 | 0.37 ± 0.048 | 91.0 |
| 0 | 1.0 | 1.01 ± 0.160 | 0.98 ± 0.281 | 101.0 |
3.8 The repeatability of the fluorescence switch probe
To evaluate reproducibility of the fluorescence switch probe, the results are shown in Fig. S4.† For the first measurement, the fluorescence switch probe can be formed again by introducing the aptamer, which causes fluorescence to be quenched in the homogeneous system and then triggers extreme signal generation by the introduction of STR. Afterwards, the system was sustained after eight more times and the detection signal could still reach the original 90.19% effectiveness. Intra-day and inter-day precision values were 8.53% and 5.34% respectively, which absolutely certified that the “switch” probe can be recycled.4 Conclusions
A sensitive, homogeneous fluorescent switch aptasensor based on a single stranded DNA binding protein labeled quantum dot and Exo I-assisted targets recycling amplification strategy was developed for specific detection of antibiotics. In the presence of Exo I, the recycling process is triggered and a large amount of targets is released, which endows the high sensitivity of the developed aptasensor. In this strategy, the detection process does not require sophisticated experimental techniques and the assay occurs in a homogeneous phase; also it avoids phase separation and washing steps which are normally needed in probes' reactions with targets. Furthermore, the proposed method can be extended for detection of other small molecular targets just by changing the corresponding aptamer. More inspiringly, our strategy may serve as a promising avenue to detect small molecules like pollutants in analyses involving food safety.Acknowledgements
This work was supported by the National Natural Science Foundation of China (No. 31271890), the Natural Science Foundation of Zhejiang (LY 16B050003, Y15B050002, Q17B010002), the Natural Science Foundation of Ningbo (2016A610084), Zhejiang Open Foundation of the Most Important Subjects (No. xkzsc1428), Scientific research fund of Ningbo University (No. xkzsc1524) and the K. C. Wong Magna Fund in Ningbo University.References
- A. Wang, L. Zhang and Y. Fang, Anal. Chim. Acta, 1999, 394, 309–316 CrossRef CAS.
- W. Witte, Science, 1998, 279, 996–997 CrossRef CAS PubMed.
- M. H. Lee, H. J. Lee and P. D. Ryu, Asian-Australas. J. Anim. Sci., 2001, 14, 402–413 CrossRef CAS.
- Y. B. Miao, N. Gan, T. H. Li, H. Z. Zhang, Y. T. Cao and Q. L. Jiang, Sens. Actuators, B, 2015, 220, 679–687 CrossRef CAS.
- E. Ju, Z. Liu, Y. Du, Y. Tao, J. Ren and X. Xu, ACS Nano, 2014, 8, 6014 CrossRef CAS PubMed.
- M. Chen, N. Gan, H. Zhang, Z. D. Yan, T. H. Li, Y. Chen, Q. Xu and Q. Jiang, Microchim. Acta, 2015, 183, 1 CrossRef PubMed.
- L. Sun, R. G. M. Spencer, P. J. Hernes, R. Y. Dyda and K. Mopper, Limnol. Oceanogr.: Methods, 2015, 13, 1–8 CrossRef CAS.
- K. Prabakar and J. P. Imperial, Journal of Interdisciplinary Research, 2016, 2, 1329–1339 Search PubMed.
- A. Y. Kolosova, J. V. Samsonova and M. Egorova, Food Agric. Immunol., 2000, 12, 115–125 CrossRef CAS.
- N. A. Byzova, E. A. Zvereva, A. V. Zherdev, S. A. Eremin and B. B. Dzantiev, Talanta, 2010, 81, 843–848 CrossRef CAS PubMed.
- C. K. O'Sullivan, Anal. Bioanal. Chem., 2002, 372, 44 CrossRef PubMed.
- I. Mihai, A. Vezeanu, C. Polonschii, C. Albu, G. L. Radu and A. Vasilescu, Sens. Actuators, B, 2015, 206, 198 CrossRef CAS.
- H. Liu, S. Xu, Z. He, A. P. Deng and J. J. Zhu, Anal. Chem., 2013, 85, 3385 CrossRef CAS PubMed.
- Y. Wang, N. Gan, T. Li, Y. Cao, F. Hu and Y. Chen, Anal. Methods, 2016, 8, 3006 RSC.
- Y. B. Miao, H. X. Ren, N. Gan, Y. Cao, T. Li and Y. Chen, Biosens. Bioelectron., 2016, 81, 454 CrossRef CAS PubMed.
- J. Y. Park, T. S. Lee, I. H. Song, Y. L. Cho, J. R. Chae, M. Yun, H. Kang, J. H. Lee, J. H. Lim, W. G. Cho and W. G. Kang, Biomaterials, 2016, 100, 143–151 CrossRef CAS PubMed.
- J. Yang, M. Donolato, A. Pinto, F. G. Bosco, E. T. Hwu, C. H. Chen, T. S. Alstrom, G. H. Lee, T. Schafe, P. Vavassori and A. Boisen, Biosens. Bioelectron., 2016, 75, 396–403 CrossRef CAS PubMed.
- J. Li, L. Mo, C. H. Lu, T. Fu, H. H. Yang and W. H. Tan, Chem. Soc. Rev., 2016, 45, 1410–1431 RSC.
- Y. Du, S. J. Zhen, B. Li, M. Byrom, Y. S. Jiang and A. D. J. Ellington, Anal. Chem., 2016, 88, 2250 CrossRef CAS PubMed.
- C. Petzold, A. H. Marceau, K. H. Miller and S. Keck, J. Biol. Chem., 2015, 290, 14626 CrossRef CAS PubMed.
- Z. Zhu, C. Ravelet, S. Perrier, V. Guieu, E. Fiore and E. Peyrin, Anal. Chem., 2012, 84, 7203 CrossRef CAS PubMed.
- S. Bi, J. Zhang and S. Zhang, Chem. Commun., 2010, 46, 5509–5511 RSC.
- L. Liu, J. Lei, F. Gao and H. Ju, Talanta, 2013, 15, 819–822 CrossRef PubMed.
- C. Liu, G. Xiang, D. Jiang, L. Liu, F. Liu, F. Luo and X. Pu, Analyst, 2015, 140, 7784–7791 RSC.
- N. Zhou, J. Wang, J. Zhang, L. Can, Y. P. Tian and J. Wang, Talanta, 2013, 108, 109–116 CrossRef CAS PubMed.
- D. Du, J. Ding, Y. Tao, H. Li and X. Chen, Biosens. Bioelectron., 2008, 24, 863 CrossRef CAS PubMed.
- M. Kimoto, R. Yamashige, K. Matsunaga, S. Yokoyama and I. Hirao, Nat. Biotechnol., 2013, 31, 453–457 CrossRef CAS PubMed.
- H. U. Göringer, M. Homann and M. Lorger, Int. J. Parasitol., 2003, 33, 1309–1317 CrossRef.
- J. Wang, L. Wang, X. Liu, Z. Liang, S. Song, W. Li, G. Li and C. Fan, Adv. Mater., 2007, 19, 3943–3946 CrossRef CAS.
Footnote |
| † Electronic supplementary information (ESI) available. See DOI: 10.1039/c6ra27337h |
| This journal is © The Royal Society of Chemistry 2017 |

