 Open Access Article
Creative Commons Attribution 3.0 Unported Licence
Ionicity and birefringence of α-LiNH4SO4 crystals: ab initio DFT study, X-ray spectroscopy measurements
M. Ya. Rudysh*ab,
M. G. Brikacd,
O. Y. Khyzhune,
A. O. Fedorchukf,
I. V. Kitykg,
P. A. Shchepanskyiab,
V. Yo. Stadnykb,
G. Lakshminarayanah,
R. S. Brezvinb,
Z. Baka and
M. Piasecki *a
*a
aInstitute of Physics, J. Dlugosz Academy, Armii Krajowej 13/15, PL-42-201, Czestochowa, Poland. E-mail: m.piasecki@ajd.czest.pl; rudysh.myron@gmail.com
bFaculty of Physics, Ivan Franko National University of Lviv, 8 Kyrylo-and-Mefodii Str., UA-79005 Lviv, Ukraine
cCollege of Mathematics and Physics, Chongqing University of Posts and Telecommunications, 2 Chongwen Road, Nan'an District, Chongqing 400065, P. R. China
dInstitute of Physics, University of Tartu, W. Ostwald Str. 1, Tartu 50411, Estonia
eFrantsevych Institute for Problems of Materials Science, National Academy of Sciences of Ukraine, 3 Krzhyzhanivsky Street, 03142 Kyiv, Ukraine
fDepartment of Inorganic and Organic Chemistry, Lviv National University of Veterinary Medicine and Biotechnologies, 50 Pekarska Street, Lviv 79010, Ukraine
gFaculty of Electrical Engineering, Czestochowa University Technology, Armii Krajowej 17, Czestochowa, Poland
hWireless and Photonic Networks Research Centre, Faculty of Engineering, Universiti Putra Malaysia, 43400 Serdang, Selangor, Malaysia
First published on 20th January 2017
Abstract
The structural, electronic properties and ionicity of the lithium ammonium sulfate dielectric crystals are examined using a complex approach including experimental studies of X-ray spectroscopy and the first principles band structure techniques within a framework of local electron density functional theory (DFT). Band energy dispersion, density of electronic states and dielectric function dispersion in the wide spectral range corresponding to electronic excitations were calculated using the plane wave basis and Vanderbilt ultra-soft pseudopotentials. The origin of the energy bands are estimated using density of states diagrams and the band gap magnitudes for different exchange correlation functions. To verify the data of the performed band structure calculations, the X-ray photoelectron spectroscopy (XPS) and X-ray emission spectroscopy (XES) are used. The XPS core-level and valence-band spectra as well as the XES bands representing the energy distribution of the O 2p and N 2p states are studied. Theoretical refractive indices dispersion for the main crystallographic directions (na, nb and nc) as well as birefringence spectral dependences (Δna, Δnb and Δnc) in the visible spectral range are obtained. All the calculated properties are compared with the available experimental results and good agreement between both sets of data is demonstrated.
Introduction
The lithium ammonium sulfate LiNH4SO4 crystals (LAS) belong to the β-K2SO4 crystals family possessing ion-covalent type of chemical bonding. Their general chemical formula can be written as ABCX4 where A = Na, Li, NH4, B = Na, K, Rb, NH4, CX4 = BeF4, SO4, SeO4. These crystals are the subject of intensive investigations due to the easiness of crystal growth and a number of interesting properties that are relevant for a number of applications in optical filters, polarizers, photo-thermal sensors. Particular interest presents a coexistence of ionic and covalence bonds.LAS crystals have two polymorphic modifications and can be obtained either in the low-temperature metastable α-phase or in the high-temperature stable β-phase.1,2 The earlier studies have shown that if the crystals are grown at ambient temperature or below 30 °C, then the α-LAS crystals are grown. At temperatures higher than 30 °C the crystals of β-phase are obtained.3 The LAS crystals, similarly to majority of representatives of the studied group, undergo series of phase transformations during temperature variation. The α-LAS crystals are crystallized in the orthorhombic space group Pca21 (no. 29), lattice parameters a = 10.193 Å, b = 4.9967 Å and c = 17.127 Å, V = 872.3 Å3, number of formula units Z = 8 and density D = 1.8427 g cm−3.4 Usually several polytypes with different value of the c parameter can co-exist: polytype A, containing structure with a = a0, b = b0 and c = c0, polytype B with a = a0, b = b0 and c = 2c0 and polytype C with a = a0, b = b0 and c = 3c0.5 In more than 80% of cases, crystals form the A polytype.6 When the temperature increases up to 450 K, the structural phase transition in the crystal from α- to β-modification can be observed. Depending on the crystal growth condition and environmental parameters this temperature can be changed in the range from 340 to 450 K. After being cooled down to the phase transition (PT) temperature, the crystal remains in the β-phase.3
The β-LAS crystal upon cooling undergoes the following change of symmetry of the crystal structure Pmcn → P21cn → P21/c11 → C1c1 for the temperatures of 460, 284 and 27 K, respectively.7,8
Previously many studies of this material that include the electric, thermal, Brillouin scattering, NMR and hydraulic experiments were performed.9–14
The optical properties of LiNH4SO4 crystal in the spectral range of transparency (E < 6 eV) at different temperatures are reported in.15,16 An interesting result of these studies is the existence of isotropic point at room temperature for wavelength λ0 ≈ 683 nm with respect to refractive indices (ni = nj, i, j = a, b, or c-crystallographic axis). Considering experimental results of the refractive indices and birefringence for the LiNH4SO4 crystals, the first-principles theoretical calculations of relevant optical properties can be interesting. However, for further changes of their optical properties in the desired direction it is necessary to perform strong ab initio calculations of the band energy dispersion and origin of the different sub-bands. This one could give an information for the further design of such kind of crystals within a framework of crystal engineering. Such kind of research requires complex approach (experimental) giving direct information about the partial electronic density of states and one-electron band structure calculations.
The first-principles theoretical studies of the electronic and optical properties for the LiNH4SO4 crystal are still lacking, to the best of our knowledge. We believe that such studies performed in the present paper can be useful to have a better understanding of the experimental results and for growth of new crystal engineering approach relating the concrete atoms and their dispersions. Similar studies have been recently published for other crystals of the ABCX4 group, such as: Rb2ZnCl4,17 K2ZnCl4,18 K2SO4,19 (NH4)2SO4 (ref. 20) etc. In order to verify the data of the present band structure calculations, we have explored opportunities of the X-ray photoelectron spectroscopy (XPS) and X-ray emission spectroscopy (XES) methods to study the LiNH4SO4 compound through the XPS core-level and valence-band spectra as well as the XES bands representing energy distribution of the O 2p and N 2p states. Only clear understanding of particular sub-bands origin may give a strategy for the further design of new crystals with the desired parameters like transparency, spectral range, birefringence, and so on. Recently we reported results of investigations by XPS and XES methods together with the first principles band structure techniques (within a framework of DFT calculation) for wide spectrum of materials21–24 and explained many interesting effects concerning the relationship structure–properties. Therefore, we believe that this new research approach applied for the first time to even a well-known crystal as α-LiNH4SO4 also will help to explain some of previous measurement results obtained over the last many years.
The article is organized as follows. The second section describes the methodology and computational details. The third section presents detailed information regarding experimental studies of the XPS and XES spectra. The fourth section contains the data of the structural, electronic and optical properties simulations as well as experimental electronic structure studies of LiNH4SO4.
The XPS and birefringence data will be crucial here. Finally conclusions are presented.
Method of calculation
The calculations were carried out using the plane-wave pseudopotential method as implemented in the Cambridge Serial Total Energy Package (CASTEP) module of Materials Studio package25,26 based on the electron density functional theory (DFT). For the initial geometry of the calculations, the experimental crystal structure data obtained by D. Komornicka et al.4 were used. The calculations were carried out using: (i) the exchange–correlation functional in the generalized gradient approximation (GGA) with the Perdew–Burke–Ernzerhof parameterization (PBE);27 (ii) local density approximation (LDA) in the Ceperley–Alder representation28 (and Perdew–Zunger (CA–PZ) parameterization) for exchange–correlation part of the Hamiltonian, and (iii) the hybrid functional B3LYP. The advantage of using the GGA functional is based on the fact that it works well with almost all systems giving the structural parameters within 1–3% error only. The GGA also fixes most over-binding problems of LDA, resulting in somewhat over-estimated lattice parameters and reduced cohesive energy. The electron–ion interaction was taken into account by means of the Vanderbilt ultra-soft pseudopotential29 with the following valence configuration: H [1s1], Li [1s2, 2s1], N [2s2, 2p3], O [2s2, 2p4], S [3s2, 3p4]. This pseudopotential requires much lower plane waves cutoff energy and has a better tolerability in comparison with the norm-conserving one. Before the calculation of the E–k diagrams and total energy of the crystal lattice, complete optimization (relaxation) of all ionic positions and lattice parameters was carried out. The BFGS algorithm (Broyden, Fletcher, Goldfarb and Shanno)30 was used for geometry optimization. Integration over Brillouin zone (BZ) was performed using the Monkhorst–Pack grid 1 × 3 × 1.31 The following convergence parameters were used: the convergence process of self-consistency criterion E < 2 × 10⁻⁶ eV; the plane waves basis set cut-off energy (marginal kinetics energy) Ecut = Gmax2/2 = 380 eV; convergence of the total energy 1 × 10⁻⁵ eV per atom; convergence of self-consistent field 10 × 10−6 eV per atom; maximum force 0.03 eV Å−1; maximum pressure 0.005 GPa and maximum displacement 0.0001 Å. The electronic band diagram was built along the lines of high symmetry on the principal directions of BZ in reciprocal space, which connect the following high symmetry points (in the terms of the reciprocal lattice unit vectors): Γ(0; 0; 0); Z(0; 0; 0.5), T(0; 0.5; 0.5), Y(0; 0.5; 0), S(0.5; 0.5; 0), X(0.5; 0; 0), U(0; 0.5; 0.5), R(−0.5; 0.5; 0.5) (Fig. 1).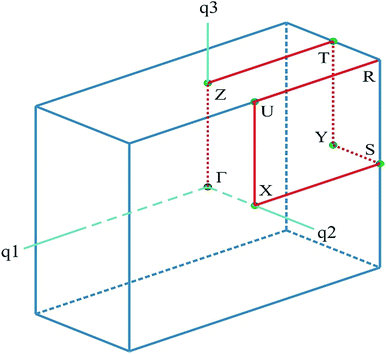 | ||
| Fig. 1 The BZ of a unit cell for LiNH4SO4. The coordinates of the special points are given in the text. | ||
Experimental
In order to elucidate the electronic structure of the title compound experimentally, the XPS and XES spectra were investigated for LiNH4SO4 crystal grown for the present experiments by slow evaporation from aqueous solution technique. Crystals were crystallized from an aqueous solution prepared from equi-molar amounts of reagent grade (NH4)2SO4 and Li2SO4·H2O salts dissolved in distilled water. The valence-band and core-level spectra of the LiNH4SO4 crystal were acquired employing the UHV-Analysis-System, which was designed and constructed by SPECS Surface Nano Analysis Company, Germany. The System is equipped with a PHOIBOS150 hemispherical analyzer. When recording the XPS spectra, base pressure of an operating chamber of the System was less than 7 × 10⁻¹⁰ mbar. Mg Kα irradiation (E = 1253.6 eV) was adopted for spectra excitation that were recorded at the constant pass energy of 30 eV. The spectrometer energy scale was calibrated by assuming the measured Au 4f7/2 and Cu 2p3/2 binding energies of reference pure gold and copper samples to be equal to 84.00 ± 0.05 eV and 932.66 ± 0.05 eV, respectively, in relation to the Fermi energy, EF. Charging effects were taken into account by setting the XPS C 1s core-level spectrum binding energies (BE) of adsorbed hydrocarbons to be equal to 284.6 eV as suggested for semiconducting and dielectric oxide-bearing materials.32–34 In order to clean the surface from adsorbed hydrocarbons as well as to study the influence of middle-energy Ar+ bombardment on the XPS spectra of the LiNH4SO4 crystal, its surface was bombarded with Ar+ ion beam (3.0 keV, ∼5 min duration, ion current density fixed at 14 μA cm−2). The same technique was used earlier for similar studies of a number of oxygen-bearing crystals.35–37Technique of recording the XES O Kα and N Kα bands (K → LII,III transition), which bring information with respect to the energy distribution of the O 2p and N 2p states, respectively, was similar to that described in detail in ref. 38. Briefly, the XES O(N) Kα bands were recorded using an RSM-500 spectrometer equipped with a diffraction grating (600 groves per mm, radius of curvature of R = 6026 mm). As a detector, secondary electron multiplier VEU-6 with a CsI photocathode was employed. For excitation of the XES O(N) Kα bands, operation conditions of spectrometer electron gun were set as follows: Ua = 5.0 kV and Ia = 1.5 mA. Energy resolutions, ΔEmin, of the RSM-500 spectrometer were calculated to be 0.2 and 0.25 eV when measuring the XES N Kα and O Kα bands, respectively.
Results and discussion
Crystal structure
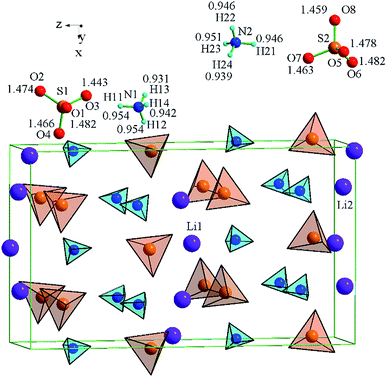
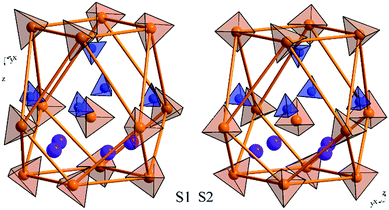
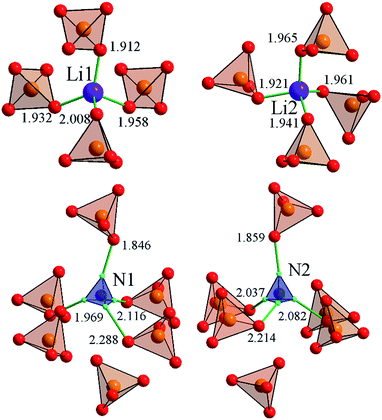
The LiNH4SO4 crystal structure can be presented as a couple of individual atoms or polyhedra of atoms as shown in Fig. 2. The blue tetrahedrons are composed of the hydrogen atoms arranged around the nitrogen atoms and red ones are made up by the oxygen atoms around the sulfur atoms. The inter-atomic distances within these polyhedra are presented in Fig. 2. The second anion coordination39 of both anions around the S1 and S2 atoms is in a shape of a slightly strained cuboctahedron (Fig. 3). As shown in Fig. 3, the atoms within the NH4+ cation group (blue tetrahedrons) occupy the octahedral voids between the anions and the Li+ cations occupy the tetrahedral cavities. In Fig. 4 the shortest cation–anion distances (all in Å) within occupied cavities in the LiNH4SO4 structure are presented.The unit cell parameters and atomic coordinates of LiNH4SO4 crystal obtained by Komornicka et al.4 are presented in Tables 1 and 2. The optimized lattice parameters with BFGS method using the LDA and GGA functional are also presented in Table 1. As one can see, the crystal structure parameters are in good agreement with the experimental data.
| Compound: LiNH4SO4 | Experiment | LDA | GGA |
| Space group | Pca21 | Pca21 | Pca21 |
| Lattice parameter: a (Å) | 10.1930 | 10.0289 | 10.5085 |
| b (Å) | 4.9967 | 4.7422 | 5.0526 |
| c (Å) | 17.1270 | 16.4394 | 17.2237 |
| c/a | 1.68027 | 1.6392 | 1.63902 |
| c/b | 3.42766 | 3.4666 | 3.4088 |
| Cell volume (Å3) | 872.3 | 781.9 | 914.5 |
| Z | 8 | 8 | 8 |
| Calculated density (g cm−3) | 1.8427 | 2.0558 | 1.7576 |
| Number of atoms in cell | 88.0 | 88.0 | 88.0 |
| Atom | x/a | y/b | z/c | U [Å2] | Wyck. | Occupation |
|---|---|---|---|---|---|---|
| S1 | 0.2736 | 0.9622 | −0.0974 | 4a | 1 | |
| S2 | 0.4762 | 0.5375 | 0.0991 | 4a | 1 | |
| O1 | 0.2673 | 0.6665 | −0.0883 | 4a | 1 | |
| O2 | 0.1976 | 0.0880 | −0.0339 | 4a | 1 | |
| O3 | 0.2197 | 0.0332 | −0.1728 | 4a | 1 | |
| O4 | 0.4108 | 0.0442 | −0.0910 | 4a | 1 | |
| O5 | 0.4848 | 0.8321 | 0.0902 | 4a | 1 | |
| O6 | 0.0546 | 0.5887 | 0.0361 | 4a | 1 | |
| O7 | 0.0312 | 0.5353 | 0.1754 | 4a | 1 | |
| O8 | 0.3383 | 0.4568 | 0.0939 | 4a | 1 | |
| N1 | 0.2188 | 0.9778 | 0.1697 | 4a | 1 | |
| N2 | 0.0200 | 0.4788 | −0.1644 | 4a | 1 | |
| Li1 | 0.0231 | 0.9543 | 0.0002 | 4a | 1 | |
| Li2 | 0.2239 | 0.4579 | 0.0028 | 4a | 1 | |
| H11 | 0.2263 | 0.9924 | 0.2251 | 0.05 | 4a | 1 |
| H12 | 0.1425 | 0.0578 | 0.1484 | 0.05 | 4a | 1 |
| H13 | 0.2766 | 0.089 | 0.1428 | 0.05 | 4a | 1 |
| H14 | 0.2383 | 0.7989 | 0.1573 | 0.05 | 4a | 1 |
| H21 | 0.0095 | 0.4865 | −0.2191 | 0.05 | 4a | 1 |
| H22 | 0.0963 | 0.567 | −0.1482 | 0.05 | 4a | 1 |
| H23 | 0.0071 | 0.3038 | −0.1448 | 0.05 | 4a | 1 |
| H24 | 0.4612 | 0.4007 | −0.1395 | 0.05 | 4a | 1 |
As a result of the known regularity, lattice parameters obtained using LDA are smaller than to the obtained experimentally (about Δa ∼ 1.6%; Δb ∼ 5.1%; Δc ∼ 4.0%) due to the over-binding problem of the LDA method, whereas the GGA parameters are slightly larger Δa ∼ 3.1%; Δb ∼ 1.1%; Δc ∼ 0.6%. Since using of the GGA method provides better agreement between the calculated and experimental structural parameters, in the subsequent calculations we mainly used the GGA functional.
Electronic structure calculations
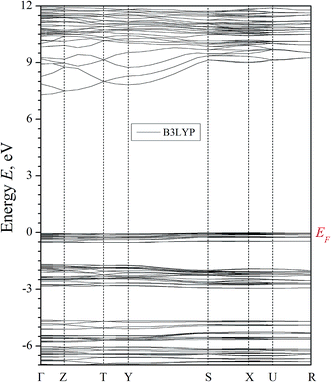
The results of the band structure calculations of α-LiNH4SO4 crystal using the LDA/CA–PZ, GGA/PBE and B3LYP (because hybrid functionals frequently gives better Eg value) screening functionals are shown in Fig. 5 and 6. These methods deal with the one-electron approach which has a principal drawback caused by absence of multi-electron interactions, however the pseudopotential for the semiconductors with energy gap above 2 eV were successfully applied for this goal40 and crucial in this case is a number of plane waves and self-consistent interactions.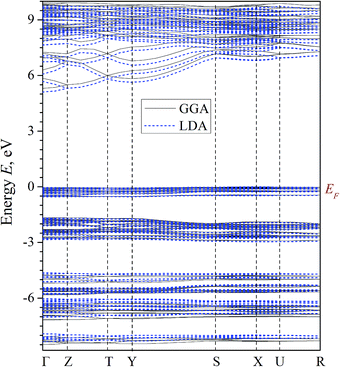 | ||
| Fig. 5 Calculated band energy dispersion of α-LiNH4SO4 crystal. Eg = 5.30 (5.11) for the GGA/PBE (LDA/CA–PZ). | ||
The general k-dispersion of the calculated valence bands is very flat. It is in an agreement with a fact that the hole mobility is relatively low due to high magnitude of energy gap. At the same time the conduction band dispersion shows high anisotropy of band structure dispersion. In the Γ–Z–T–Y BZ directions we have huge band energy dispersion and in other directions this dispersion is very low. It may reflect an anisotropy due to coexistence of ionic and covalence chemical bonds which finally may favor some anisotropy of refractive indices dispersion.
As can be seen from the Fig. 5, the top of the valence band (VB) taken as 0 eV is assigned to the Fermi level EF. The valence levels are formed by a set of narrow sub-bands separated by forbidden energy gaps. All levels are of a low dispersion (energy dependence of the wave vector k). This feature was previously revealed for other isomorphic crystals such as potassium sulfate K2SO4,19 rubidium ammonium sulfate RbNH4SO4 (ref. 41) and borate crystals.42 Low dispersion of energy levels forming the VB top may be associated with a huge ionic chemical bonds component and specific features of bonding-anti bonding pO–pS orbital. The cationic subsystem induces different polarizabilities of the anionic clusters.
Based on the obtained results, we assume that the fundamental absorption edge is associated with the direct transitions between the VB and the conduction band (CB) bottom at Γ point. It should also be noted that because of well-known DFT limitations, the calculations underestimate the band gap value comparing with respect to the experimental values (Etheorg < Eexperg).
Thus the experimental band gap value should be greater than 7.3 eV. The partial density of electronic states (PDOS), with the contributions of individual atoms, are calculated for band-energy diagram E(k) of α-LiNH4SO4 crystal (Fig. 7).
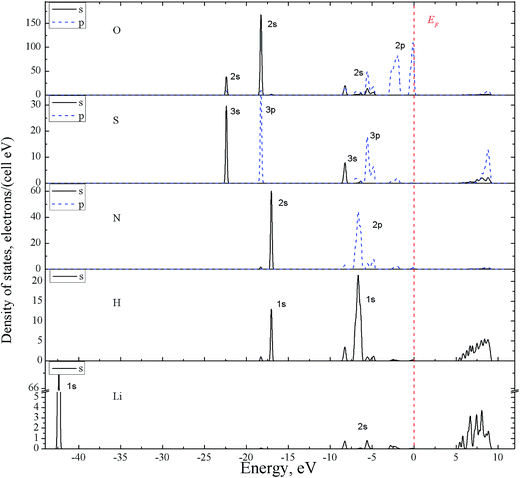 | ||
| Fig. 7 Electronic partial DOS for α-LiNH4SO4 crystal possessing orthorhombic space group no. 29 projected on s- and p-states and constituent atoms using GGA functional. | ||
The partial density of electronic states (PDOS), with the contributions of individual atoms, are calculated for band-energy diagram E(k) of α-LiNH4SO4 crystal (Fig. 7). As can be seen from the figure, a characteristic feature of DOS is that the two top valence bands (from −3 to −1.5 and from −0.77 to 0 eV) are almost entirely formed by the 2p-electrons of oxygens originating from SO42− anion complexes. An insignificant contribution to these two bands is produced by the 3p-states of sulfur, 2p states of nitrogen and 1s-electrons of hydrogen. Deeper levels of the valence band in the range of −4.2 to −8.7 eV are of a mixed origin and are formed by the 3s- and 3p-states of sulfur and (2s, 2p states of oxygen) as well as 1s-states of hydrogen hybridized with the 2p-states of nitrogen. States of lithium of a low intensity are also present here.
The VB in the range from 0 to −5.5 eV are prevailingly formed by the states of SO4 complexes, whereas the band from −8.5 to −4.5 eV – generally by states of NH4+ groups. However, the observed inter-ionic (SO4 and NH4) contributions are also present in these two areas.
The valence bands from −17 to −18.3 eV contain two similar sub-bands, one of which is formed by the NH4 group (2s-states of nitrogen and 1s of hydrogen), and another – by SO4 anionic complexes (2s-states of oxygen hybridized with 3p-states of sulfur). The energy levels near −22.3 eV are formed mainly by the 3s-states of sulfur S and 2s states of oxygen O. Contribution of the lithium atoms electronic states is major for VB at −42.3 eV. Characteristics of these zones are useful for analysis of the interaction between complexes in the crystal. The CB bottom is formed mainly by the hydrogen atoms (s-states); higher areas of this band at E > 5.8 eV – by mixed set of chemical elements and orbital moments.
The obtained band structure and density of states of the α-LAS crystal are quite similar to other isomorphic crystal of ABCX4 type (LiRbSO4 lithium rubidium sulfate (LRS)43 and RbNH4SO4 rubidium ammonium sulfate (RAS)41), also obtained using the DFT approach. The difference was revealed, for which that the top of the VB of LRS crystal is formed by the states of sulfur atoms, while corresponding for LAS and RAS crystals – mainly by p-states of oxygen atoms. It is also important to note that α-LAS crystal has a very similar band structure to β-LAS modification crystals calculated previously.44 As can be seen from Table 3 band gap value for α-LAS appears to be almost the same as previously calculated for β-LAS. Top of VB for α-LAS is found to be slightly shifted towards higher energies, while the bottom of CB – towards lower energies. Position of bands remains in Γ-point for both α- and β-LAS.
| Crystal phase | Eg, eV | Top and BZ point of VB in eV | Bottom and BZ point of CB in eV |
|---|---|---|---|
| α | 5.3 | −0.02Γ | 5.308Γ |
| β40 | 5.32 | −0.0005Γ | 5.316Γ |
The analysis of Mulliken population of LAS crystal was also carried out. It is an effective tool to calculate the partial atomic charges, which is based on the method of linear combination of atomic orbitals (LCAO). In order to determine the chemical nature of the chemical bonding the calculation of electron density distribution and Mulliken charges for the LAS crystal was carried out (Fig. 8). Such calculations in CASTEP were implemented by Segall et al.26 These are based on the Sanchez-Portal method, which combines LCAO and plane wave methods.45
 | ||
| Fig. 8 Cross-section of the α-LiNH4SO4 electron density represented from blue (0.0 e Å−3) to red (2.5 e Å−3) colors, respectively. | ||
The figure illustrates distribution of the electron density of LAS crystal in the plane that passes through the Li, N, H, S and O atoms. As can be seen from the figure, distribution of electron density around lithium is spherical, indicating the absence of chemical bonding between lithium and neighboring O and H atoms. So the Li atoms form almost pure ionic bonds. For other atoms, one can see that the space charge density distribution of electron density around S and N atoms is not spherical and overlap of electronic clouds with neighboring H and O atoms is presented, which indicates a strong covalent bonding between the corresponding atoms.
The relevant characteristics of atomic population, population of atoms components and bonds overlapping for s- and p-orbitals as well as the atomic charges of all atoms of the LAS crystal are presented in Tables 4 and 5.
| Species | s-Orbitals | p-Orbitals | Total | Charge (e) |
|---|---|---|---|---|
| S | 1.10 | 2.42 | 3.52 | 2.48 |
| O | 1.88–1.89 | 5.11–5.24 | 6.99–7.13 | −0.98 to −1.13 |
| Li | −0.04 | 0.00 | −0.04 | 1.04 |
| N | 1.63 | 4.35 | 5.98 | −0.98 |
| H | 0.58 | 0.00 | 0.58 | 0.42 |
| Bond | Population | Length (Å) |
|---|---|---|
| N–H | 0.62–0.65 | 1.03995–1.05491 |
| S–O | 0.53–0.60 | 1.47615–1.50429 |
| H–H | −0.07 to −0.06 | 1.68995–1.72330 |
| O–H | −0.08–0.09 | 1.73365–2.89074 |
| O–O | −0.18 to −0.17 | 2.43400–2.45140 |
| S–H | −0.04 to −0.02 | 2.79973–2.99626 |
| N–O | −0.08 to −0.11 | 2.89036–2.95628 |
| Li–O | −0.07–0.03 | 1.95405–2.02007 |
| Li–H | −0.01 to −0.02 | 2.93900–2.97394 |
The absolute Mulliken charge values for sulfur 2.48 and oxygen −0.98 to −1.13 and average distances (1.47615–1.50429) S–O are found to be slightly higher in comparison with similar values for RbNH4SO4 and K2SO4. This indicates the greater ionicity of S–O bonding in LiNH4SO4 crystals than in K2SO4 and RbNH4SO4.
The maximal population of S–O bond of SO4 groups is also lower for α-LAS crystal (0.53) than for RAS (0.67) and triglycine sulphate (TGS) (0.58).46 This fact confirms the assumption of high covalence of SO4 bonding and is consistent with the fact that negative charge of SO4 complexes in LAS crystal is greater than in the TGS. The lengths of the S–O bonds (Table 5) are different in compare to the corresponding TGS crystal.
Elastic properties
Elastic stiffness coefficients (Cij) of solids give the relationship between mechanical and dynamic behavior of crystals as well as important information about the forces acting in the crystal and the response of a crystal to the applied external deformation. We calculated the elastic coefficients for the LAS crystal on the basis of relaxed crystal structure. This information can be very important in the analysis of piezooptic properties of the crystal. Elastic stiffness coefficients (Cij) and bulk elastic moduli of LiNH4SO4 crystal calculated using the LDA and GGA functionals are shown in Table 6.| B | C11 | C22 | C33 | C44 | C55 | C66 | C12 | C13 | C23 | |
|---|---|---|---|---|---|---|---|---|---|---|
| GGA | 29 | 58 | 48 | 49 | 14 | 12 | 11 | 15 | 21 | 17 |
| LDA | 39 | 67 | 60 | 62 | 17 | 15 | 23 | 26 | 30 | 25 |
Symmetric matrix of 6 × 6 linear elastic constants contains 12 non-zero components for orthorhombic crystals. The number of components can be reduced to nine independent components (C11, C22, C33, C44, C55, C66, C12, C13 and C23) (Table 6).
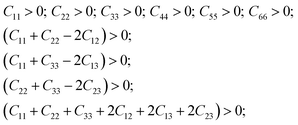
As can be seen from the Table 6, the calculated elastic coefficients satisfy the following relations:
 | (1) |
These relations define the stability criterion of crystal structure for orthorhombic crystals.47 Thus, the crystal structure of α-LAS (space group 29) appears to be quite stable.
Optical properties
LAS crystals optical properties can be obtained from the frequency dependence of the complex dielectric function ε(ω) = ε1(ω) + iε2(ω), where , which is connected to the electronic structure.48 Spectrum of the imaginary part of dielectric permittivity ε2(ω) can be calculated by numerical integration in k-space of elements of dipole matrix operator between the filled VB states and empty CB levels (eqn (2))
 | (2) |
Real part of the dielectric permittivity ε1(ω) can be obtained from the spectrum of its imaginary part ε2(ω) using the Kramers–Kronig relation49
 | (3) |
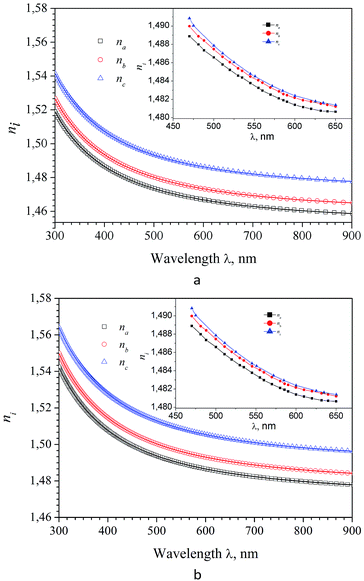
Spectra of real ε1(E) and imaginary ε2(E) parts of the complex dielectric permittivity ε(E) in the region of intrinsic absorption of α-LAS crystals are presented in Fig. 9. As one can see the dielectric function ε(E) is characterized by a large anisotropy that is consistent with a relatively large birefringence in the region of transparency (Fig. 12).
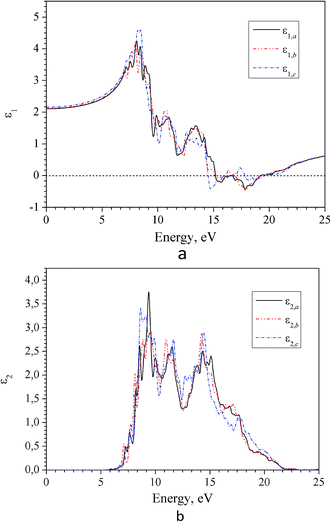 | ||
| Fig. 9 Spectra of real (a) and imaginary (b) part of dielectric function for α-LiNH4SO4 crystal calculated for three principal crystallographic directions a, b and c (GGA–PBE). | ||
From the spectra of real ε1(ω) and imaginary ε2(ω) part of dielectric permittivity other optical properties such as refractive index n(ω) and absorption coefficient k(ω) (n = n + ik) can be obtained using following ratios:50
 | (4) |
Frequency dependencies of the refractive index ni(E) and absorption coefficient ki(E) of LAS crystal for three crystallophysical directions are presented in Fig. 10 and 11. From these figures, one can see that refractive index in the optical region of the spectrum satisfies the following inequality nc > nb > na. Dispersion of refractive index is normal for three directions and can be approximated using Sellmeier equation:
 | (5) |
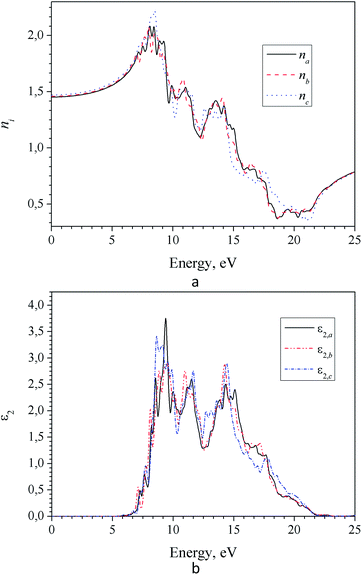 | ||
| Fig. 10 Spectra of refractive (a) and absorption (b) indices for α-LiNH4SO4 crystal calculated for three principal crystallographic directions a, b and c (GGA–PBE). | ||
The parameters of Sellmeier eqn (5) A, B, C and D for the dispersion of the refractive index calculated with LDA and GGA methods are presented in Table 7. With those parameters, it is possible to estimate the value of the corresponding refractive indices for any particular wavelength.
| A | B | C, nm | D, nm−2 | ||
|---|---|---|---|---|---|
| GGA | na | 1.1528 ± 0.0006 | 0.2998 ± 0.0006 | −127.5859 ± 0.1038 | (1.9223 ± 0.1431) × 10−10 |
| nb | 1.1581 ± 0.0006 | 0.3007 ± 0.0005 | −128.6560 ± 0.1101 | (2.1703 ± 0.1623) × 10−10 | |
| nc | 1.1585 ± 0.0007 | 0.3128 ± 0.0007 | −128.4926 ± 0.1122 | (2.1728 ± 0.1657) × 10−10 | |
| LDA | na | 1.1476 ± 0.0004 | 0.3238 ± 0.0004 | −127.0555 ± 0.0624 | (1.6273 ± 0.0903) × 10−10 |
| nb | 1.1522 ± 0.0004 | 0.3254 ± 0.0004 | −127.0674 ± 0.0543 | (1.7890 ± 0.0938) × 10−10 | |
| nc | 1.1535 ± 0.0004 | 0.3359 ± 0.0004 | −127.9197 ± 0.0661 | (1.8475 ± 0.1029) × 10−10 |
It was found that in the spectral range of 450–850 nm the refractive indices dispersion curves n(E) do not cross. Moreover, the tendency to grow in the near infrared region of the spectrum is not observed, in contradiction with the experimental data (experimental dispersion of the refractive index is presented in insets). This discrepancy is probably due to disregarding the infrared absorption of the crystal (E < 0.4 eV), which also owns anisotropy according to the symmetry of the α-LAC crystal, as well as due to the presence of defects in the crystal. It is necessary to state that present calculations are suitable for the evaluations of the birefringence dispersion, however determination the absolute values of refractive indices is not accurate in the frame the DFT due to possible important role of many-electron effects which are not correctly included in the such approach. The refractive indices differ for different polarizations, allowing us to build a spectral dependence of birefringence Δni = (nj − nk), (i, j, k = a, b and c-crystallographic axis) (Fig. 12). As one can see dependences Δni(λ) are almost identical for calculations using the LDA and GGA functionals. Spectral dependence of calculated (LDA and GGA) birefringence very slowly decrease with wavelengths increase in the investigated spectral range in contrast to the experimental results, where normal birefringence value a significant decrease with increase of wavelength. For shortest wavelengths calculated birefringence values for the particular crystallographic directions agree with experiment. Thus we can conclude that obtained theoretically spectral dependence of birefringence satisfactorily correlate with experimental features.
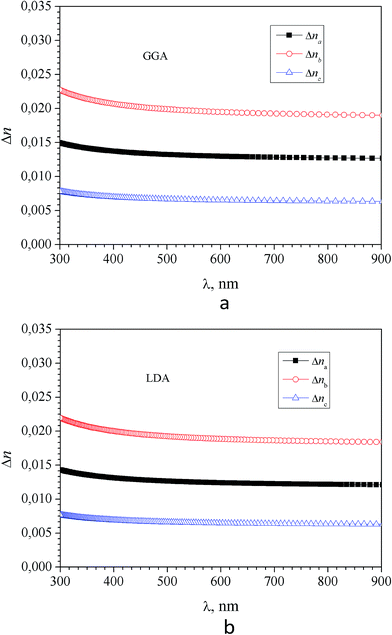 | ||
| Fig. 12 Dispersion of birefringence Δni = (nj − nk), (i, j, k = a, b and c-crystallographic axis directions) of α-LiNH4SO4 calculated using the GGA (a) and LDA (b) functional. | ||
XPS and XES measurements
Data of the above discussed theoretical band-structure calculations are confirmed experimentally based on the X-ray spectroscopy measurements of the α-LiNH4SO4 crystal.Fig. 13 presents all the fine-structure features of the survey XPS spectra, except the C 1s core-level spectrum and C KLL Auger line, are assigned to the core-levels or Auger lines of the atoms composing the LiNH4SO4 compound (it is worth mentioning that the presence of hydrogen is not detected by XPS). The presence of the XPS C 1s line (not presented here) for α-LiNH4SO4 surface can be explained by hydrocarbons adsorbed from laboratory air. The relative intensity of the C 1s line decreased significantly as a result of the Ar+-bombardment of the α-LiNH4SO4 crystal surface (Fig. 13).
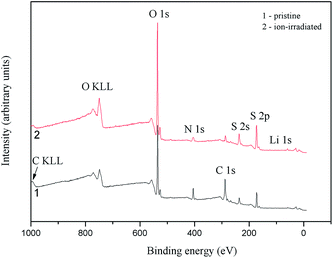 | ||
| Fig. 13 Survey XPS spectra derived for (1) pristine and (2) Ar+ ion-bombarded surfaces of the α-LiNH4SO4 crystal. | ||
The main XPS core-level spectra associated with lithium, nitrogen, sulfur and oxygen atoms recorded for the α-LiNH4SO4 crystal surfaces, both pristine and Ar+ ion-irradiated, are presented in Fig. 14. Table 8 summarizes BE values of the constituent element core-level electrons as well as fine-structure peculiarities observed within the valence-band region of the α-LiNH4SO4 crystal surface before and after its Ar+ ion-bombardment. Our XPS data allow to conclude that BE values of the core-level electrons of lithium, sulfur and oxygen atoms do not change within the present experimental precisions (±0.1 eV) due to the Ar+-irradiation of the α-LiNH4SO4 surface over 5 min at ion energy of 3.0 keV and current density at 14 μA cm−2. Nevertheless, the present XPS data indicate that the relative intensity of the N 1s core-level spectrum decreases abruptly as a result of the Ar+ ion-bombardment of the α-LiNH4SO4 crystal surface and the line broadens significantly. This fact may be explained by removing hydrogen atoms from NH4 octachedra due to the Ar+ ion-bombardment as well as possible amorphization of the top most layers of the α-LiNH4SO4 crystal in such a case. The latter effect was observed previously for a number of oxygen-bearing crystals in similar surface treatments by Ar+ ion-irradiation.34–37 It was established previously in ref. 34–37, in many cases of oxygen-bearing crystals, the Ar+ ion-bombardment induces the loss of long-range order of the topmost-layers, breaking some chemical bonds and formation of the atoms in the M0 chemical state. Such a surface treatment was established to induce significant changes in the energy distribution of electronic states within the valence-band region.34–37 Fig. 15 presents the XPS valence-band spectra of the α-LiNH4SO4 crystal measured for the pristine surface and after its treatment with Ar+ ion-irradiation. As one can see from Fig. 15, the valence band of α-LiNH4SO4 is characterized by the existence of four fine-structure peculiarities, marked as A to D.
 | ||
| Fig. 14 Detailed XPS core-level spectra derived for (1) pristine and (2) Ar+ ion-bombarded surfaces of the α-LiNH4SO4 crystal: (a) O 1s, (b) N 1s, (c) S 2p, and (d) Li 1s. | ||
| Core-level/valence band | α-LiNH4SO4/pristine surface | α-LiNH4SO4/Ar+ ion-bombarded surface |
|---|---|---|
| Valence band (peculiarities A, B, C, and D) | 3.7, 5.8, 9.4, 12.6 | 3.8, 5.9, 9.6, 12.5 |
| O 2s | 23.4 | 23.3 |
| Li 1s | 54.1 | 54.2 |
| S 2p | 167.8 | 167.7 |
| S 2s | 531.6 | 531.5 |
| N 1s | 400.4 | 399.8 |
| O 1s | 530.4 | 530.5 |
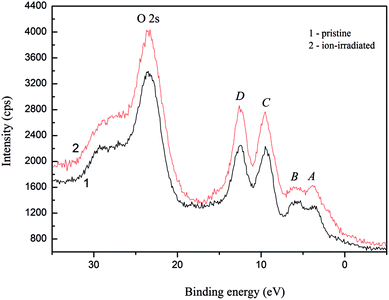 | ||
| Fig. 15 Detailed XPS valence-band spectra derived for (1) pristine and (2) Ar+ ion-bombarded surfaces of the α-LiNH4SO4 crystal. | ||
From Fig. 15, it is apparent that the Ar+-irradiation of the α-LiNH4SO4 surface over 5 min at ion energy of 3.0 keV and current density fixed at 14 μA cm−2 does not cause changes in the energy positions of the fine-structure peculiarities A to D of the XPS valence-band spectrum of α-LiNH4SO4; however it lowers substantively the relative intensity of the feature B.
Fig. 16 presents the XPS valence-band spectrum and the XES O Kα and N Kα bands of the α-LiNH4SO4 crystal provided that a common energy scale is applied. We used the technique of matching the X-ray spectroscopy spectra that described in detail in ref. 51 and it is generally used in XES.52 Zero of energy in Fig. 16 corresponds to the EF position of the PHOIBOS 150 hemispherical analyzer of the UHV-Analysis-System. As can be seen from Fig. 16, the presented experimental results indicate that main contributions of the O 2p states occurs at the top of the valence band of α-LiNH4SO4 with their significant contributions in the upper and central portions of the valence band of the compound under study. Further, energy positions of the peculiarities a, b and c of the XES O Kα band correspond well to those of the features A, B and C of the XPS valence-band spectrum, respectively. The above data are in excellent agreement with the results of band-structure calculations of total DOS and partial density of the O 2p states of α-LiNH4SO4 (see Fig. 7). Furthermore, as it is predicted by the theoretical calculations, the main contributions of the N 2p states occur in the lower portion of the valence band of α-LiNH4SO4 (Fig. 7 and 16). The considerable difference between energy positions of the maximum of theoretical N 2p DOS curve (Fig. 7) and that of the experimental XES N Kα band representing the energy distribution of the N 2p states (Fig. 16) is explained by the fact that zero of energy in Fig. 7 corresponds to the position of the last occupied band (actually the top of the valence band), while in Fig. 16 zero of energy corresponds to the position of the Fermi level of the PHOIBOS 150 hemispherical analyzer used in the UHV-Analysis-System. In the case of metals, the Fermi level of the analyzer is positioned very close to that of the theoretical PDOS curves. However, in the case of semiconductors and insulators, the Fermi level of the analyzer is positioned in the energy gap region.
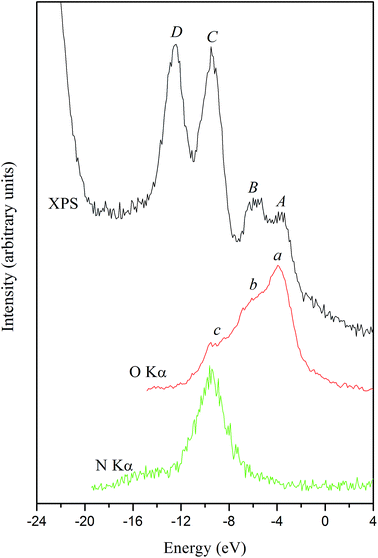 | ||
| Fig. 16 Comparisons on a common energy scale of the XPS valence-band spectrum and XES O Kα and N Kα bands of the α-LiNH4SO4 crystal. | ||
With respect to the origin of D-band detectable on the experimental XPS valence-band spectrum, it obviously originates from contributions of the S 3s states, as Fig. 7 depicts. Regrettably, at present we are not able to measure experimentally the XES band representing the S 3s states in the titled compound. Regrettably, available experimental abilities do not allow us to measure XES bands representing energy distributions of the Li 2s, S 3p and S 3s states, which in accordance with the band-structure calculations (Fig. 7) should bring also significant contributions to the valance band of α-LiNH4SO4.
Conclusions
The first principles calculations of energy band structure, density of electronic states, and optical properties of α-LiNH4SO4 crystal with space group Pcn21 (no. 29) within electron density functional theory using the CASTEP code allowed to build up the following conclusions.The optimized crystal structure (optimization of lattice parameters and atomic positions in the cell) is pretty close to that one obtained experimentally. The highest electron density dispersion E(k) is observed for the lowest levels of the conduction band in the direction toward the center of the Brillouin zone. All levels of the valence band are rather flat and form narrow bundles of levels divided by narrow band gaps. The top of the valence band is formed by the 2p-states of oxygen. The bottom of the conduction band is formed by the 1s-states of hydrogen. Band gap of the crystal is of a direct type and corresponds to the optical transitions at Γ point of Brillouin zone. The band gap value is Eg = 5.11 eV in the case of LDA, 5.30 eV for GGA and 7.34 eV for B3LYP exchange–correlation functionals. Calculated distribution of electron density and charges and Mulliken indicate strong covalent bonding with the overlapping of electron clouds within SO4 and NH4 complexes. With respect to occupation of the valence band by O 2p and N 2p states, the present band structure calculations are confirmed by comparison of the XPS valence-band spectrum and the XES O Kα and N Kα bands of the α-LiNH4SO4 crystal. Furthermore, the present XPS data indicate that the relative intensity of the N 1s core-level spectrum lowers significantly due to the Ar+ ion-bombardment of the α-LiNH4SO4 crystal surface leading to significant broadening the line. This case can be explained by removing hydrogen atoms from NH4 octachedra as well by as possible amorphization of the topmost layers of the α-LiNH4SO4 crystal as a result of the Ar+ ion-bombardment. Spectral dependence of the refractive indices in the transparency region exhibit character of curves similar to the experimental. Differences between the theoretical and experimental results can be explained by neglecting thermal vibrations of atoms and other approximations of DFT as well as by the presence of defects in real crystals. In case of birefringence, a slight difference may reflect more important role of many-electron effects which are not included in the DFT calculations.
Acknowledgements
Calculations have been performed using the Materials Studio 8.0 package at the supercomputer center of Wrocław University of Technology (WCSS). Also this work was supported by J. Dlugosz University research projects-“Young scientists 2016” (Grants No. DSM/WMP/6542/2016 – Shchepanskyi and DSM/WMP/6543/2016 – Rudysh). M. G. Brik thanks the supports from the Recruitment Program of High-end Foreign Experts (Grant No. GDW20145200225), the Programme for the Foreign Experts offered by Chongqing University of Posts and Telecommunications, Ministry of Education and Research of Estonia, Project PUT430, and European Regional Development Fund (TK141).Notes and references
- W. A. Dollase, Acta Crystallogr., 1969, 25, 2298–2302 CrossRef CAS.
- A. Pietraszko and K. Lukaszewicz, Pol. J. Chem., 1992, 66, 2057–2061 CAS.
- S. V. Melnikova, A. V. Kartashev and B. A. Grankina, et al., Sel. Sci. Pap., 2003, 8, 1497–1502 Search PubMed.
- D. Komornicka, M. Wołcyrz and A. Pietraszko, Cryst. Growth Des., 2014, 14(11), 5784–5793 CAS.
- P. Tomaszewski, Solid State Commun., 1992, 81, 333–335 CrossRef CAS.
- A. Pietraszko and K. Lukaszewicz, Pol. J. Chem., 1992, 66, 2057–2061 CAS.
- A. I. Kruglik, M. A. Simonov and K. S. Aleksandrov, Crystallography, 1978, 23, 494–498 CAS.
- K. Itoh, H. Ishikura and E. Nakamura, Acta Crystallogr., 1981, 37, 664–666 Search PubMed.
- T. Mitsui, T. OKa and Y. Shiroishi, et al., J. Phys. Soc. Jpn., 1975, 39, 845 CrossRef CAS.
- H. Shimizu, A. Oguri and H. Yasuda, et al., Ferroelectrics, 1978, 21, 517–519 CrossRef CAS.
- P. E. Tomaszewski and I. N. Flerov, Phys. Solid State, 1977, 9, 605–607 Search PubMed.
- P. E. Tomaszewski and A. Pietraszko, Phys. Status Solidi, 1979, 56, 467–472 CrossRef CAS.
- S. Hirotsu, Y. Kunii and I. Yamamoto, et al., J. Phys. Soc. Jpn., 1981, 50, 3392–3397 CrossRef CAS.
- T. I. Chekmasova, I. S. Kabanov and V. I. Yuzvak, Phys. Status Solidi, 1977, 44, K155 CrossRef CAS.
- V. I. Stadnyk, R. S. Brezvin, M. Y. Rudish, P. A. Shchepanskii, V. M. Gaba and Z. A. Kogut, Opt. Spectrosc., 2014, 117, 756–758 CrossRef CAS.
- V. Y. Stadnyk, R. S. Brezvin, M. Y. Rudysh, P. A. Shchepanskyi and V. Y. Kurlyak, Crystallography, 2015, 60, 435–439 Search PubMed.
- B. Andriyevsky, V. Kurlyak, V. Stadnyk, M. Romanyuk, V. Stakhura and M. Piasecki, Comput. Mater. Sci., 2016, 111, 257–262 CrossRef CAS.
- O. V. Bovgyra, V. M. Gaba, Z. O. Kohut, O. S. Kushnir and V. Y. Stadnyk, Ukr. J. Phys. Opt., 2011, 12, 4271–4278 Search PubMed.
- B. Andriyevsky, M. Jaskólski, V. Y. Stadnyk, M. O. Romanyuk, Z. O. Kashuba and M. M. Romanyuk, Mater. Sci.-Pol., 2015, 33, 11–17 CAS.
- B. Andriyevsky, K. Doll and M. Jansen, J. Phys. Chem. Solids, 2010, 71, 357–363 CrossRef CAS.
- O. V. Parasyuk, V. V. Pavlyuk, O. Y. Khyzhun, V. Kozer, L. Myronchuk, V. P. Sachanyuk, G. Dmytriv, A. Krymus, I. V. Kityk, E. N. Ahmed, A. Ahmed and M. Piasecki, RSC Adv., 2016, 6, 90958–90966 RSC.
- O. Y. Khyzhun, M. Piasecki, I. V. Kityk, I. Luzhnyi, A. O. Fedorchuk, P. M. Fochuk, S. I. Levkovets, M. V. Karpets and O. V. Parasyuk, J. Solid State Chem., 2016, 242, 193–198 CrossRef CAS.
- O. Y. Khyzhun, P. M. Fochuk, I. V. Kityk, M. Piasecki, S. I. Levkovets, A. O. Fedorchuk and O. V. Parasyuk, Mater. Chem. Phys., 2016, 172, 165–172 CrossRef CAS.
- A. A. Lavrentyev, B. V. Gabrelian, T. V. Vu, P. N. Shkumat, P. M. Fochuk, O. V. Parasyuk, I. V. Kityk, I. V. Luzhnyi, O. Y. Khyzhun and M. Piasecki, Inorg. Chem., 2016, 55, 10547–10557 CrossRef CAS PubMed.
- S. J. Clark, M. D. Segall, C. J. Pickard, P. J. Hasnip, M. I. Probert, K. Refson and M. C. Payne, Z. Kristallogr., 2005, 220, 567–570 CAS.
- M. Segall, P. J. Lindan, M. A. Probert, C. Pickard, P. Hasnip, S. Clark and M. J. Payne, Phys. Condens. Matter, 2002, 14, 2717 CrossRef CAS.
- J. P. Perdew, J. A. Chevary and S. H. Vosko, et al., Phys. Rev. B: Condens. Matter Mater. Phys., 1992, 46, 6671–6687 CrossRef CAS.
- D. M. Ceperley and B. Alder, Phys. Rev. Lett., 1980, 45, 566 CrossRef CAS.
- D. Vanderbilt, Phys. Rev. B: Condens. Matter Mater. Phys., 1990, 41, 7892 CrossRef.
- B. G. Pfrommer, M. Cote, S. G. Louie and M. L. Cohen, J. Comput. Phys., 1997, 131, 233–240 CrossRef CAS.
- H. J. Monkhorst and J. D. Pack, Phys. Rev. B: Solid State, 1976, 13, 5188 CrossRef.
- V. E. Henrich, The surface science of metal oxides, ed. P. A. Cox, Cambridge University Press, Cambridge, 1994 Search PubMed.
- O. Y. Khyzhun, V. L. Bekenev, V. V. Atuchin, E. N. Galashov and V. N. Shlegel, Mater. Chem. Phys., 2013, 140, 588–595 CrossRef CAS.
- V. V. Atuchin, O. Y. Khyzhun, O. D. Chimitova, M. S. Molokeev, T. A. Gavrilova, B. G. Bazarov and J. G. Bazarova, J. Phys. Chem. Solids, 2015, 77, 101–108 CrossRef CAS.
- V. V. Atuchin, L. D. Pokrovsky, O. Y. Khyzhun, A. K. Sinelnichenko and C. V. Ramana, J. Appl. Phys., 2008, 104, 033518 CrossRef.
- C. V. Ramana, V. V. Atuchin, U. Becker, R. C. Ewing, L. I. Isaenko, O. Y. Khyzhun, A. A. Merkulov, L. D. Pokrovsky, A. K. Sinelnichenko and S. A. Zhurkov, J. Phys. Chem. C, 2007, 111, 2702–2708 CAS.
- O. Y. Khyzhun, V. L. Bekenev, V. V. Atuchin, A. K. Sinelnichenko and L. I. Isaenko, J. Alloys Compd., 2009, 477, 768–775 CrossRef CAS.
- O. Y. Khyzhun, V. L. Bekenev and Y. M. Solonin, J. Alloys Compd., 2009, 480, 184–189 CrossRef CAS.
- A. O. Fedorchuk, O. V. Parasyuk and I. V. Kityk, Mater. Chem. Phys., 2013, 139, 92–99 CrossRef CAS.
- M. I. Kolinko, I. V. Kityk and A. S. Krochuk, J. Phys. Chem. Solids, 1992, 53, 1315–1320 CrossRef CAS.
- B. Andriyevsky, W. Ciepluch-Trojanek and V. Stadnyk, et al., J. Phys. Chem. Solids, 2007, 68, 1892–1896 CrossRef CAS.
- P. Smok, I. V. Kityk and J. Berdowski, Phys. B, 2003, 328, 163–172 CrossRef CAS.
- O. V. Bovgyra, V. Y. Stadnyk and O. Z. Chyzh, Phys. Solid State, 2006, 48, 1200–1204 CrossRef.
- M. Y. Rudysh, V. Y. Stadnyk, R. S. Brezvin and P. A. Shchepanskii, J. Phys. C: Solid State Phys., 2015, 57, 53–58 CrossRef CAS.
- D. Sanchez-Portal, E. Artacho and J. M. Soler, Solid State Commun., 1995, 95, 685–690 CrossRef CAS.
- B. Andriyevsky, N. Esser and A. Patryn, et al., Phys. B, 2006, 373, 328–333 CrossRef CAS.
- D. C. Wallace, Thermodynamics of crystals, Wiley, New York, 1972 Search PubMed.
- M. Fox, Optical properties of solids, Oxford University Press, Oxford, 2001 Search PubMed.
- M. Dressel, B. Gompf, D. Faltermeier, A. K. Tripathi, J. Pflaum and M. Schubert, Opt. Express, 2008, 16, 19770–19778 CrossRef CAS PubMed.
- S. Saha, T. P. Sinha and A. Mookerjee, Phys. Rev. B: Condens. Matter Mater. Phys., 2000, 62, 8828–8834 CrossRef CAS.
- O. Y. Khyzhun, V. L. Bekenev and Y. M. Solonin, J. Alloys Compd., 2008, 459, 22–28 CrossRef CAS.
- A. Meisel, X-Ray Spectra and Chemical Binding, ed. G. Leonhardt and R. Szargan, Springer-Verlag, Berlin, Heidelberg, 1989 Search PubMed.
| This journal is © The Royal Society of Chemistry 2017 |

