 Open Access Article
High electrical conductivity in Ba2In2O5 brownmillerite based materials induced by design of a Frenkel defect structure†
Shigeharu Itoab,
Toshiyuki Mori *a,
Pengfei Yana,
Graeme Auchterloniec,
John Drennanc,
Fei Yed,
Keisuke Fuganeae and
Takaya Satob
aSolid Oxide Fuel Cell Materials Design Group, Global Research Center for Environment and Energy Based on Nanomaterials Science (GREEN), National Institute for Materials Science (NIMS), 1-1 Namiki, Tsukuba, Ibaraki 305-0044, Japan. E-mail: MORI.Toshiyuki@nims.go.jp; Fax: +81 29 860 4712; Tel: +81 29 860 4395
bDepartment of Creative Engineering, Chemical and Biological Course, National Institute of Technology, Tsuruoka College, 104 Sawada, Inoka, Tsuruoka, Yamagata, 997-8511 Japan. E-mail: s-ito@tsuruoka-nct.ac.jp; Fax: +81 235 25 9119; Tel: +81 235 25 9119
cCentre for Microscopy and Microanalysis, The University of Queensland, St. Lucia, Brisbane, Qld 4072, Australia. E-mail: j.drennan@uq.edu.au; Fax: +61 7 3365 4422; Tel: +61 7 3365 6353
dSchool of Material Science and Engineering, Dalian University of Technology, 2 Linggong Road, Dalian 116024, China. E-mail: yefei@dlut.edu.cn; Fax: +86 411 84709230; Tel: +86 411 84709230
eDENSO CORPORATION, 1-1 Showa-cho, Kariya, Aichi 448-8661, Japan. E-mail: KEISUKE_FUGANE@denso.co.jp; Fax: +81 561 75 1193; Tel: +81 561 75 1061
First published on 16th January 2017
Abstract
To improve the electrical conductivity in the Ba2In2O5 (BIO) system without a large volume change from room temperature to 1273 K, BIO materials dually doped with Zr4+ and Zn2+ samples were prepared by using a soft chemical method. Ba2(In0.7,(Zn0.5,Zr0.5)0.3)2O5 (BIZZO-0.3) consists of an orthorhombic phase from room temperature to 1273 K. While phase transformation with a large volume change was not observed for BIZZO-0.3 in the aforementioned temperature region, the electrical conductivity observed for BIZZO-0.3 was higher than the disordered state of BIO when the measurement temperature of conductivity was more than 923 K. The effect of multiple doping on the enhancement of electrical conductivity was characterized by using the transmission electron microscopy (TEM) analysis. Also, the aforementioned effect was discussed in relation to the atomistic simulation result to explain the TEM observation results. The combination of XRD phase analysis, TEM observation and atomistic simulation indicates that a Frenkel defect cluster (i.e.  ) was formed in the ordered state of the BIO lattice. It is concluded that the formation of the Frenkel defect cluster in the BIO lattice contributes to the promotion of local disordering of oxygen vacancies at the microscopic scale and maximization of electrical conductivity in the BIO system.
1 Introduction
Barium indium oxide (Ba2In2O5) which consists of an orthorhombic brownmillerite-type structure has been examined in a variety of fast oxide ion conductors,1–5 as a high temperature (above 473 K) proton conductor,2,3,6,7 electro-catalyst for oxygen reduction reaction at room temperature,8 NOx removal catalyst,9 photocatalyst for degradation of methylene blue,10 and CO sensor.11 In practical research, the fast oxide ionic conducting phenomenon, which appears above the transition temperature (Tt = 1203 K) of an order–disorder transition of oxygen vacancies, has attracted attention.However, the large volume change (approximately 3.4 vol%) of the lattice occurs between ordered state and disordered state of Ba2In2O5 (BIO).12 The aforementioned volume change of the BIO lattice obstructs the application of BIO to solid-state devices. To use the functional properties of BIO as a solid-state device, many works tried to decrease Tt of the order–disorder transition of oxygen vacancies in BIO. In the previously reported works, the relationship between electrical conductivity and Tt was examined using Ba2(In,M)2O5 (M = Ga,13–16 Al,14,17 Sc,18,19 Y,18,19 Yb,18 Dy,18 Sm18) system, Ba2(In,(Sc,Lu))2O5 system,20 Ba2(In,M)2O5+δ (M = Zr,21,22 Ce,23,24 Ti,25 Sn,26 Si,27 V,28 Mo,28 W,29 P,30 S30) system, (Ba,M)2(In,Pb)2O5 system,31 (Ba,M)2InM2O5+δ (M = La,32 (Sr, La)33) system, (Ba,M)2(In,N)2O5 [(M, N) = (La, Ga),34 (La, Ce),35 (La, Zr),35 (La, Mg)35] system and fluorine doped Ba2In2O5+x system.36 The representative examples of aforementioned temperature dependence of conducting properties were summarized in Fig. 1.
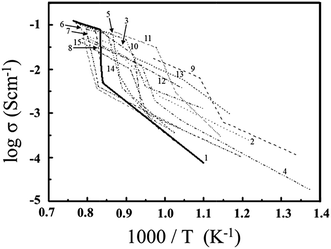 | ||
| Fig. 1 Temperature dependence of electrical conductivity observed for Ba2In2O5 without dopant and Ba2In2O5 based systems which consist of orthorhombic brownmillerite-type structure; 1: Ba2In2O5,1 2: Ba2(In0.8,Ga0.2)2O5,15 3: Ba2(In0.9,Ga0.1)2O5,16 4: Ba2(In0.9,Al0.1)2O5,17 5: Ba2(In0.9,Sc0.1)2O5,18 6: Ba2(In0.9,Y0.1)2O5,18 7: Ba2(In0.9,Yb0.1)2O5,18 8: Ba2(In0.9,Sm0.1)2O5,18 9: Ba2(In0.85,Y0.15)2O5,19 10: Ba2(In0.9,Ce0.1)2O5+δ,23 11: Ba2(In1.95,Sn0.05)2O5+δ,26 12: Ba2(In1.9,Mo0.1)2O5+δ,28 13: Ba2(In1.9,V0.1)2O5+δ,28 14: (Ba0.475,La0.025)2(In0.475,Ga0.025)2O5+δ,34 15: Ba2In2O4.99F0.02.36 | ||
This figure suggests that the observed conductivities of BIO based materials became low as compared with the electrical conductivity observed for the disordered state of BIO above 1203 K, even though Tt of the order–disorder transition of oxygen vacancies in aforementioned BIO based materials with dopant shifted into low temperature side. As a consequence of previously reported results, new design paradigm for fabrication of BIO system with high electrical conductivity which reveals small volume change between room temperature and operation temperature for device application is absolutely necessary.
For this challenge, the design of defect structure of BIO system based on unique idea is required. In the present work, we focused on order–disorder transition of cations in super-ionic conductors.
In the case of order–disorder transition of cations in super-ionic conductors such as AgI, CuI, Ag2S, Ag3I, and RbAg4I5, the theory for the phase transition of the cation disordered state was proposed by Rice et al.37 According to their theory, the interaction of interstitial cation defects with the strain field promotes the order–disorder transition of cations in the materials. The order–disorder transition of cations in super-ionic conductor is possible when following condition is satisfied in the materials:
| λ/ε0 > 0.98 | (1) |
In order to design the large number of interstitial sites which contributes to creation of the disordered oxygen vacancies in the ordered sate of BIO, the samples of Ba2((Zr0.5,Zn0.5)xIn1−x)2O5 (BIZZO-x, x = 0.1, 0.2 and 0.3) system were prepared by substitution of Zr4+ and Zn2+ for In3+ site of BIO. In the present work, the feature of defect structure of the BIO dually doped with Zr4+ and Zn2+ sintered bodies was characterized by using analytical transmission electron microscope (TEM). Also, the temperature dependence of the disordering of oxygen vacancies in the prepared samples was observed by using electrical conductivity measurement method. In the discussion section, the atomistic simulation was performed to conclude the relationship between electrical conductivity and introduction of interstitial defect sites (i.e. Frenkel defect sites) in the ordered state of BIO which consists of orthorhombic phase.
2 Experimental
2.1 Preparation of samples
BIO dually doped with Zr4+ and Zn2+ samples were prepared in a stepwise process. At first, non-doped BIO powder was prepared by a hot ammonium carbonate precipitation method. The starting materials used were commercially available Ba(NO3)2 (99% up, Wako Pure Chemical), In2(NO3)3·4.7H2O (99.99%, Kojundo Chemical), and (NH4)2CO3 (Wako Pure Chemical Industries, LTD.) powders. The Ba(NO3)2 powder and In2(NO3)3·4.7H2O were dissolved in distilled water.To prepare the fine precipitation, a (NH4)2CO3 aqueous solution was heated at 318 K in a thermostatic chamber. The mixed aqueous solution of Ba(NO3)2 and In2(NO3)3·4.7H2O was dropped into the (NH4)2CO3 aqueous solution for 1 h period, and this mixture was continuously stirred using magnetic stirrer at 318 K for 24 h. After filtration and rinsing, the precipitate was dried at room temperature in a N2 gas flow. The dried powders were calcined at 723 K for 2 h in an O2 gas flow.
Since it is hard to get the precipitation of Zn(OH)2 and ZnCO3 based precursors by using (NH4)2CO3 precipitation method, the commercially available ZnO power (purity: 99.999%, Kojundo Chemical Laboratory, Co. Ltd.), ZrO2 powder (TOSOH Company, 0Y grade) and prepared BIO fine powder were mixed by using ball milling method. A combination of ZnO, ZrO2, BIO and ethanol was mixed for 12 h, using Y2O3 partially stabilized ZrO2 balls and a milling pot which is made of Teflon. After drying, the dried cake was lightly crashed with agate motor and pestle. Then, the powder mixtures were calcined at 1273 K for 1 h in air. The glycerin as binder and the calcined powder were mixed by using aforementioned motor and pestle. The sample powders were molded under a pressure of 5 MPa and subjected to rubber press at 200 MPa. To remove the wax from the samples, the pellets were heated up to 573 K in air at a heating rate of 5 K min−1. After holding for 1 h, the sample pellets were sintered at 1573 K for 10 h in air.
2.2 Characterization
The crystal phase and structural refinements of BIO based compounds were carried out using RIETAN-FP software equipped with powder XRD analyzer (Rigaku: RINT-ULTIMA III). The XRD data for as-prepared products were analyzed assuming the oxygen stoichiometric structure (x = 0) with orthorhombic Ima2 symmetry (no. 46). Details in the refinements are given in Fig. S1 and Table S1 of the ESI.†The bulk densities were estimated from weight and geometrical dimensions (i.e. diameter and thickness) of the sintered pellets.
The microstructural features of BIO and Ba2In1.7(Zn0.5,Zr0.5)0.3O5 (BIZZO-0.3) sintered samples were investigated by TEM, using FEI Tecnai F30 (FEI Company, Hillsboro, OR, USA) operating at 300 kV. Selected area electron diffraction (SAED) analysis and TEM observation were applied to identify the crystal structure and to investigate the defect structure of the samples, respectively. TEM specimens were prepared by mechanical polishing and dimpling, followed by ion-beam thinning.
Electrical conductivity of the sintered samples was measured by a four-point probe DC method in the temperature ranging from 773 K to 1273 K in air. The dimension of the sintered samples was 3.5 mm × 3.5 mm × 15 mm in length. A platinum electrode was applied to all sides of the sintered samples by firing at 1273 K for 30 min. The activation energies of the samples were estimated from the Arrhenius plot using measured data in aforementioned temperature range for the electrical conductivity measurements.
2.3 Atomistic simulation
To explain the defect structural feature of BIZZO-0.3 sintered sample, the atomistic simulation was performed in the discussion section followed by the experimental results. The atomistic simulation technique used in the present study is based on energy minimization within the framework of the Born model, with the main features of interatomic potentials and modeling of perfect and defective lattices. The interactions between ions include the long range coulombic forces, short range forces and polarizations. The coulombic forces are summed by using Ewald's method, and the short range forces are modeled by using the Buckingham potential, described in the following equation:
E(rij) = Aij![[thin space (1/6-em)]](https://www.rsc.org/images/entities/char_2009.gif) exp(−rijρij−1) − Cijrij−6 exp(−rijρij−1) − Cijrij−6
| (2) |
The interactions arising from the polarizations of O2−, Ba2+, and In3+ are described by the shell model.42 The short-range interactions are set to zero beyond a cut-off of 7.5 Å. The polarized ions in the present model are described by a massive core with charge X|e| connected by a massless shell with charge Y|e|, resulting in the overall ion charge of (X + Y)|e|. The core and shell are connected by an isotropic harmonic spring with the force constant k. The shell parameters are listed in Table 2.39
To predict how a lattice accommodates defects, the Mott–Littleton two-region approach was used for the atomic simulation of the defect formation energy, which is coded in the General Utility Lattice Program (GULP).43
In this approach, the lattice for energy minimization is partitioned into two regions: a spherical inner region I, at the center of which the defects are introduced, and an outer region II, which extends to infinity. To ensure a smooth transition between regions I and II, an interfacial region IIa is introduced. In the present work, we used an inner region I with a radius of a0 (a0 is 16.71 Å, which is the lattice constant along a axis of brownmillerite-type BIO crystal) and an interfacial region IIa with a radius of 2.0a0.
To calculate the intrinsic defect energy, aforementioned Mott–Littleton two-region method was applied. Also, the binding energy ΔEb is calculated to investigate the preference and stability of defect clusters. It is described by using eqn (3);
| ΔEb = ΣEisolated − Ecluster | (3) |
3 Results and discussion
3.1 Rietveld analysis
The results of the Rietveld analysis of XRD for BIZZO-0.3 at room temperature are shown in Fig. 2. Also, the refined structural parameters are summarized in Table 3. All diffracted peaks can be assigned by orthorhombic phase as well as simple phase of brownmillerite BIO (see Fig. S1 in ESI†) with high reliability factors (i.e. RB, RF and RWP). In contrast, the peak intensities of some characteristic peaks of orthorhombic BIO (i.e. super-lattice peaks of BIO) became weak as shown in Fig. 2(i).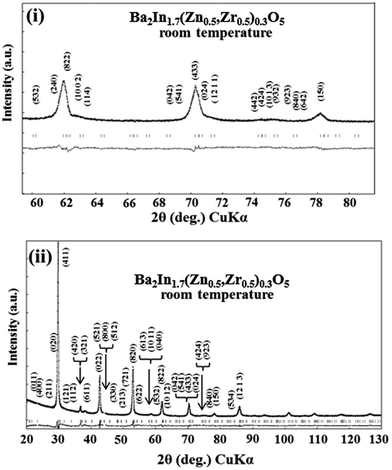 | ||
| Fig. 2 Rietveld analysis of XRD for Ba2In1.7(Zn0.5,Zr0.5)0.3O5 at room temperature. (i) 2θ range (60° ≦ 2θ ≦ 80°), (ii) 2θ range (20° ≦ 2θ ≦ 130°). | ||
| Ba2In1.7(Zn0.5,Zr0.5)0.3O5 | |||||
|---|---|---|---|---|---|
| Atom | Site | Occupancy | x | y | z |
| Ba | 8c | 1.00 | 0.62 | 0.49 | 0.00 |
| M1(In,Zn,Zr) | 4a | 1.00 | 0.00 | 0.00 | 0.02 |
| M2(In,Zn,Zr) | 4b | 1.00 | 0.25 | 0.46 | 0.47 |
| O1 | 8c | 1.00 | 0.99 | 0.25 | 0.25 |
| O2 | 8c | 1.00 | 0.14 | 0.03 | 0.06 |
| O3 | 4b | 1.00 | 0.25 | 0.74 | 0.29 |
| Number of formula units per the unit cell | Lattice contents (Å) | Lattice volume (Å3) |
|---|---|---|
| Z = 4 | a = 16.990 (Å) | V = 612.8 (Å3) |
| b = 6.007 (Å) | ||
| c = 6.005 (Å) | ||
| Space group Ima2 (no. 46), RB = 3.77 (%), RF = 1.58 (%), RWP = 5.21 (%), S = 1.85 | ||
This suggests that the disordering of oxygen vacancies at microscopic scale of BIZZO-0.3 compound is promoted by multiple doping. In the discussion section, we used the refined structural parameters which are shown in Table 3 as data of atomic coordinates for the atomistic simulation of the present work.
The temperature dependence of crystal phase change of BIZZO-0.3 was observed in the temperature range from room temperature to 1273 K by using high temperature XRD analysis method. As demonstrated in Fig. 3, no obvious crystal phase change was observed in the present work. And the super-lattice peaks of orthorhombic BIO were remained in the present observed temperature region, while peak intensity of super-lattice peaks was in quite small level. This indicates that partial disordering of oxygen vacancies of the BIZZO-0.3 was occurred in the present work.
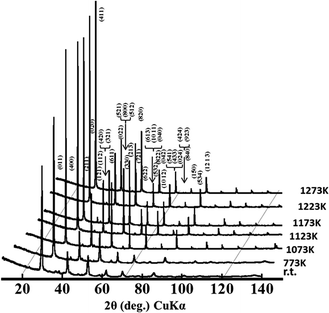 | ||
| Fig. 3 High temperature XRD profiles observed for Ba2In1.7(Zn0.5,Zr0.5)0.3O5 from room temperature to 1273 K. | ||
To observe partial disordering of oxygen vacancies of the sample at elevated temperature, the Rietveld analysis of XRD for BIZZO-0.3 at 1273 K was performed as well as room temperature. The results of Rietveld analysis of XRD for BIZZO-0.3 at 1273 K was demonstrated in Fig. 4. Also, the structural parameters of BIZZO-0.3 at 1273 K were summarized in Table 4.
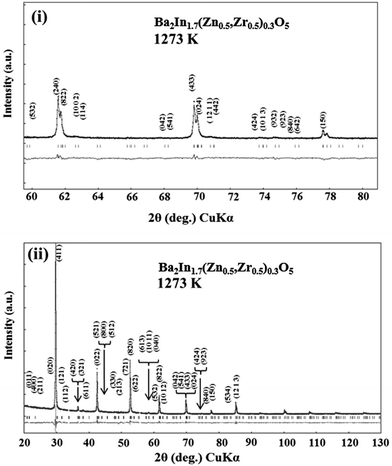 | ||
| Fig. 4 Rietveld analysis of XRD profiles for Ba2In1.7(Zn0.5,Zr0.5)0.3O5 at 1273 K. (i) 2θ range (60° ≦ 2θ ≦ 80°), (ii) 2θ range (20° ≦ 2θ ≦ 130°). | ||
| Ba2In1.7(Zn0.5,Zr0.5)0.3O5 (at 1237 K) | |||||
|---|---|---|---|---|---|
| Atom | Site | Occupancy | x | y | z |
| Ba | 8c | 1.00 | 0.63 | 0.50 | 0.00 |
| M1(In,Zn,Zr) | 4a | 1.00 | 0.00 | 0.00 | 0.01 |
| M2(In,Zn,Zr) | 4b | 1.00 | 0.25 | 0.55 | 0.52 |
| O1 | 8c | 1.00 | 0.99 | 0.25 | 0.25 |
| O2 | 8c | 1.00 | 0.12 | 0.04 | 0.01 |
| O3 | 4b | 1.00 | 0.25 | 0.77 | 0.35 |
| Number of formula units per the unit cell | Lattice contents (Å) | Lattice volume (Å3) |
|---|---|---|
| Z = 4 | a = 17.039 | V = 618.3 |
| b = 6.024 | ||
| c = 6.022 | ||
| Space group Ima2 (no. 46), RB = 5.96 (%), RF = 5.98 (%), RWP = 5.52 (%), S = 1.83 | ||
The super-lattice peaks of orthorhombic BIO were observed in Fig. 4(i). All peaks can be assigned as orthorhombic BIO with high reliability factors (i.e. RB, RF and RWP) as well as Table 3.
Since no crystal phase change was observed in whole measurement temperature region, the volume change of BIZZO-0.3 lattice which was estimated by using observed lattice constants in Table 3 (for room temperature) and Table 4 (for 1273 K) was in small level (i.e. approximately 0.89 vol%). This volume change between room temperature and 1273 K was negligible level for fabrication of solid-state device of BIO system.
3.2 Electrical property
Fig. 5(a) shows Arrhenius plots of electrical conductivity in BIZZO-x (x = 0.1, 0.2 and 0.3) system. The temperature dependence of electrical conductivity observed for BIZZO-x (x = 0.1, 0.2 and 0.3) system has curvatures. The observed curvatures shifted into low temperature region by an increase of amount of multiple dopants. The curvature observed for BIZZO-0.3 was around 923 K. This suggests that partial disordering of oxygen vacancies in BIZZO-0.3 with orthorhombic symmetry is promoted by multiple cations (i.e. Zr4+ and Zn2+) doping.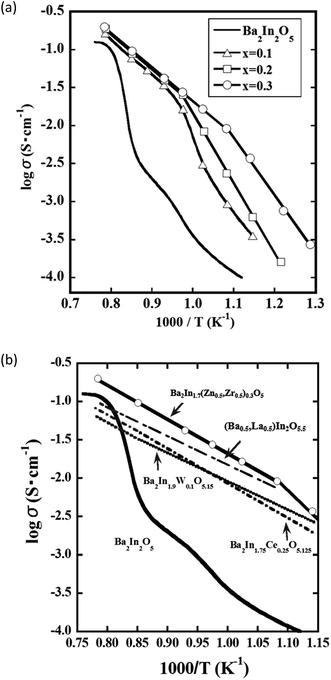 | ||
| Fig. 5 (a) Arrhenius plots of electrical conductivity observed for Ba2In2−x(Zn0.5,Zr0.5)xO5 (x = 0.0, 0.1, 0.2, 0.3) samples. Without symbol: x = 0.0 (Ba2In2O5), △: x = 0.1, □: x = 0.2, ◯: x = 0.3 in composition of Ba2In2−x(Zn0.5,Zr0.5)xO5, (b) Arrhenius plots of electrical conductivity observed for Ba2In2O5, Ba2In1.7(Zn0.5,Zr0.5)0.3O5, (Ba0.5,La0.5)2In2O5.5,32 Ba2In1.75Ce0.25O5.125 (ref. 1) and Ba2In1.9W0.1O5.15 (ref. 29) samples. | ||
To conclude the effect of aforementioned partial disordering of oxygen vacancies on electrical conductivity, the electrical conductivity observed for BIZZO-0.3 compared to previously reported data in Fig. 5(b).
As mentioned in Fig. 1, it was difficult to see better electrical conductivity of doped BIO systems as compared with the disordered state of BIO without dopant in previously reported works. In contrast, the electrical conductivity observed for BIZZO-0.3 was approximately two times higher than the conductivity in disordered state of BIO around 1273 K (see Fig. 5(b)). It indicates that the electrical conductivity in BIZZO-0.3 is conspicuously improved by partial disordering of oxygen vacancies in BIZZO-0.3 without large volume change of lattice.
3.3 Microanalysis
In order to conclude why the aforementioned partial disordering of oxygen vacancies in BIZZO-0.3 with orthorhombic symmetry was occurred, TEM observation was performed using BIO without dopant and BIZZO-0.3 sintered bodies.The 〈111〉 on zone image taken from BIO is shown in Fig. 6(i). The Fast Fourier Transform (FFT) pattern taken from Fig. 6(i) is presented in Fig. 6(ii). The FFT pattern indicates that the observed area in Fig. 6(i) consists of orthorhombic BIO phase. No other extra reflections were observed in there. In addition, Inverse Fast Fourier Transform (IFFT) image taken from the FFT pattern shows homogeneous lattice fringe contrast as shown in Fig. 6(iii). This indicates that BIO sintered body consists of homogeneous microstructure at microscopic scale.
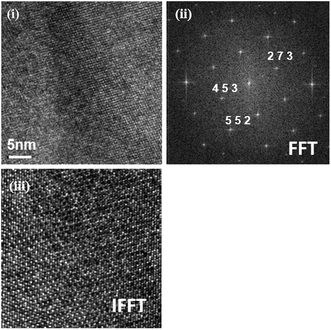 | ||
| Fig. 6 (i) TEM 〈111〉 zone images, (ii) FFT 〈111〉 patterns and (iii) IFFT 〈111〉 lattice fringe contrast taken from Ba2In2O5 sintered body. | ||
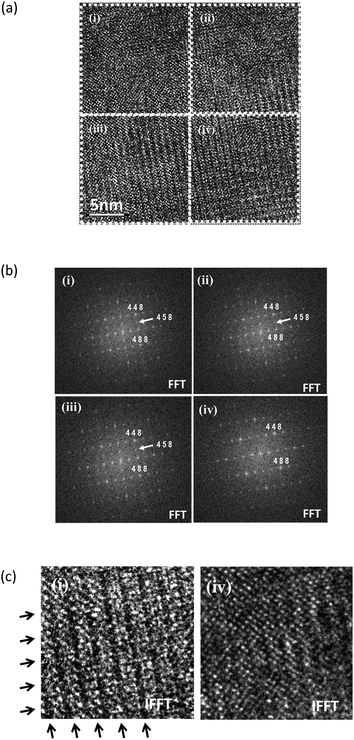
In contrast, 〈101〉 on zone image taken from BIZZO-0.3 shows different feature as compared with BIO (see Fig. 7(a)). The FFT patterns which are divided into four areas (i.e. from (i) to (iv)) taken from BIZZO-0.3 reveals the heterogeneous microstructural features as shown in Fig. 7(b). In the area (iv) of Fig. 7(b), different feature was observed as compared with other areas (i) to (iii). Also, IFFT image taken from the area (iv) has different lattice fringe contrast as compared with area (i) which is representative example of IFFT of areas (i) to (iii) (see Fig. 7(c)). This clearly indicates that the disordering of oxygen vacancies at microscopic scale is induced in the microstructure by multiple doping.
Fig. 8 shows the comparison of calculated diffraction patters of cubic phase which is disordered state of BIO (Pm3m (no. 221)) and orthorhombic phase which is ordered state of BIO (Ima2 (no. 46)). From comparison between Fig. 7 and 8, it is found that the area (i) to (iii) of Fig. 7(b) consists of cubic phase and phase analysis data observed for area (iv) corresponds to orthorhombic phase. Note that other zone image such as 〈100〉 zone shows same features (refer to Fig. S3(a)–(c) and S4 in ESI†).
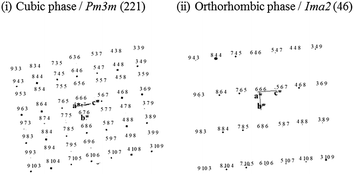 | ||
| Fig. 8 Calculated electron diffraction patterns along 〈110〉 zone axis direction of cubic phase (i) and orthorhombic phase (ii) of Ba2In2O5 brownmillerite. | ||
On the basis of all microanalysis results, it is confirmed that multiple dopants (i.e. Zr4+ and Zn2+) induced the partial disordering of oxygen vacancies at microscopic scale in BIO lattice.
3.4 Atomistic simulation
As mentioned in the Results section, we successfully fabricated BIO dually doped with ZnO and ZrO2 system which reveals small volume change and higher electrical conductivity as compared with the electrical conductivity of disordered state of BIO. To discuss the relationship between TEM microanalysis results and electrical conductivity observed for BIZZO-0.3, we performed atomistic simulation in the discussion section of the present work.In the present work, the defect formation reaction of introducing tetravalent Zr (Zr4+) and divalent Zn (Zn2+) cations to interstitial sites of BIO brownmillerite lattice which is written as eqn (4) is assumed.
 | (4) |
Eqn (4) indicates that seven interstitial sites are formed by Zn2+ and Zr4+ cations doping into brownmillerite lattice. Note that the co-doping of Zn2+ and Zr4+ will also simultaneously generate oxygen vacancy defects in the brownmillerite lattice. This implies the formation of possible defect structure which is accompanied by In3+ interstitial defect, Zn2+ interstitial defect, Zr4+ interstitial defect, oxygen interstitial defects and generated oxygen vacancies.
Our atomistic simulation can indicate the possible defect structure on the basis of eqn (4). And it is useful for discussion about the influence of Frenkel defect formation on both of the formation of disordered oxygen vacancies at microscopic scale and the enhancement of electrical conductivity in the BIZZO-0.3 compound.
For our atomistic simulation work, we calculated the energies of isolated point defects in BIO. Our calculated isolated energies agreed with previously reported values of BIO. The small deviation from the previously reported values would be within allowable range in the present work (see Table 5).
| Defect | Energy (eV) | 39 |
|---|---|---|
| Ba vacancy | 18.06 | 18.94 |
| In vacancy | 44.28 | 50.52 |
| O(1) vacancy | 18.35 | 20.21 |
| O(2) vacancy | 18.35 | 20.66 |
| Ba interstitial | −8.586 | −7.590 |
| O interstitial | −16.29 | −18.39 |
The cluster formation energy was calculated on the basis of eqn (4). We obtained the lowest cluster formation energy among all possible positions of aforementioned seven interstitial sites in BIO lattice. Five representative examples which provide us higher cluster formation energy (i.e. unstable cluster) were shown in ESI (refer to Fig. S5a to e in ESI†). Eventually, the highest binding energy (ΔEb) of defect clusters which consists of seven interstitial sites based on eqn (4) was calculated using the lowest cluster formation energy. The calculated ΔEb was 1.2 eV. It is high enough to conclude the formation of stable defect cluster in BIO based lattice. The configuration of aforementioned stable defect cluster was illustrated in Fig. 9(ii). Also, the standard configuration of cations and anions in orthorhombic BIO was demonstrated in Fig. 9(i) for comparison of defect structure between BIO and BIZZO-0.3. As shown in Fig. 9(ii), the two dopants (i.e. Zr4+ and Zn2+) were located at interstitial sites which are close to four coordination of oxygen around In sub-lattice site. The oxygen vacancy sites were created at aforementioned four coordination of oxygen and the six coordination of oxygen sites were apparently formed along a axis in the orthorhombic BIO to keep the local charge neutrality in the crystal. Then, the partial disordering of oxygen vacancies would be promoted at microscopic scale.
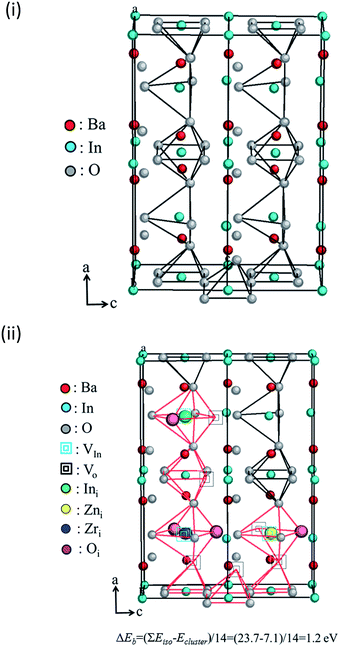 | ||
Fig. 9 Schematic diagram of proposed defect structure in Ba2In2−x(Zn0.5,Zr0.5)xO5 system: (i) Ba2In2O5 (x = 0.0), (ii) defect cluster  . . | ||
Our atomistic simulation suggests that the formation of large defect cluster with seven interstitial sites is stable in the brownmillerite lattice. Also, it is suggested that the local disordering of oxygen vacancies at microscopic scale is induced by multiple doping in our atomistic simulation works. Therefore, the additional hopping sites and continuous pathway for oxide ion diffusion would be created into BIZZO-0.3 by formation of aforementioned large defect clusters (refer to Fig. S6(a-i), (a-ii) and (b) in ESI†). On the basis of both the atomistic simulation and measurement of conductivity in the results section, it is concluded that the electrical conductivity in BIZZO-0.3 is maximized and volume change of BIO system is minimized by aforementioned local disordering of oxygen vacancies which is induced by seven interstitial defect sites in BIO lattice.
4 Conclusions
The defect structure of BIO based materials has to be designed based on unique idea which had not considered to oxide materials. It is because large volume change of conventional BIO lattice and previously reported BIO systems obstructs the application of BIO system as solid-state device. Also, the electrical conductivity of BIO systems has to be improved without aforementioned large volume change.In order to minimize volume change of BIO lattice and maximize the electrical conductivity in BIO system, we tried to design the defects in the interstitial sites of BIO lattice on the basis of concept of Rice et al. which was proposed for iodide super ionic conductors. To introduce the Frenkel defects (i.e. lattice defects of interstitial sites) into BIO lattice, we used two cations such as Zr4+ and Zn2+. BIZZO-0.3 consists of orthorhombic symmetry from room temperature to 1273 K. However, the electrical conductivity observed for BIZZO-0.3 was two times higher than the disordered state of BIO. In addition, the volume change of BIZZO-0.3 from room temperature to 1273 K (0.89 vol%) was much smaller than BIO without dopant (3.4 vol%).
Our TEM observation indicates that the disordering of oxygen vacancy was induced at microscopic scale in BIZZO-0.3. Also, our atomistic simulation suggests that the Frenkel defect clusters were formed in BIZZO-0.3 lattice. On the basis of results of the electrical conductivity measurement and atomistic simulation which is for explanation of TEM observation results, it is concluded that the disordering of oxygen vacancies at microscopic scale which is induced by large amount of Frenkel defect sites into BIO lattice contributes to improvement of the electrical conductivity in BIO system without large volume change.
Acknowledgements
The authors greatly appreciate the useful advice regarding of measurement of electrical conductivity by professor Hiroshi Yamamura and assistant Professor Miwa Saito of Kanagawa University (Kanagawa, Japan).References
- J. B. Goodenough, J. E. Ruiz-Diaz and Y. S. Zhen, Solid State Ionics, 1990, 44, 21–31 CrossRef CAS.
- G. B. Zhang and D. M. Smyth, Solid State Ionics, 1995, 82, 161–172 CrossRef CAS.
- T. Schober, J. Friedrich and F. Krug, Solid State Ionics, 1997, 99, 9–13 CrossRef CAS.
- T. Schober and J. Friedrich, Solid State Ionics, 1998, 113–115, 369–375 CrossRef CAS.
- M. Yoshinaga, T. Fumoto and T. Hashimoto, J. Electrochem. Soc., 2005, 152, A1221–A1225 CrossRef CAS.
- G. B. Zhang and D. M. Smyth, Solid State Ionics, 1995, 82, 153–160 CrossRef CAS.
- J. D. P. Jankovic, D. P. Wilkinson and R. Hui, J. Electrochem. Soc., 2011, 158, B61–B68 CrossRef CAS.
- C. P. Jijil, S. M. Unni, K. Sreekumar and R. N. Devi, Chem. Mater., 2012, 24, 2823–2828 CrossRef CAS.
- T. Mori, H. Yamamura, H. Ogino, H. Kobayashi and T. Mitamura, J. Am. Ceram. Soc., 1994, 77, 2771–2772 CrossRef CAS.
- W.-K. Chang, Y.-S. Wu, C.-Y. Tzeng and A.-Y. Lin, J. Alloys Compd., 2009, 478, 341–344 CrossRef CAS.
- X. Li, K. T. Jacob and G. M. Kale, J. Electrochem. Soc., 2010, 157, J285–J292 CrossRef CAS.
- P. Berastegui, S. Hull, F. J. Garcia-Garcia and S.-G. Eriksson, J. Solid State Chem., 2002, 164, 119–130 CrossRef CAS.
- H. Yamamura, Y. Yamada, T. Mori and T. Atake, Solid State Ionics, 1998, 108, 377–381 CrossRef CAS.
- H. Yamamura, H. Hamazaki, K. Kakinuma, T. Mori and H. Haneda, J. Korean Phys. Soc., 1999, 35, S200–S204 CAS.
- T. Yao, Y. Uchimoto, M. Kinuhata, T. Inagaki and H. Yoshida, Solid State Ionics, 2000, 132, 189–198 CrossRef CAS.
- M. Yoshinaga, M. Yamaguchi, T. Furuya, S. Wang and T. Hashimoto, Solid State Ionics, 2004, 169, 9–13 CrossRef CAS.
- N. A. Kochetova, I. V. Spesivtseva and I. E. Animitsa, Russ. J. Electrochem., 2013, 49, 176–180 CrossRef CAS.
- T. Q. Ta, T. Tsuji and Y. Yamamura, J. Alloys Compd., 2006, 408, 253–256 CrossRef.
- S. Noirault, E. Quarez, Y. Piffard and O. Joubert, Solid State Ionics, 2009, 180, 1157–1163 CrossRef CAS.
- M. Saito, S. Ito, T. Takayama and H. Yamamura, Trans. Mater. Res. Soc. Jpn., 2009, 33, 233–236 CrossRef.
- J. B. Goodenough, A. Manthiram and J.-F. Huo, Mater. Chem. Phys., 1993, 35, 221–224 CrossRef CAS.
- A. Manthiram, J.-F. Kuo and J. B. Goodenough, Solid State Ionics, 1993, 62, 225–234 CrossRef CAS.
- J. Niwa, T. Suehiro, K. Kishi, S. Ikeda and M. Maeda, J. Mater. Sci., 2003, 38, 3791–3795 CrossRef CAS.
- J. Jankovic, D. P. Wilkinson and R. Hui, J. Power Sources, 2012, 201, 49–58 CrossRef CAS.
- V. Jayaraman, A. Magrez, M. Caldes, O. Joubert, M. Ganne, Y. Piffard and L. Brohan, Solid State Ionics, 2004, 170, 17–24 CrossRef CAS.
- A. Rolle, H. Seymour, P. Roussel, A. Rubbens and R.-N. Vannier, Ionics, 2008, 14, 477–482 CrossRef CAS.
- J. F. Shin, D. C. Apperley and P. R. Slater, Chem. Mater., 2010, 22, 5945–5948 CrossRef CAS.
- A. Rolle, R. N. Vannier, N. V. Giridharan and F. Abraham, Solid State Ionics, 2005, 176, 2095–2103 CrossRef CAS.
- T. Shimura and T. Yogo, Solid State Ionics, 2004, 175, 345–348 CrossRef CAS.
- J. F. Shin, A. Orera, D. C. Apperley and P. R. Slater, J. Mater. Chem., 2011, 21, 874–879 RSC.
- H. Kuramochi, T. Mori, H. Yamamura, H. Kobayashi and T. Mitamura, J. Ceram. Soc. Jpn., 1994, 102, 1159–1162 CrossRef CAS.
- K. Kakinuma, H. Yamamura, H. Haneda and T. Atake, Solid State Ionics, 2001, 140, 301–306 CrossRef CAS.
- K. Kakinuma, H. Yamamura, H. Haneda and T. Atake, Solid State Ionics, 2002, 154–155, 571–576 CrossRef CAS.
- H. Yamamura, N. Kutsukake, K. Kakinuma, T. Mori and T. Atale, Electrochemistry, 1999, 67, 765–768 CAS.
- K. Kakinuma, N. Takahashi, H. Yamamura, K. Nomura and T. Atake, Solid State Ionics, 2004, 168, 69–74 CrossRef CAS.
- N. A. Tarasova, Y. V. Filinkova and I. E. Animitsa, Russ. J. Electrochem., 2013, 49, 50–56 Search PubMed.
- M. J. Rice, S. Strässier and G. A. Toombs, Phys. Rev. Lett., 1974, 32, 596–599 CrossRef CAS.
- M. Pasternak, N. Benczer-Koller, T. Yang, R. Ruel and R. H. Herber, Phys. Rev. B: Condens. Matter Mater. Phys., 1983, 27, 2055–2058 CrossRef CAS.
- C. A. Fisher, M. S. Islam and R. J. Brook, J. Solid State Chem., 1997, 128, 137–141 CrossRef CAS.
- D. J. Binks and R. W. Grimes, J. Am. Ceram. Soc., 1993, 76, 2370–2372 CrossRef CAS.
- G. Balducci, J. Kaspar, P. Fornasiero and M. Graziani, J. Phys. Chem. B, 1997, 101, 1750–1753 CrossRef CAS.
- C. A. Fisher and M. S. Islam, Solid State Ionics, 1999, 118, 355–363 CrossRef CAS.
- J. D. Gale, J. Chem. Soc., Faraday Trans., 1997, 93, 629–637 RSC.
Footnote |
| † Electronic supplementary information (ESI) available: Fig. S1. Rietveld analysis of XRD for BIO at room temperature. (a) 2θ range (60 ≦ 2θ ≦ 80), (b) 2θ range (20 ≦ 2θ ≦ 130). Table S1. Refined structural parameters of BIO at room temperature. Table S1 summarized the refined structural parameters of Ba2In2O5 at room temperature shown in Fig. S1. Fig. S2. XRD pattern and its magnified pattern observed for BIZZO-0.3 at room temperature and 1273 K. Table S2. Lattice volumes estimated by Rietveld analysis data. Fig. S3. TEM images taken from BIZZO-0.3. (a) 〈100〉 on zone image taken from BIZZO-0.3, (b) FFT patterns of 〈100〉 on zone images and (c) IFFT images taken from FFT patterns. Fig. S4. Calculated electron diffraction patterns along 〈100〉 zone axis direction of cubic phase (i) and orthorhombic phase (ii) of BIO brownmillerite. Fig. S5. Representative 5 examples of unstable cluster models. Fig. S6. (a) Comparison of oxygen vacancy sites which were created in unite cell of disordered state of BIO (a-i) and BIZZO-0.3 (a-ii), (b) schematic diagram for explanation of TEM image. See DOI: 10.1039/c6ra27418h |
| This journal is © The Royal Society of Chemistry 2017 |

