 Open Access Article
Creative Commons Attribution 3.0 Unported Licence
Preparation, characterization and catalytic performance of HPW/aEVM catalyst on oxidative desulfurization
Pengcheng Huanga,
Guangqin Luoa,
Lihua Kangab,
Mingyuan Zhu*ab and
Bin Daiab
aSchool of Chemistry and Chemical Engineering, Shihezi University, Shihezi, Xinjiang 832003, P. R. China. E-mail: zhuminyuan@shzu.edu.cn; Fax: +86 9932057210; Tel: +86 9932057270
bKey Laboratory for Green Processing of Chemical Engineering of Xinjiang Bingtuan, Shihezi, Xinjiang 832003, P. R. China
First published on 16th January 2017
Abstract
Expanded vermiculite (EVM) was prepared, treated with acid (aEVM) and incorporated with H3PW12O40 (HPW) by an ordinary impregnation method. Various characterizations of the HPW/aEVM catalyst indicated that the HPW was dispersed homogeneously on the aEVM support. The catalytic activity of the HPW/aEVM catalyst was evaluated in the catalytic oxidation process of dibenzothiophene (DBT), and the optimal reaction conditions were investigated, including the loading quantity of the phosphotungstic acid, the reaction temperature and time, the O/S (H2O2/sulfur) molar ratio, and the catalyst dosage. Under the experimental conditions, the sulfur removal rate for model oil was almost 100%. After 7 recycles, the loss of catalytic activity was only 99.95 to 98.06%.
1. Introduction
The existence of sulfur compounds in fuel oil is the main source of SOx emissions. The emissions of SOx not only cause acid rain but also reduce the conversion efficiency of automobile exhaust converters for pollutants. Because of increasing environmental problems in recent years, most countries enforce strict regulations for the sulfur content in fuel oil. Oxidative desulfurization (ODS) processes have advantages such as mild reaction conditions, simple operation processes, good desulfurization effects, and have become one of the most promising deep desulfurization methods in recent years.1In this study, the ODS process was investigated with oxidants, extraction agents and various catalysts, including ionic liquids,2 organic acids,3 inorganic acids4 and heteropoly acids (HPAs).5 Among these catalysts, the Keggin structure possessed by some HPA catalysts were proven to be very effective for the ODS of fuel oil.6
However, the heteropoly acid catalyst easily dissolves and is difficult to separate and recover for the next use. For this reason, HPAs should be immobilized on a solid support to provide the stable and water-tolerant ability of the catalyst. Many researchers tried to solve this problem by immobilizing HPW on the surface of a solid support, such as SiO2,7 TUD-1.8 and SBA-15.9 With simple filtration, the solid catalyst can be reused for the cycles of the ODS process. In our previous study, we observed that amino-functionalized MCM-41 and mesoporous graphitic carbon act as the support of HPAs, and an excellent recycle rate can be obtained for the ODS process of fuel oil. However, The MCM-41 molecular sieve and mesoporous graphitic carbon are not cost effective because of their complicated synthesis process.
Vermiculite (VMT) is a natural mineral that is inexpensive and abundant in China, especially in the Xinjiang province. VMT has typical features, such as a lamellar structure and high ion exchange capacity, which allows interactions with organic substances.10 Actually, VMT has been well investigated in different catalysis areas, such as DeNOx processes,11 photocatalysis12 and as catalysts for ethanol oxidation.13 Therefore, it was inferred that VMT may serve as the support of HPAs and applied in ODS processes. In this study, we synthesized a HPW/aEVM catalyst, characterized it and evaluated its catalytic performance. The aim of this work was to develop a new catalyst that is cost effective and has potential applications in the oxidative desulfurization of fuel oil.
2. Experimental section
2.1. Pretreatment of VMT
Raw VMT samples were supplied by Xinjiang YuliXinlong Vermiculite Co., Ltd., China, The element composition of raw VMT and aEMV are given in Table 1. The preparation method for HPW/aEVM catalysts was very similar to that as reported in the literature.14,15 Raw VMT (150 g) were first treated with hydrogen peroxide (30% concentration, 750 ml) at 353 K for 2 h and then dried at 800 W in a microwave oven for 1 min. Then, the dried EVM was ground in a pulverizer and sieved through a 120-mesh sieve. The acid treatment processes were conducted by placing the obtained EVM (1 g) powder in a chloroazotic acid solution (20 ml) with different concentrations in the ranges of 0.5 to 6 mol L−1. The mixture was placed under mechanical stirring at 353 K for 5 h, and after the mixture cooled to room temperature, solid precipitates were collected through a centrifugal method and washed several times with deionized water until they were chloride-free.16 The samples were dried overnight at 373 K to yield the aEVM.| Sample | O | Si | Mg | Al | K | Fe | Na | Ti | Ca | W |
|---|---|---|---|---|---|---|---|---|---|---|
| Raw VMT (wt%) | 39.21 | 23.13 | 17.69 | 8.35 | 5.06 | 3.53 | 1.24 | 1.07 | 0.72 | — |
| 20% HPW/aEVM (wt%) | 45.39 | 49.75 | 1.14 | 1.07 | 0.34 | 0.68 | 0.05 | 0.43 | 0.13 | 1.02 |
2.2. HPW/aEVM catalyst preparation
H3PW12O40 (0.25 g) was first dissolved in purified water (10 ml) and then placed the aEVM powder (1 g) to the phosphotungstic acid solution with vigorous stirring for 24 h under 333 K. The solid samples were collected by filtration, washed with purified water and then dried at 383 K to yield the 20% HPW/aEVM catalyst. The 10% and 30% HPW/aEVM catalysts were obtained only by varying the amounts of phosphotungstic acid.2.3. Characterization
Brunauer–Emmett–Teller (BET) surface area analysis was conducted by using a Micromeritics Model ASAP 2020 instrument at 77 K to obtain the nitrogen adsorption isotherms. All VMT samples were degassed for 6 h under a vacuum at 383 K. FT-IR spectra were conducted by a Nicolet AVATAR 360. The transmission electron microscopy (TEM) analysis results were obtained by using a Tecnai F30 field emission TEM. Inductively coupled plasma atomic emission spectroscopy (ICP-AES) experiments were conducted on a thermo scientific ICAP 6000 series ICP spectrometer. The XRD pattern data were obtained on a Bruker advanced D8 X-ray diffractometer equipped with a Cu-Kα irradiation (λ = 1.5406 Å) as source at 40 mA and 40 kV.2.4. Catalytic ODS process
The oxidative desulfurization process was conducted at 333 K in a three-necked flask accompanied by a condensing system. Model oils with 100 ppm sulfur concentration were obtained by dissolving dibenzothiophene (DBT), 4,6-dimethyldibenzothiophene (4,6-DMDBT), thiophene (Th), and benzothiophene (BT) compounds into 10 ml n-octane in a 100 ml three-necked flask. The ODS system included model oils, oxidant H2O2, and the HPW/aEVM catalyst. All components were mixed in a three-necked flask and fixed in a water bath under magnetic stirring and reflux. After reaching the optimal reaction time, the upper clarified model oil was collected and extracted by methanol. Then, the sulfur content was detected by a microcoulometric detector (WK-2D). The solid catalyst was recycled by suction filtration and washed with methanol.3. Results and discussion
3.1. The concentration of acid treatment options
The specific surface area analysis results of the EVM treated with different acid concentrations are presented in Table 2. Based on the data, the surface area of the EVM was only 4.42 m2 g−1, however, after treated with an acid solution of 1.5 mol L−1, the surface area increased to 714.81 m2 g−1. The SBET result of the leached samples increased with the acid concentrations changed from 0.5 to 2 mol L−1. However, when the acid concentrations increased from 2 to 6 mol L−1, the SBET result gradually decreased, which illustrated that the micropores formed by the leaching of the octahedral layers were unstable and decreased rapidly at high acid concentrations.17| Acid concentration (mol L−1) | SBET (m2 g−1) | Conversion of DBT (%) |
|---|---|---|
| 0 | 4.42 | 63.11 |
| 0.5 | 6.50 | 65.20 |
| 1 | 325.57 | 76.23 |
| 1.5 | 714.81 | 99.89 |
| 2 | 720.12 | 100 |
| 3 | 628.24 | 100 |
| 6 | 622.30 | 99.99 |
Moreover, as the acid concentration increased, the removal rate of the sulfocompound increased gradually. When the acid solution reached 1.5 mol L−1, the sulfur removal rate was almost 99.89%. Since the desulfurization rate did not vary significantly with the improvement of acid concentration over 1.5 mol L−1, we choose the concentration of 1.5 mol L−1 as an optimal experimental condition.
3.2. Characterization of the catalyst
Fig. 1 shows the X-ray diffraction patterns of the HPW, raw VMT, EVM and HPW/aEVM samples with different contents of HPW (10–30%). The XRD patterns of the raw material (Fig. 1B), shows the characteristic peaks of vermiculite.18 In Fig. 1A we observed a broad peak at 2θ = 23.3° in the aEVM samples, which proved that the mesoporous silica of the aEVM was amorphous.19 These characteristic peaks were also observed in the other three HPW/aEVM catalysts. However, different contents of the phosphotungstic acid catalyst showed no characteristic diffraction peaks of HPW, which proved that the HPW was dispersed homogeneously on the aEVM support.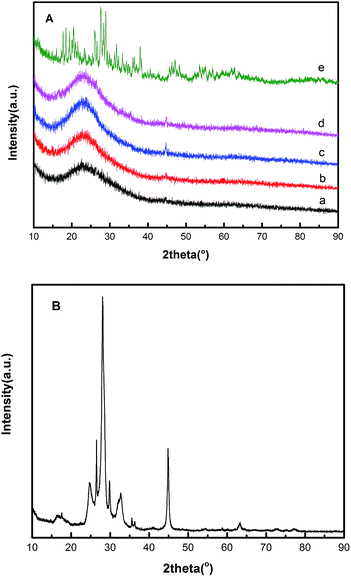 | ||
| Fig. 1 (A) The wide-angle XRD patterns of (a) aEVM, (b) 10% HPW/aEVM, (c) 20% HPW/aEVM, (d) 30% HPW/aEVM and (e) HPW. (B) XRD patterns of raw VMT. | ||
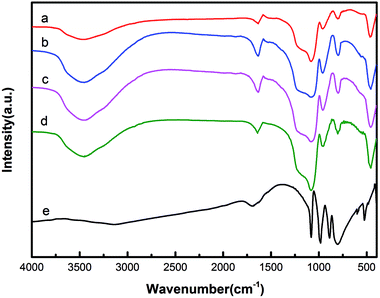
The FT-IR spectra of EVM, HPW and HPW/aEVM samples with different contents of HPW are shown in Fig. 2. We observed that the pure HPW samples with Keggin structures presented four strong IR peaks at 802 cm−1 and 889 cm−1 (corresponding to the W–Oc–W and W–Ob–W bands, respectively), 981 cm−1 (terminal bands for W = O in the exterior WO6 octahedron), and 1080 cm−1 (stretching frequency of P–O in the central PO4 tetrahedron).20 The aEVM sample displayed the band (at 460, 802, and 1078 cm−1) that corresponded to the vibrational modes of SiO2. The bands at 802 and 1078 cm−1 corresponded to the symmetric and anti-symmetric stretching frequency of Si–O–Si. The bands at 952 cm−1 corresponded to the stretching frequency of Si–O–H.21 For the HPW/aEVM sample, no significant differences of characteristic bands were observed after loading the phosphotungstic acid. In particular, the P–O band of HPW was not clearly observed in the HPW/aEVM samples because of the coverage of the broad Si–O–Si band.22 In addition, the bands of the 20% HPW/aEVM samples were slightly strengthened compared with those of the unsupported samples. This further proved the incorporation of HPW into aEVM frameworks.
Fig. 3 shows the morphologies of raw VMT, EVM and HPW/aEVM samples with different contents of HPW. As shown in Fig. 3a and b, EVM was successfully prepared by placing the raw VMT into the H2O2 aqueous solution bath. The expanded samples exhibited obvious interlayer gallery structures. After acid treatment, channels formed on the surface of the EVM sample, but the layered framework was retained (Fig. 3c). When loading on the phosphotungstic acid, the channel structure remained but the HPW species were not observed (Fig. 3d–f), which suggested that the phosphotungstic acids were dispersed homogeneously on the channel and layer of aEVM.
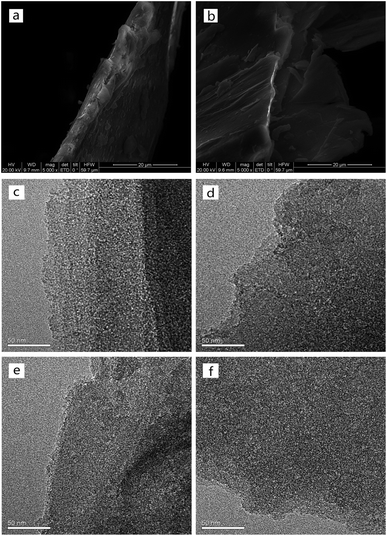 | ||
| Fig. 3 SEM images of (a) raw VMT, (b) EVM, and TEM images of (c) aEVM, (d) 10% HPW/aEVM, (e) 20% HPW/aEVM, (f) 30% HPW/aEVM. | ||
The N2 adsorption/desorption isotherms of the aEVM and HPW/aEVM samples with different contents of HPW are shown in Fig. 4A. The four samples presented an hysteresis loop range from 0.4 to 0.8 relative pressure, and the isotherm patterns were similar to type IV isotherm. These characteristics corresponded to the mesoporous materials with the pore channel formed in the interlayer framework.20 Fig. 4B shows the pore size distribution curve of 20% HPW/aEVM, the average pore size is very uniform and centered at around 2.39 nm. The physical–chemical parameters of the four aEVM samples are shown in Table 3. Compared with those of the aEVM samples, the SBET and VP results of the HPW/aEVM samples decreased with the content increase of HPW, which corresponded to the blockage of heteropolyanions on the mesopores structure of the support.
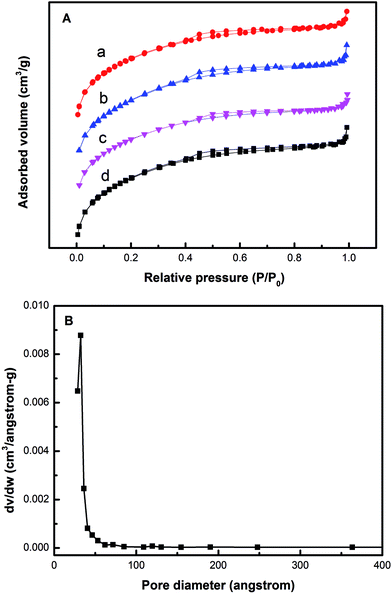 | ||
| Fig. 4 (A) N2 adsorption–desorption isotherms of (a) 10% HPW/aEVM, (b) 20% HPW/aEVM, (c) 30% HPW/aEVM and (d) aEVM. (B) Pore size distribution curve of 20% HPW/aEVM. | ||
| Sample | SBET (m2 g−1) | VP (cm3 g−1) | D (nm) |
|---|---|---|---|
| aEVM | 714.81 | 0.413 | 2.44 |
| 10% HPW/aEVM | 682.65 | 0.409 | 2.39 |
| 20% HPW/aEVM | 676.31 | 0.399 | 2.39 |
| 30% HPW/aEVM | 624.01 | 0.373 | 2.23 |
3.3. Catalytic results
The catalytic effects of the HPW/aEVM catalyst with different HPW loadings were evaluated on a three-necked flask by dissolving DBT in normal octane as the model fuel oil. As shown in Fig. 5, the DBT conversion follows the order of 20% HPW/aEVM > 30% HPW/aEVM > 10% HPW/aEVM. These results demonstrated that different loading contents of active tungsten species may have influenced the experimental results.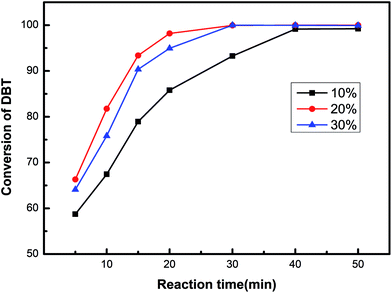 | ||
| Fig. 5 The conversion of DBT of the HPW/aEVM catalysts with different loading. T = 333 K, O/S = 6, catalyst dosage = 0.04 g/10 ml, t = 0.5 h. | ||
When the loading content increased from 10% to 20%, the catalytic effect was obviously enhanced. A complete conversion of DBT (100%) was obtained in 0.5 h, with the HPW content reached 20%. This phenomenon was attributed to the high dispersion of HPW on the aEVM support. However, when the HPW contents increased to 30%, the desulfurization effect slightly decreased, which was attributed to the blockage of HPW on the pore channel. These performances were conform to the BET analysis results, wherein the SBET and VP reduced as the HPW contents increased. Since the mesoporous pores provided the transferring channel for the sulfocompound, high contents of HPW may block the mesoporous pores, which was the primary cause of the decrease in catalytic activity. Consequently, the 20% HPW/aEVM catalyst was chosen for the subsequent ODS process.
Fig. 6 shows the four main reaction conditions. Fig. 6A shows the conversion of DBT oxidated to its corresponding sulfones increased with the increment of reaction times. The conversion rate was almost 100% with 0.5 h. The optimal dosage of the HPW/aEVM catalyst in the ODS process with an organic sulfur concentration of 100 ppm was presented in Fig. 6B. The desulfurization conversion increased with the increment of the catalyst dosage. When the dosage of catalyst increased to 40 mg/10 ml, the curve was close to saturation. This result demonstrated that sufficient number of active sites could be provided with the catalyst concentration of 40 mg/10 ml. Fig. 6C shows the catalytic activities of the 20% HPW/aEVM catalyst with the O/S mole ratio range from 2 to 10. The conversion of DBT significantly increased with the improvement of O/S molar ratio. When the ratio reached 6, the desulfurization conversion was almost 100% and remained constant above this ratio. However, the value for oxidize DBT to its corresponding sulfone was much higher than the stoichiometric value O/S = 2, because the excess hydrogen peroxide supplemented the consumption of thermal decomposition.23 The effect of temperature on the ODS process was investigated as shown in Fig. 6D. In the range of 303 K to 343 K, the reaction was performed with O/S = 6. The conversion of DBT increased from 58.62% to 99.98% when the temperature increased from 303 K to 333 K. This process was attributed to the peroxo metal complex W(O2)n in HPW active species increased with improving the reaction temperature.22 The ODS process depended on W(O2)n as the primary active component for the oxidation of sulfide. When increasing the temperature to 343 K, the desulfuration effect had a slight decrease. This was owing to H2O2 decomposing and the decrease of the W(O2)n complex with a higher temperature.
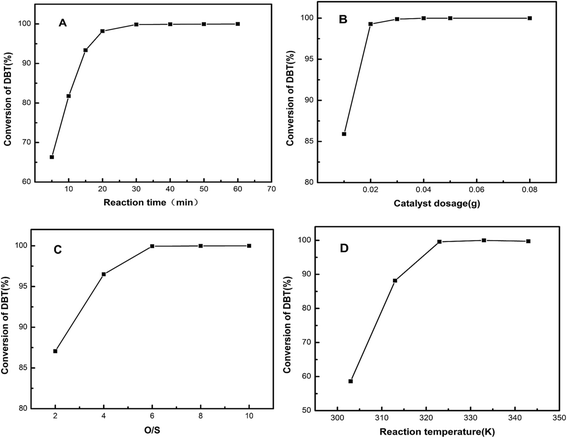 | ||
| Fig. 6 Effect of the (A) reaction time, (B) catalyst dosage, (C) O/S molar ratio and (D) reaction temperature on the conversion of DBT. T = 333 K, O/S = 6, catalyst dosage = 0.04 g/10 ml, t = 0.5 h. | ||
Kinetic experiments were performed to better illustrate the reaction activation energy. The ODS process followed pseudo-first-order reaction kinetics, with eqn (1).
 | (1) |
According to Fig. 7A, the reaction rate constant (k) was obtained by the slope of the linear plot of ln(c0/ct) versus reaction time t from eqn (2).
| ln(ct/c0) = −kt | (2) |
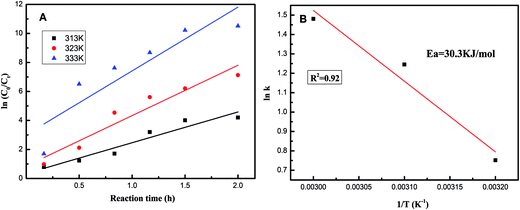 | ||
| Fig. 7 (A) Fitting of experimental data to the pseudo-first-order rate model. (B) Arrhenius activation energies for DBT of 20% HPW/aEVM catalyst. | ||
The apparent activation energy for the ODS process was obtained according to various (k) values obtained at different temperatures with eqn (3).
 | (3) |
As shown in Fig. 7B, according to the Arrhenius equation, we calculated the apparent activation energy for the oxidative desulfurization of DBT to be 30.3 kJ mol−1. This result was slightly lower than the previously reported value,24 which indicated that the HPW/aEVM catalyst had excellent catalytic activity.
Fig. 8 shows the catalytic oxidation results of different sulfur substrates in the model oil. The oxidative desulfurization activity followed the order DBT > 4,6-DMDBT > Th > BT. This was attributed to different sulfides that varied in electron densities of the sulfur atom. The conversion of DBT reached nearly 100% within 0.5 h, while BT reached only 41.54%, which was consistent with the electron densities of DBT (5.758) being higher than BT (5.739). Similar electron densities (5.760 versus 5.758) existed for 4,6-DMDBT and DBT on the sulfur atom but the oxidative desulfurization activity exhibited a significant difference. The conversion of 4,6-DMDBT reached only 67.01% within 0.5 h, it might be the methyl groups that caused steric hindrance. The methyl groups of 4,6-DMDBT become an obstacle for the catalytic active site of the catalyst to approach the sulfur atom.
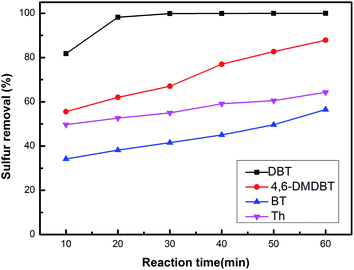 | ||
| Fig. 8 The sulfur removal of different substrate with 20% HPW/aEVM as catalyst: T = 333 K, O/S = 6, catalyst dosage = 0.04 g/10 ml, t = 0.5 h. | ||
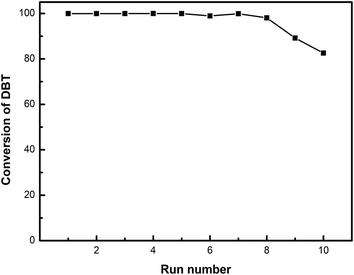
The 20% HPW/aEVM catalyst was recycled to investigate the reusability and stability, and with each recycle, the catalyst was filtered, washed with methanol, and dried at 353 K. Fig. 9 shows the desulphurization effect of the fresh and spent catalyst after 1–7 recycles. The conversion of DBT decreased from 99.95% to 98.06% after 7 recycles, which indicated that the 20% HPW/aEVM catalyst had excellent regenerability and the HPW species acted as the active component for the sulfur compounds oxidated to its corresponding sulfones.
To investigate the W and P contents and calculate the corresponding content of HPW in the 20% HPW/aEVM catalyst after 1–7 recycles, we performed an ICP-AES experiment. As shown in Table 4, the atomic ratio of P![[thin space (1/6-em)]](https://www.rsc.org/images/entities/char_2009.gif) :
:![[thin space (1/6-em)]](https://www.rsc.org/images/entities/char_2009.gif) W (1
W (1![[thin space (1/6-em)]](https://www.rsc.org/images/entities/char_2009.gif) :
:![[thin space (1/6-em)]](https://www.rsc.org/images/entities/char_2009.gif) 11.5) was close to the stoichiometric ratio (1
11.5) was close to the stoichiometric ratio (1![[thin space (1/6-em)]](https://www.rsc.org/images/entities/char_2009.gif) :
:![[thin space (1/6-em)]](https://www.rsc.org/images/entities/char_2009.gif) 12). Moreover, the W and P content in the fresh 20% HPW/aEVM catalyst were 11.74% and 0.17%, respectively. The catalytic activity was not significantly reduced after 7 reaction cycles, because the phosphotungstic acid radical ion incorporated into the interlayer region by electrostatic attraction and was constrained by the layer structure. Moreover, for the recycling of 20% HPW/aEVM catalyst, the leaching of tungsten species was only 1.94% after 7 reaction cycles, which demonstrated that the HPW was incorporated in the channel formed in the surface and interlayer of the aEVM.
12). Moreover, the W and P content in the fresh 20% HPW/aEVM catalyst were 11.74% and 0.17%, respectively. The catalytic activity was not significantly reduced after 7 reaction cycles, because the phosphotungstic acid radical ion incorporated into the interlayer region by electrostatic attraction and was constrained by the layer structure. Moreover, for the recycling of 20% HPW/aEVM catalyst, the leaching of tungsten species was only 1.94% after 7 reaction cycles, which demonstrated that the HPW was incorporated in the channel formed in the surface and interlayer of the aEVM.
| Run number | P (wt%)b | W (wt%)b | Molar ratio of P![[thin space (1/6-em)]](https://www.rsc.org/images/entities/char_2009.gif) : :![[thin space (1/6-em)]](https://www.rsc.org/images/entities/char_2009.gif) Wc Wc |
HPW (wt%)c |
|---|---|---|---|---|
| a Reaction conditions: reaction temperature 333 K, reaction time 2.5 h, O/S = 6, catalyst dosage = 0.04 g/10 ml.b As determined by ICP-AES experiments.c As calculated from the ICP-AES results, the atomic weight of P and W, and molecular weight of HPW. | ||||
| Fresh catalyst | 0.172 | 11.74 | 1![[thin space (1/6-em)]](https://www.rsc.org/images/entities/char_2009.gif) : :![[thin space (1/6-em)]](https://www.rsc.org/images/entities/char_2009.gif) 11.5 11.5 |
15.33 |
| 1 cycle | 0.164 | 11.38 | 1![[thin space (1/6-em)]](https://www.rsc.org/images/entities/char_2009.gif) : :![[thin space (1/6-em)]](https://www.rsc.org/images/entities/char_2009.gif) 11.7 11.7 |
14.86 |
| 2 cycle | 0.153 | 11.23 | 1![[thin space (1/6-em)]](https://www.rsc.org/images/entities/char_2009.gif) : :![[thin space (1/6-em)]](https://www.rsc.org/images/entities/char_2009.gif) 11.8 11.8 |
13.97 |
| 3 cycle | 0.150 | 10.55 | 1![[thin space (1/6-em)]](https://www.rsc.org/images/entities/char_2009.gif) : :![[thin space (1/6-em)]](https://www.rsc.org/images/entities/char_2009.gif) 11.6 11.6 |
13.78 |
| 4 cycle | 0.143 | 10.09 | 1![[thin space (1/6-em)]](https://www.rsc.org/images/entities/char_2009.gif) : :![[thin space (1/6-em)]](https://www.rsc.org/images/entities/char_2009.gif) 11.9 11.9 |
13.17 |
| 5 cycle | 0.140 | 9.76 | 1![[thin space (1/6-em)]](https://www.rsc.org/images/entities/char_2009.gif) : :![[thin space (1/6-em)]](https://www.rsc.org/images/entities/char_2009.gif) 12.1 12.1 |
12.75 |
| 6 cycle | 0.134 | 9.35 | 1![[thin space (1/6-em)]](https://www.rsc.org/images/entities/char_2009.gif) : :![[thin space (1/6-em)]](https://www.rsc.org/images/entities/char_2009.gif) 11.9 11.9 |
12.21 |
| 7 cycle | 0.129 | 8.54 | 1![[thin space (1/6-em)]](https://www.rsc.org/images/entities/char_2009.gif) : :![[thin space (1/6-em)]](https://www.rsc.org/images/entities/char_2009.gif) 11.1 11.1 |
11.15 |
| 8 cycle | 0.116 | 7.87 | 1![[thin space (1/6-em)]](https://www.rsc.org/images/entities/char_2009.gif) : :![[thin space (1/6-em)]](https://www.rsc.org/images/entities/char_2009.gif) 11.4 11.4 |
10.27 |
| 9 cycle | 0.112 | 7.52 | 1![[thin space (1/6-em)]](https://www.rsc.org/images/entities/char_2009.gif) : :![[thin space (1/6-em)]](https://www.rsc.org/images/entities/char_2009.gif) 11.3 11.3 |
9.82 |
The catalytic activity decreased with the leaching of active component. To investigate the leaching effect, we conducted a hot filtration experiment. When the reaction lasted for 10 min, the catalyst was filtered out to compare the desulphurization effect with the presence of the 20% HPW/aEVM catalyst. As shown in Fig. 10, the desulfurization rate slightly increased from 81.75% to 81.89% with reaction times from 10 to 60 min. However, the desulfurization rate was much lower than the existence of the 20% HPW/aEVM catalyst, which showed that the leaching content of the active component from the silica frameworks of the aEVM material was small in scope and consistent with the ICP-AES test.
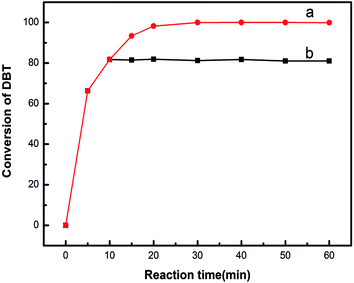 | ||
| Fig. 10 Hot filtration experiment of 20% HPW/aEVM catalyst. (a) 20% HPW/aEVM was hot filtrated at 10 minute, (b) with the presence 20% HPW/aEVM as catalyst. | ||
4. Conclusions
In conclusion, an inexpensive and highly efficient HPW/aEVM catalyst was successfully prepared and applied to the oxidation desulfurization process. Under the optimized conditions, the sulfur content efficiently decreased from 100 to 0.047 ppm within 0.5 h, which corresponded to nearly 100% sulfur removal rate. After 7 recycles, the catalytic activity of the 20% HPW/aEVM catalyst decreased by 1.89%, which indicated an inexpensive and promising catalyst for the deep desulfurization of model fuel.Acknowledgements
This work was supported by the Innovation Funds for Distinguished Young Scientists of Xinjiang Bingtuan (2011CD001), and the Foundation of Young Scientist in Shihezi University (No. 2013ZRKXJQ03).References
- M. A. Rezvani, A. F. Shojaie and M. H. Loghmani, Catal. Commun., 2012, 25, 36–40 CrossRef CAS.
- H. Gao, C. Guo, J. Xing, J. Zhao and H. Liu, Green Chem., 2010, 12, 1220–1224 RSC.
- D. Zhao, J. Wang and E. Zhou, Green Chem., 2007, 9, 1219–1222 RSC.
- P. S. Tam, J. R. Kittrell and J. W. Eldridge, Ind. Eng. Chem. Res., 1990, 29, 321–324 CrossRef CAS.
- I. V. Kozhevnikov, Chem. Rev., 1998, 98, 171–198 CrossRef CAS PubMed.
- Y. Shiraishi, H. Hara, T. Hirai and I. Komasawa, Ind. Eng. Chem. Res., 1999, 38, 1589–1595 CrossRef CAS.
- P. Yang, S. Zhou, Y. Du, J. Li and J. Lei, RSC Adv., 2016, 6, 53860–53866 RSC.
- L. Tang, G. Luo, M. Zhu, L. Kang and B. Dai, J. Ind. Eng. Chem., 2013, 19, 620–626 CrossRef CAS.
- P. M. Rao, A. Wolfson, S. Kababya, S. Vegac and M. V. Landau, J. Catal., 2005, 232, 210–225 CrossRef CAS.
- W. Jones, Catal. Today, 1988, 2, 357–367 CrossRef CAS.
- L. Chmielarz, P. Kuśtrowski, Z. Piwowarska, B. Dudek, B. Gil and M. Michalik, Appl. Catal., B, 2009, 88, 331–340 CrossRef CAS.
- L. Jin and B. Dai, Appl. Surf. Sci., 2012, 258, 3386–3392 CrossRef CAS.
- M. Motak, P. D. Costa and Ł. Kuterasiński, Catal. Today, 2011, 176, 154–158 CrossRef CAS.
- C. Marcos and I. Rodríguez, Appl. Clay Sci., 2014, 87, 219–227 CrossRef CAS.
- S. S. G. Santos, H. R. M. Silva, A. G. D. Souza, A. P. M. Alves, E. C. D. S. Filho and M. G. Fonseca, Appl. Clay Sci., 2015, 104, 286–294 CrossRef CAS.
- C. Maqueda, A. S. Romero, E. Morillo and J. L. Pérez-Rodríguez, J. Phys. Chem. Solids, 2007, 68, 1220–1224 CrossRef CAS.
- J. Temuujin, K. Okada and K. J. D. MacKenzie, Appl. Clay Sci., 2003, 22, 187–195 CrossRef CAS.
- J. Temuujin, K. Okada and K. J. D. MacKenzie, Appl. Clay Sci., 2003, 22, 187–195 CrossRef CAS.
- X. Zhang, G. Luo, M. Zhu, L. Kang, F. Yu and B. Dai, RSC Adv., 2015, 5, 76182–76189 RSC.
- B. Li, Z. Liu, C. Han, W. Ma and S. Zhao, J. Colloid Interface Sci., 2012, 377, 334–341 CrossRef CAS PubMed.
- R. Tian, O. Seitz, M. Li, W. Hu, Y. J. Chabal and J. Gao, Langmuir, 2010, 26, 4563–4566 CrossRef CAS PubMed.
- G. Luo, L. Kang, M. Zhu and B. Dai, Fuel Process. Technol., 2014, 118, 20–27 CrossRef CAS.
- D. Zhao, Y. Wang, E. Duan and J. Zhang, Fuel Process. Technol., 2010, 91, 1803–1806 CrossRef CAS.
- J. Qiu, G. Wang, D. Zeng, Y. Tang, M. Wang and Y. Li, Fuel Process. Technol., 2009, 90, 1538–1542 CrossRef CAS.
| This journal is © The Royal Society of Chemistry 2017 |

