 Open Access Article
Creative Commons Attribution 3.0 Unported Licence
The effect of cobalt promoter on the CO methanation reaction over MoS2 catalyst: a density functional study†
Chunyun Zhanga,
Bonan Liub,
Yuxian Wanga,
Liang Zhao *a,
Jin Zhangb,
Qiuyun Zong*b,
Jinsen Gaoa and
Chunming Xua
aState Key Laboratory of Heavy Oil Processing, China University of Petroleum (Beijing), 18 Fuxue Road, Beijing, 102249, China. E-mail: liangzhao@cup.edu.cn; Tel: +86-10-89739078
bQingdao LianXin Catalytic Materials Co. Ltd, Qingdao, 266300, China. E-mail: zqy1959@163.com; Tel: +86-532-82279823
First published on 17th February 2017
Abstract
The potential mechanism of sulfur-resistant CO methanation was theoretically investigated via density functional theory (DFT + D) calculations. Comparisons were made between modified Co–MoS2 and pure MoS2 catalysts and we highlighted the distinguished CO methanation pathway in the presence of Co-promoter. Multiple intermediates were formed at different catalytic sites during the reaction, which further increased the mechanism complexity. The results obtained from Co–MoS2 imply that the CH3OH species could be formed along the most feasible reaction pathway on Mo catalyst termination; the subsequent dissociation of CH3OH into CH3 and OH was found to be the rate determining step with a reaction barrier of 29.35 kcal mol−1 at 750 K. On the S edge of Co–MoS2, the CH2OH intermediate could be formed as a result of CH2O reacting with adsorbed hydrogen, and subsequent CH2OH dissociation was noted to release CH2. Afterwards, consecutive hydrogenation of CH2 led to the final CH4 yield. On S catalyst termination, it was suggested that the CHO intermediate formation played a key role as the rate-determining step with the reaction barrier of 19.56 kcal mol−1 at 750 K. By comparing the CO methanation energy profiles over different samples, it was discovered that the Co-promoter did possess promoting effects at both the Mo edge and the S edge of the catalyst; note that this enhancement at the Mo edge was superior to that at the S edge, especially for larger scale applications. Moreover, after doping with Co, the OH species was easier to remove in terms of H2O molecules, which created enough vacant active sites for a continuous reaction.
1. Introduction
As is well-known, natural gas is an important clean fuel that is environmentally friendly and convenient to transport. Its main component is CH4, which has high calorific value and is a comparably safe and efficient energy carrier. On the other hand, modern chemistry requires coal cleaning combustion and upgrade for sustainable development, especially in those coal rich countries such as China. As an effective method, methanation of carbon monoxide (CO + 3H2 → CH4 + H2O, Δ = −206.2 kJ mol−1), from syngas generated by coal (CO and H2 are major contents), to produce synthesized natural gas ‘SNG’ (CH4) has attracted significant attention, particularly for its low pollutant emissions.1–3Numerous metals, such as rhodium, ruthenium, cobalt and nickel, have been studied as catalysts for the industrial CO methanation process, and different kinds of metals are found to have different advantages. For example, rhodium and ruthenium have relatively higher activities, whereas nickel relies on a much lower cost.4–6 Nickel-based catalysts were once routinely used in industry, but they are very sensitive to sulfur compounds and thus there is a very rigorous restriction on upstream syngas sulfur containing levels;7,8 the relevant syngas desulfurization remarkably increases the production cost. Unlike conventional products, molybdenum-based catalysts have shown excellent CO methanation performance with desired sulfur-resistance, therefore enabling a so called ‘sulfur-resistant CO methanation reaction’.9–16 Rather than ‘poisoning the metal catalytic sites’, the introduction of sulfur plays a positive and essential role in Mo-based catalyst activation; the pre-sulfurized active sites (MoS2) are responsible for effective CO conversion.17 In further research attempts, a second metal was added to promote the stability and activity of MoS2 catalysts. Among various metal-promoters, Co exhibits a superior promoting effect on the activity of Mo/Al catalysts, which have been the most successful catalysts for sulfur-resistant CO methanation.18,19 Besides, cobalt also enhances the stability of Mo-based catalysts within CO methanation, especially under a water-containing atmosphere, where cobalt addition not only provides extra active sites, but also protects the active MoS2 phase.20
Numerous efforts have been made to study CO methanation mechanisms on different kinds of Ni-based catalysts;21–25 however, research on methanation mechanisms employing MoS2-based catalysts are uncommonly seen. Although a series of intermediates do exist during the reaction, which may increase the complexity of the mechanism study, methane has been proved to be the main product for CO methanation over MoS2 catalysts, as supported by both theoretical and experimental observations.26,27 Unlike the reaction on the pure Mo metal surface, adsorbed CO on the MoS2 surface is unlikely to dissociate into C and O atoms before hydrogenation.26 Shi et al. illustrated the optimal pathway for CO methanation over pure MoS2 catalysts, in which intermediate CH2OH was formed, and finally, CH4 was obtained by consecutive CH2 hydrogenation.28 DFT calculations have reported that doping K onto the MoS2 surface managed to enhance the CO adsorption efficiency by changing the local electronic environment, and reducing the barrier to C–C species formation; however the complete CO methanation route has still not been discussed.29 To the best of our knowledge, there has been no research focusing on the complete CO methanation mechanism on cobalt doped MoS2 catalysts. Therefore, an investigation on the degree of promotion of cobalt for the CO methanation reaction over molybdenum-based catalysts is urgently needed to gain profound insight into CO methanation mechanisms on Co–MoS2.
Our work addresses the study of the fundamental mechanism of Co–MoS2 promoted CO methanation (sulfur-resistant) by the DFT + D (dispersion force correction) method. We firstly investigated the adsorption performance of reactants, intermediates and products. Afterwards, all possible reaction pathways were designed and compared to identify the most favorable route of CO methanation at different surfaces of Co–MoS2. Energy profiles in optimal paths at 750 K were investigated on both edges of pure MoS2 and Co–MoS2 catalysts. Advances were also achieved by comparing the sulfur-resistant methanation performance over MoS2 catalysts and Co–MoS2 catalysts.
2. Computational details
Calculations based on density functional theory (DFT) were performed with the Dmol3 program in the Material Studio Package.30–32 The generalized gradient approach (GGA)33 and exchange–correlation potential developed by Perdew, Burke, and Ernzerhof (PBE),34 with the Grimme method35 for dispersion corrections (DFT-D correction) were adopted. Double numerical basis sets plus polarization functions (DNP) were used to represent atomic orbitals, and DFT semi-core pseudo-potentials (DSPPs) were employed for metal core treatment. The orbital cutoff was 4.9 Å and the Monkhorst–Pack mesh k-point f(2 × 2 × 1) was adopted. The SCF convergence criterion was 1.0 × 10⁻⁶ Ha per atom, and smearing was set as 2.0 × 10⁻³ Ha to accelerate the convergence of orbital occupation. Convergence tolerances of energy, maximum force, and maximum displacement were set as 1.0 × 10⁻⁵ Ha, 2.0 × 10⁻³ Ha Å−1, and 5.0 × 10⁻³ Å, respectively. Transition state (TS) searches were carried out at the same accuracy by complete linear synchronous transit (LST)/quadratic synchronous transit (QST) methods.36 The method starts by LST pathway connection of the reactant and product, after which the TS approximation was used to perform QST maximization. Afterwards, another conjugated gradient minimization was performed, based on the maximization point and the cycle repeats until the calculation was converged. Maximum iteration steps were 1000 and DIIS was used to accelerate the convergence of orbitals. Spin polarization was applied in the calculation process on account of the magnetic properties of Co. The transition states in this work have been proved by imaginary frequency.The MoS2 (10–10) surface was represented as four S–Mo–S slabs with the bottom two layers constrained to crystal lattice positions.37–44 The Mo edge and the S edge of pure MoS2 catalysts were reported to exist in realistic conditions, and both edges achieved stable equilibrium structures by sulfur reconstruction.45–49 Along with sulfur reconstruction, the S vacancies created active sites. Co–MoS2 was represented by 25% Co substitution of Mo on the surface.50 Herein, we define 100% sulfur coverage as corresponding to two sulfurs for each Mo atom on the surface. It is quite controversial to discuss which edge is more favorable for the location of Co-promoter; some studies revealed that the S edge was better,47,49 with 50% sulfur coverage, while some articles supported the Mo edge.51 Besides, many more models of Co–MoS2 catalysts with various Co content, including Mo edge and S edge, have been discussed.52–54 The Mo termination of 25% substituted Co–MoS2 with 25% sulfur coverage, and the S termination with 50% sulfur coverage were considered to be thermodynamically stable in industrial reactions,50,55 as shown in Fig. 1(a) and (b). Vacuum thickness of 15 Å was set in each model to avoid electronic coupling between adjacent slabs. For simplicity, the Mo termination of Co–MoS2, and the S termination of Co–MoS2 were recorded as T1 and T2, respectively. After geometry optimization based on the parameters mentioned above, surface Co was observed to relax inward by 0.467 Å on the Mo termination and 0.187 Å on the S termination, both of which were in good accordance with the values reported previously (0.46 Å and 0.17 Å, respectively).50
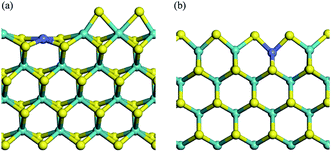 | ||
| Fig. 1 Crystal structures of T1 (a) and T2 (b) terminations. Mo/S/Co centers are shown as blue balls, yellow balls, and purple balls, respectively. | ||
The adsorption energy (Eads) was calculated from the energy difference between the adsorption state and free states, as shown in eqn (1). Herein, E(ads+slab) is the energy of the surface containing the adsorbate, E(slab) is the energy of the clean surface, and E(ads) is the energy of the adsorbing molecule in the gas state. Negative Eads value indicates an exothermic adsorption, and thus the most negative adsorption energy signifies the most stable adsorption configuration. The active energy barrier (Ea) is calculated according to eqn (2), and reaction energy (Esep) is calculated by eqn (3).
| Eads = E(ads+slab) − E(ads) − E(slab) | (1) |
| Ea = ETS − ER | (2) |
| Esep = EP − ER | (3) |
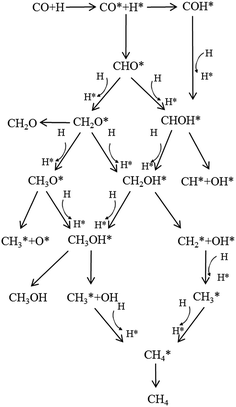
Herein, ETS means the energy of the transition state (TS) system, and ER, EP mean the energy of the reactant system and product system, respectively. Taking into account all possible pathways via different intermediates, we proposed a detailed CO methanation reaction network, which is schematically illustrated in Fig. 2. All the pathways shown in Fig. 2 were investigated in this study to find the optimal path for the CO methanation reaction over Co–MoS2 catalysts.
3. Results and discussions
3.1. Adsorption of reactants, intermediates and products
The adsorption performance of all species involved in the CO methanation on T1 and T2 terminations has been considered. Here, we focus on CO, H, CH2O, and CH3OH intermediates; the other intermediates like CHO, COH, CH3O, H2O and so on are summarized in the ESI.† Adsorption energies Eads and adsorption geometry parameters are listed in Table 1. Fig. 3 illustrates the adsorption configurations of intermediates involved in the most stable states on T1 and T2, where although many more adsorption sites and configurations have been considered, only two stable adsorption configurations with the largest Eads are described in this paper.| T1 | T2 | |||
|---|---|---|---|---|
| Eads | dC–O/Co–C/Co–O/Co–H/Mo–C/Mo–O/Mo–H | Eads | dC–O/Co–C/Co–O/Co–H/Mo–C/Mo–O/Mo–H | |
| CO (a) | −45.43 | 1.15/1.77/—/—/—/—/— | −24.91 | 1.16/1.78/—/—/—/—/— |
| CO (b) | −26.98 | 1.16/—/—/—/2.06/—/— | −24.67 | 1.16/—/—/—/2.05/—/— |
| H (a) | −55.58 | —/—/—/1.48/—/—/— | −59.27 | —/—/—/—/—/—/1.93, 1.81 |
| H (b) | −53.04 | —/—/—/—/—/—/1.71 | −52.35 | —/—/—/1.78/—/—/1.77 |
| CH2O (a) | −30.87 | 1.38/2.02/—/—/—/1.98/— | −12.62 | 1.34/—/—/—/2.21/2.03/— |
| CH2O (b) | −20.37 | 1.29/—/1.92/—/2.46/—/— | −11.47 | 1.23/—/—/—/—/2.39/— |
| CH3OH (a) | −27.99 | 1.46/—/2.04/—/—/—/— | −13.20 | 1.45/—/—/—/—/2.45/— |
| CH3OH (b) | −22.28 | 1.45/2.57/—/—/—/2.31/— | −12.15 | 1.46/—/2.22/—/—/2.58/— |
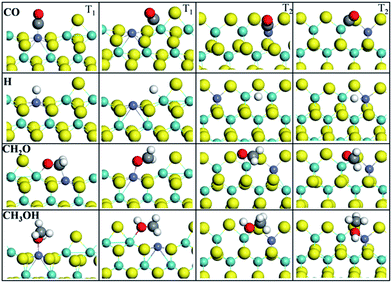 | ||
| Fig. 3 Adsorption configurations of CO, H, CH2O, and CH3OH in stable states on T1 and T2 terminations. | ||
H atoms on T1 termination preferred to adsorb on top of the bare Co site (−55.58 kcal mol−1, −53.50 kcal mol−1 (ref. 50)) and bare Mo site (−53.04 kcal mol−1, −50.50 kcal mol−1 (ref. 50)) than the S site (−44.51 kcal mol−1, −44.05 kcal mol−1 (ref. 50)), which revealed that the Co-promoter enhanced the adsorption performance of H atoms by creating new adsorption sites. Herein, adsorption energy values of the H adatom, obtained from literature,51 are listed as reference values, which were determined with VASP using the PAW method, PW91. On T2 termination, however, the interactions between H atoms and catalysts were relaxed by Co-promoter, since the H atom has stronger interactions with the bridge Mo–Mo site (−59.27 kcal mol−1, −57.65 kcal mol−1 (ref. 50)) than the bridge Co–Mo site (−52.35 kcal mol−1) or S site (−50.50 kcal mol−1). For O and OH groups, as described in ESI,† the Co site did not show conspicuous advantages over the Mo site on both terminations, which was due to the electronegativity of the O atom. CO was observed to be stabilized on the top of the bare Co site or Mo site with its carbon atom for both T1 and T2 terminations. For T1, the Co site (−45.43 kcal mol−1) was more active than the Mo site (−26.98 kcal mol−1). For T2, however, CO adsorbing at the Co site (−24.91 kcal mol−1) or Mo site (−24.67 kcal mol−1) resulted in similar adsorption energies. Structurally, the calculated Co–C distances were 1.77 Å for T1 termination and 1.78 Å for T2, and the obtained Mo–C distances were 2.06 Å for T1 and 2.05 Å for T2. Besides, in spite of distinct energy differences, the four adsorption structures have equal C–O distances, which were all activated into about 1.16 Å. CH2O on T1 was prone to adsorbing at the Co–Mo bridge site, while on T2 it was inclined to interact with the Mo site via the O atom. For CH3OH, it was found that except for the Co–Mo bridge site, which is a priority on both T1 and T2, the Co site on T1 and Mo site on T2 take precedence as well. It was concluded that most C1 intermediates prefer to adsorb at the Co site or adjoining Mo–Co site, as shown in ESI,† and it revealed that the Co-promoter provided more active sites by transforming the structure and altering the electronic distribution of MoS2, which made it easier for C1 species or H atoms to be adsorbed.
For a better understanding of the effect of cobalt-promoter on the electron distribution of MoS2, population analysis was calculated to study electron transfer. It was found that when compared with the Mo site, the Co atom obtained more electrons transferred from the carbon atom in the C1 species, which made the binding interaction between carbon and cobalt stronger. Taking the CO molecule as an example, in the adsorption configurations of CO, charge separations were found as follows: Mo−0.141–C0.309–O−0.118 on the Mo edge of MoS2, Co−0.469–C0.508–O−0.128 on the Mo edge of Co–MoS2, Mo−0.085–C0.325–O−0.162 on the S edge of MoS2, and Mo−0.468–C0.471–O−134 on the S edge of Co–MoS2. This explains why Co or Co–Mo active sites were more favorable than the Mo site for the adsorption of most C1 species and why carbon was inclined to interact with the cobalt atom, while the Mo site was more favorable than the Co site for oxygen atoms. Moreover, strong interactions between molecule and catalyst could weaken some bonds inside the adsorbate, which would decrease the difficulty of bond breaking in the adsorbate, or attack by other atoms.
3.2. Overview of the CO methanation pathway on Co–MoS2
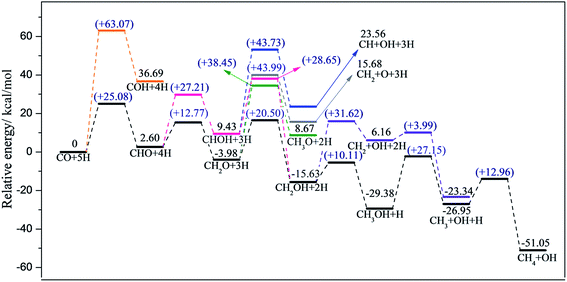
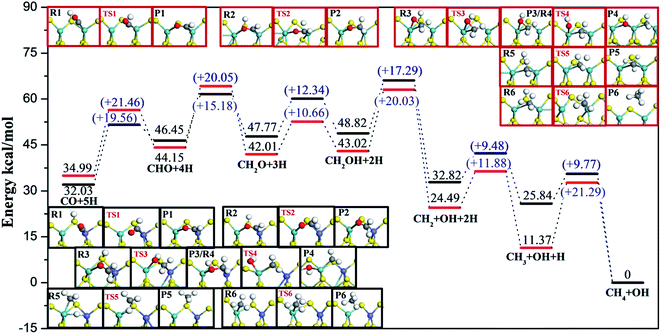
Calculated reaction barriers and reaction energies of all possible elementary steps for CO methanation on T1 and T2 termination are separately depicted in Fig. 4 and 5. Configurations of reactants, transition states, and products involved, with detailed information including bond lengths and angles are summarized in the ESI.†After the formation of CHO, CHOH (+27.21 kcal mol−1) and CH2O (+12.77 kcal mol−1) were then obtained by CHO reacting with adjacent hydrogen adatoms. In this step, the favorable product depended on which atom, oxygen or carbon in the CHO, was easier to attack by the independently co-adsorbed hydrogen. Apparently, CH2O was favored over the CHOH intermediate. Based on our calculations, neither the dissociation of CHOH into CH + OH (+43.73 kcal mol−1) nor the decomposition of CH2O into CH2 and O (+43.99 kcal mol−1) occur easily. Similarly, the formation of the CH3O intermediate through CH2O was not available on account of the high reaction barrier (+38.45 kcal mol−1). Interestingly, although CH2OH can be produced by either CHOH or CH2O reacting with adjacent hydrogen adatoms, the CH2O route (+20.50 kcal mol−1) was easier than the CHOH route (+28.65 kcal mol−1); therefore, the preceding step is the further hydrogenation of CHO to form CH2O, followed by CH2O hydrogenated into CH2OH.
With regard to the subsequent reaction of CH2OH, further hydrogenation of CH2OH into CH3OH was far more advantageous than the decomposition of CH2OH into CH2 and OH (Ea = 10.11 vs. 31.62 kcal mol−1). Moreover, the reaction barrier of CH3OH dissociation into CH3 and OH (+27.15 kcal mol−1) was likewise lower than CH2OH dissociation; therefore, CH3OH and CH3 are both favorable intermediates in the optimal pathway. Moreover, since the dissociation energy of CH3OH (+27.15 kcal mol−1) is close to the CH3OH desorption energy of 27.99 kcal mol−1, there is the possibility of the release of free CH3OH; this accounts for the fact that CH3OH is a side gas product, which agrees well with literature.56–58 Eventually, the final product, CH4, was attained by CH3 reacting with adsorbed hydrogen with the reaction barrier of 12.96 kcal mol−1.
Based on our calculations, the most feasible pathway for CO methanation on T1 termination is CO + 5H → CHO + 4H → CH2O + 3H → CH2OH + 2H → CH3OH + H → CH3 + OH + H → CH4 + OH, as illustrated in Fig. 4, in which the dissociation of CH3OH into CH3 and OH is the rate-determining step.
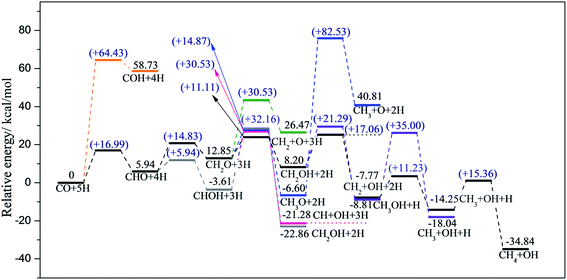
Regarding the next reaction of adsorbed CH2OH, two routes were possible, one of which generated CH3OH via the bonding of the carbon atom in CH2OH with the nearby adsorbed hydrogen, and the other one produced CH2 and OH. As can be seen from Fig. 5, both steps are kinetically favorable (Ea = 21.29 vs. 17.06 kcal mol−1). However, the dissociation of CH3OH into CH3 and OH was difficult, with the barrier of 35.00 kcal mol−1 being much higher than its desorption energy 13.20 kcal mol−1, which means that CH3OH was more likely to desorb rather than react further. Therefore, the next intermediate along the optimal path was CH2, while CH3OH was a favorable species in the final gas products. Subsequently, CH3 was obtained via CH2 interaction with a nearby H adatom (Ea = 11.23 kcal mol−1). Furthermore, the barrier of further conversion of CH3 into the final product CH4 was 15.36 kcal mol−1.
Based on the discussions above, the most favorable pathway for CO methanation on T2 termination was clear, which was CO + 5H → CHO + 4H → CH2O + 3H → CH2OH + 2H → CH2 + OH + H → CH3 + OH + H → CH4 + OH, and the dissociation of CH2OH into CH2 and OH groups was the rate-determining step at 0 K.
3.3. Comparison of the CO methanation mechanism of pure MoS2 and Co–MoS2
For simplicity, the Mo and S terminations of pure MoS2 catalysts were named T3 and T4, respectively. As reported earlier, the CO methanation reaction route over pure MoS2 catalyst (both T3 and T4) is CO + 5H → CHO + 4H → CH2O + 3H → CH2OH + 2H → CH2 + OH + H → CH3 + OH + H → CH4 + OH.28 Reaction barriers and energies of the CO methanation reaction on T3 and T4 terminations were recalculated by the DFT + D method with the computational accuracy as mentioned above in this paper. Recalculated reaction energies and previously announced energy values along the most favorable pathway on T3 and T4 terminations are summarized in Table 2, in which Esep and Ea are defined as reaction energies and reaction barriers, respectively. As can be seen, part of the calculated energies were a bit different from previously reported values,28 since we considered dispersion force correction and we consider more adsorption configurations based on literature.28 Configurations of reactants, transition states, and products on both T3 and T4 edges, with detailed information including bond lengths and angles are summarized in the ESI.†| Elementary steps | T3 | T4 | |||||||
|---|---|---|---|---|---|---|---|---|---|
| Esep | Ea | Esep | Ea | ||||||
| Calc. | Ref.a | Calc. | Ref.a | Calc. | Ref.a | Calc. | Ref.a | ||
| a Corresponds to ref. 28, where the calculations were performed with the DMol3 program, DNP, ECP, and PW91, with convergence tolerances of maximum displacement set as 5.0 × 10⁻³ Å. | |||||||||
| 1 | CO + H → CHO | 8.60 | 8.30 | 39.73 | 33.44 | 1.02 | 5.30 | 16.51 | 18.68 |
| 2 | CHO + H → CH2O | −4.61 | −11.07 | 18.06 | 18.22 | −1.49 | 1.38 | 17.56 | 28.37 |
| 3 | CH2O + H → CH2OH | −4.67 | −11.99 | 17.00 | 20.29 | −0.57 | −2.31 | 10.71 | 14.53 |
| 4 | CH2OH → CH2 + OH | −10.85 | −6.69 | 23.55 | 21.91 | −20.09 | −12.91 | 18.37 | 21.91 |
| 5 | CH2 + H → CH3 | −6.89 | −4.61 | 15.44 | 22.37 | −14.79 | −13.14 | 9.07 | 18.22 |
| 6 | CH3 + H → CH4 | −26.21 | −29.06 | 3.35 | 12.22 | −15.39 | −22.60 | 20.56 | 25.14 |
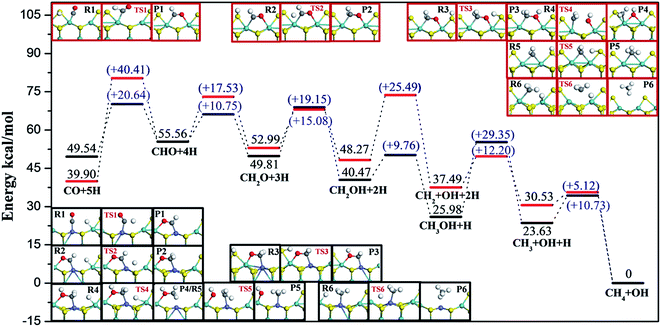
Considering realistic temperature conditions for industrial CO methanation, free energy changes of all reactants, intermediates, and products at 750 K were calculated, and energy profiles along the optimal paths on four edges at 750 K were calculated and are depicted in Fig. 6 and 7. Fig. 6 summarizes the most feasible CO methanation reaction routines on T1 and T3, and Fig. 7 depicts the most favorable pathways on T2 and T4 terminations; in both figures, all the configurations of reactants, transition states and products involved in the optimal pathways are given. The configurations of species involved in other feasible routes on T1 and T2 terminations are given in the ESI.† As seen in Fig. 6, except for the last two steps, it was found that the reaction barriers on T1 termination were smaller than on T3 termination, in general. The rate determining step on T3 was the only endothermic elementary step, CO + H → CHO, the reaction barrier of which was up to 40.41 kcal mol−1. However, after doping Co-promoter into MoS2, the reaction barrier of CO hydrogenation into CHO was decreased to 20.64 kcal mol−1. For T1 termination, as mentioned above, CH3OH was a favorable intermediate with low formation barrier and cleavage of the C–O bond of CH3OH was the rate determining step for CO methanation on T1 termination with the reaction barrier of 29.35 kcal mol−1. Obviously, the Co-promoter lowered the reaction barrier by about 11 kcal mol−1 and thus, accelerated the reaction kinetically on Mo termination.
For S termination (Fig. 7), it was found that the reaction barriers on T2 termination were obviously smaller than the reaction barriers on T4 terminations, except for the third step. The formation of CHO (Ea = 19.56 kcal mol−1) was the rate determining step for T2, while for T4, not only the formation of CHO (Ea = 21.46 kcal mol−1), but also the formation of CH2O (Ea = 20.05 kcal mol−1), the dissociation of CH2OH (Ea = 20.03 kcal mol−1) and the formation of CH4 (Ea = 21.29 kcal mol−1) had higher reaction barriers. It can be likewise deduced that the CO methanation reaction occurred with kinetically less effort on T2 than on T4 termination, and Co lowered the reaction barriers of the rate-determining step by 2 kcal mol−1 on S termination.
On the basis of comparison, the Co-promoter plays a promoting role in the CO methanation reaction both on S and Mo terminations to different degrees, which is in good agreement with experimental studies.59–63 Except for the last step, CH3 + H → CH4, which occurred more easily on T3 termination than on T4 termination, S termination showed the superiority of the other CO methanation steps to Mo termination over pure MoS2 catalysts. However, from Fig. 6 and 7, it is apparent that S termination did not precede Mo termination over Co–MoS2 catalysts as significantly as over unsupported MoS2 catalysts for the CO methanation reaction, since the overall reaction barriers on S termination were closer to the Mo edge after doping Co-promoter.
3.4. Formation of H2O
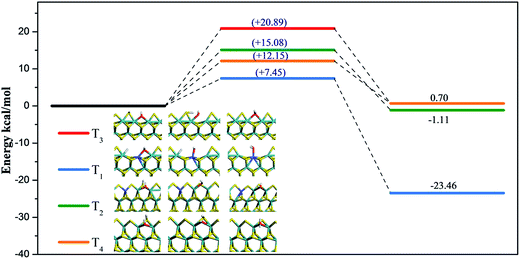
Formation of H2O via OH reacting with a H adatom on four terminations was calculated and energy profiles are depicted in Fig. 8. On T1, T2, T3, and T4 terminations, formation barriers were 7.45 kcal mol−1, 15.08 kcal mol−1, 20.89 kcal mol−1, and 12.15 kcal mol−1, respectively. Based on adsorption energies, which were described in ESI† in the adsorption performance section, desorption barriers of H2O on T1 were 25.50 kcal mol−1, 12.57 kcal mol−1 for T2 termination, 21.68 kcal mol−1 for T3 termination, and 14.30 kcal mol−1 for T4 termination. Compared to the reaction of C1 species discussed above, the OH species was not difficult to remove because of relatively low reaction barriers. Moreover, the OH species was found to be more easily removed as H2O on S terminations for both MoS2 and for Co–MoS2 catalysts, and Co-promoter also facilitated the removal of OH species to guarantee enough vacant active sites for C1 hydrogenation on both S termination and Mo termination.4. BEP relationship
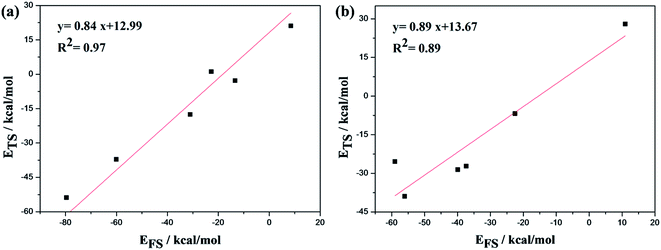
The Brønsted–Evans–Polanyi (BEP) linear relationship64 between ETS (transition state energy) and EFS (product state energy) of the dissociation of CHO (C–H), CH2O (C–H), CH2OH (O–H), CH3OH (C–O), CH4 (C–H) on the Mo edge and the dissociation of CHO (C–H), CH2O (C–H), CH2OH (O–H), CH3 (C–H), CH4 (C–H) on the S edge of the Co–MoS2 catalyst was investigated, in which dissociation reactions were seen as being in the reverse direction of corresponding formation reactions. The configurations of all reactants, transition states, and products for the above reaction steps can be seen in Fig. 6 and 7, respectively. ETS is calculated from eqn (4), and EFS is calculated from eqn (5), in which E(TS/slab) means the total energy of the transition state with the catalyst slab, E(FS/slab) is the total energy of adsorbed product with catalyst slab, E(slab) is the energy of the clean surface, and E(gas) is the energy of the reactant molecule in the free state.| ETS = E(TS/slab) − E(gas) − E(slab) | (4) |
| EFS = E(FS/slab) − E(gas) − E(slab) | (5) |
Fig. 9(a) represents the Mo edge of the Co–MoS2 catalyst, and Fig. 9(b) is the S edge of Co–MoS2. As seen, the slopes for ETS as a function of EFS are 0.84 for the Mo edge and 0.89 for the S edge, within the range (0 < slope <1) expected. Both slope values were close to 1, indicating the similarity between the configurations of transition states and the corresponding final states, which agreed well with our calculation results, as can be seen in Fig. 6 and 7.
5. Conclusion
The DFT + D method was applied to investigate the CO methanation mechanism on Co–MoS2 catalysts and to determine the effect of Co. Adsorption calculations indicated that after Co doping, more active sites were created and the Co site and adjoining Mo–Co site were preferable for the adsorption of most C1 intermediates involved. After doping Co-promoter, the reaction mechanism on Mo termination was changed, along which the CH3OH intermediate was formed by CH2OH hydrogenation, and it showed that CH3OH was one kind of side gas product, which accounted for some experimental results in which CH3OH was detected as a gas product of CO methanation.56,57 However, the most favorable route on S termination of Co–MoS2 catalysts stayed the same as that on pure MoS2; the CH2OH species was formed in both and then dissociated into CH2 and OH. The dissociation of CH3OH was found to be the rate determining step for Mo termination of Co–MoS2 catalysts at 750 K, and the formation of CHO was the rate-determining step for S termination at 750 K. Furthermore, for pure MoS2 catalysts, the CO methanation reaction was favored on S termination instead of Mo termination, while after Co-promoter doping, the priority difference between Mo termination and S termination for CO methanation was reduced. Moreover, the reaction enhancement of Co-promoter was more significant on Mo termination than on S termination, since the overall reaction barrier was lowered by 11 kcal mol−1 for the Mo edge, and by only 2 kcal mol−1 on the S edge. OH species were found to be removed more easily as H2O after Co-promoter doping on both the Mo edge and S edge, and the timely removal of OH ensured that active sites were vacant for the adsorption and further reaction of C1 species to produce methane. In addition, the data obtained in this paper were found to agree well with the BEP relationship.Acknowledgements
The work was supported by the National Natural Science Foundation of China (21336011, 21476260, 21236009, and U1162204) and Science Foundation of China University of Petroleum, Beijing (2462015YQ0311).References
- H. Liu, S. Yang, J. Hu, F. Shang, Z. Li, C. Xu, J. Guan and Q. Kan, Fuel Process. Technol., 2012, 96, 195–202 CrossRef CAS.
- D. Hu, J. Gao, Y. Ping, L. Jia, P. Gunawan, Z. Zhong, G. Xu, F. Gu and F. Su, Ind. Eng. Chem. Res., 2012, 51, 4875–4886 CrossRef CAS.
- J. Kopyscinski, T. J. Schildhauer and S. M. A. Biollaz, Fuel, 2010, 89, 1763–1783 CrossRef CAS.
- J. K. Nørskov, F. Abild-Pedersen, F. Studt and T. Bligaard, Proc. Natl. Acad. Sci. U. S. A., 2011, 108, 937–943 CrossRef PubMed.
- A. C. Lausche, A. J. Medford, T. S. Khan, Y. Xu, T. Bligaard, F. Abild-Pedersen, J. K. Nørskov and F. Studt, J. Catal., 2013, 307, 275–282 CrossRef CAS.
- J. Yang, Y. Qi, J. Zhu, Y. Zhu, D. Chen and A. Holmen, J. Catal., 2013, 308, 37–49 CrossRef CAS.
- J. Oudar, Catal. Rev.: Sci. Eng., 1980, 22, 171–195 CAS.
- E. J. Erekson and C. H. Bartholomrw, Appl. Catal., 1983, 5, 323–336 CrossRef CAS.
- A. J. Frank, H. A. Dick, J. Goral, A. J. Nelson and M. Grätzel, J. Catal., 1990, 126, 674–676 CrossRef CAS.
- P. H. Nielsen, K. Pedersen and J. R. Rostrup-Nielsen, Top. Catal., 1995, 2, 207–221 CrossRef.
- B. Wang, G. Ding, Y. Shang, J. Lv, H. Wang, E. Wang, Z. Li, X. Ma, S. Qin and Q. Sun, Appl. Catal., A, 2012, 431, 144–150 CrossRef.
- S. Zaman and K. J. Smith, Catal. Rev., 2012, 54, 41–132 CAS.
- J. M. Christensen, P. M. Mortensen, R. Trane, P. A. Jensen and A. D. Jensen, Appl. Catal., A, 2009, 366, 29–43 CrossRef CAS.
- Z. Li, Y. Fu, M. Jiang, T. Hu, T. Liu and Y. Xie, J. Catal., 2001, 199, 155–161 CrossRef CAS.
- M. Y. Kim, S. B. Ha, D. J. Koh, C. Byun and E. D. Park, Catal. Commun., 2013, 35, 68–71 CrossRef CAS.
- Z. Li, K. Zhang, W. Wang, J. Qu, Y. Tian, B. Wang and X. Ma, J. Taiwan Inst. Chem. Eng., 2016, 68, 239–245 CrossRef CAS.
- J. Liu, E. Wang, J. Lv, Z. Li, B. Wang, X. Ma, S. Qin and Q. Sun, Fuel Process. Technol., 2013, 110, 249–257 CrossRef CAS.
- C. Lin, H. Wang, Z. Li, B. Wang, X. Ma, S. Qin and Q. Sun, Front. Chem. Sci. Eng., 2013, 7, 88–94 CrossRef CAS.
- B. Wang, Y. Yao, M. Jiang, Z. Li, X. Ma, S. Qin and Q. Sun, J. Energy Chem., 2014, 23, 35–42 CrossRef CAS.
- H. Wang, C. Lin, Z. Li, B. Wang and X. Ma, Bull. Korean Chem. Soc., 2015, 36, 74–82 CrossRef CAS.
- Y. Wang, Y. Su, M. Zhu and L. Kang, Int. J. Hydrogen Energy, 2015, 40, 8864–8876 CrossRef CAS.
- T. L. Wind, H. Falsig, J. Sehested, P. G. Moses and T. Nguyen, J. Catal., 2016, 342, 105–116 CrossRef CAS.
- X. Han, J. Yang, B. Han, W. Sun, C. Zhao, Y. Lu, Z. Li and J. Ren, Int. J. Hydrogen Energy, 2016, 1–16 Search PubMed.
- J. Sehested, S. Dahl, J. Jacobsen and J. R. Rostrup-Nielsen, J. Phys. Chem. B, 2005, 109, 2432–2438 CrossRef CAS PubMed.
- S. Fujita, H. Terunuma, M. Nakamura and N. Takezawa, Ind. Eng. Chem. Res., 1991, 30, 1146–1151 CrossRef CAS.
- M. Huang and K. Cho, J. Phys. Chem. C, 2009, 113, 5238–5243 CAS.
- N. Koizumi, G. Bian, K. Murai, T. Ozaki and M. Yamada, J. Mol. Catal. A: Chem., 2004, 207, 173–182 CrossRef CAS.
- X. Shi, H. Jiao, K. Hermann and J. Wang, J. Mol. Catal. A: Chem., 2009, 312, 7–17 CrossRef CAS.
- A. Andersen, S. M. Kathmann, M. A. Lilga, K. O. Albrecht, R. T. Hallen and D. Mei, Catal. Commun., 2014, 52, 92–97 CrossRef CAS.
- B. Delley, J. Chem. Phys., 1990, 92, 508 CrossRef CAS.
- B. Delley, J. Chem. Phys., 2000, 113, 7756–7764 CrossRef CAS.
- B. Delley, J. Phys. Chem., 1996, 100, 6107–6110 CrossRef CAS.
- S. Kurth, J. P. Perdew and P. Blaha, Int. J. Quantum Chem., 1999, 75, 889–909 CrossRef CAS.
- J. P. Perdew, K. Burke and M. Ernzerhof, Phys. Rev. Lett., 1996, 77, 3865–3868 CrossRef CAS PubMed.
- S. Grimme, J. Comput. Chem., 2006, 27, 1787–1799 CrossRef CAS PubMed.
- T. A. Halgren and W. N. Lipscomb, Chem. Phys. Lett., 1977, 49, 225–232 CrossRef CAS.
- M. Sun, A. E. Nelson and J. Adjaye, Catal. Today, 2005, 105, 36–43 CrossRef CAS.
- S. Cristol, J. F. Paul, E. Payen, D. Bougeard, S. Clémendot and F. Hutschka, J. Phys. Chem. B, 2000, 104, 11220–11229 CrossRef CAS.
- S. Cristol, J. F. Paul, E. Payen, D. Bougeard, S. Clémendot and F. Hutschka, J. Phys. Chem. B, 2002, 106, 5659–5667 CrossRef CAS.
- P. Raybaud, J. Hafner, G. Kresse, S. Kasztelan and H. Toulhoat, J. Catal., 2000, 189, 129–146 CrossRef CAS.
- A. Travert, C. Dujardin, F. Maugé, S. Cristol, J. F. Paul, E. Payen and D. Bougeard, Catal. Today, 2001, 70, 255–269 CrossRef CAS.
- M. Sun, J. Adjaye and A. E. Nelson, Appl. Catal., A, 2004, 263, 131–143 CrossRef CAS.
- M. Sun, A. E. Nelson and J. Adjaye, J. Catal., 2004, 226, 41–53 CrossRef CAS.
- G. Bian, Y. Fu and M. Yamada, Appl. Catal., A, 1996, 144, 79–91 CrossRef CAS.
- J. V. Lauritsen, E. Lægsgaard, I. Stensgaard, J. K. Nørskov, B. S. Clausen, H. Topsøe, F. Besenbacher and S. Helveg, Phys. Rev. Lett., 2000, 84, 951–954 CrossRef PubMed.
- J. V. Lauritsen, M. V. Bollinger, E. Lægsgaard, K. W. Jacobsen, J. K. Nørskov, B. S. Clausen, H. Topsøe and F. Besenbacher, J. Catal., 2004, 221, 510–522 CrossRef CAS.
- J. V. Lauritsen, J. Kibsgaard, G. H. Olesen, P. G. Moses, B. Hinnemann, S. Helveg, J. K. Nørskov, B. S. Clausen, H. Topsøe, E. Lægsgaard and F. Besenbacher, J. Catal., 2007, 249, 220–233 CrossRef CAS.
- H. Schweiger, P. Raybaud, G. Kresse and H. Toulhoat, J. Catal., 2002, 207, 76–87 CrossRef CAS.
- M. Sun, A. E. Nelson and J. Adjaye, J. Catal., 2004, 226, 32–40 CrossRef CAS.
- Y. Chen, M. Dong, J. Wang and H. Jiao, J. Phys. Chem. C, 2010, 114, 16669–16676 CAS.
- P. Raybaud, J. Hafner, G. Kresse, S. Kasztelan and H. Toulhoat, J. Catal., 2000, 190, 128–143 CrossRef CAS.
- E. Krebs, B. Silvi and P. Raybaud, Catal. Today, 2008, 130, 160–169 CrossRef CAS.
- L. S. Byskov, B. Hammer, J. K. Nørskov, B. S. Clausen and H. Topsøe, Catal. Lett., 1997, 47, 177–182 CrossRef CAS.
- L. S. Byskov, J. K. Nørskov, B. S. Clausen and H. Topsøe, Catal. Lett., 2000, 64, 95–99 CrossRef CAS.
- X. Shi, S. Wang, J. Hu, H. Wang, Y. Chen, Z. Qin and J. Wang, Appl. Catal., A, 2009, 365, 62–70 CrossRef CAS.
- Y. Li, R. Wang and L. Chang, Catal. Today, 1999, 51, 25–38 CrossRef CAS.
- M. Rothaemel, H. W. Zanthoff and M. Baerns, Catal. Lett., 1994, 28, 321–328 CrossRef CAS.
- R. M. Kiai, A. Tavasoli and A. Karimi, React. Kinet., Mech. Catal., 2016, 117, 173–188 CrossRef CAS.
- C. R. F. Lund, Ind. Eng. Chem. Res., 1996, 35, 3067–3073 CrossRef CAS.
- Y. Lian, H. Wang, W. Fang and Y. Yang, J. Nat. Gas Chem., 2010, 19, 61–66 CrossRef CAS.
- Y. Lian, H. Wang, Q. Zheng, W. Fang and Y. Yang, J. Nat. Gas Chem., 2009, 18, 161–166 CrossRef CAS.
- A. R. de la Osa, A. De Lucas, A. Romero, P. Casero, J. L. Valverde and P. Sánchez, Fuel, 2012, 97, 428–434 CrossRef CAS.
- A. R. de la Osa, A. De Lucas, A. Romero, J. L. Valverde and P. Sánchez, Int. J. Hydrogen Energy, 2011, 36, 9673–9684 CrossRef CAS.
- R. A. V. Santen, M. Neurock and S. G. Shetty, Chem. Rev., 2010, 110, 2005–2048 CrossRef PubMed.
Footnote |
| † Electronic supplementary information (ESI) available. See DOI: 10.1039/c6ra27422f |
| This journal is © The Royal Society of Chemistry 2017 |

