 Open Access Article
Creative Commons Attribution 3.0 Unported Licence
Al-Based porous coordination polymer derived nanoporous carbon for immobilization of glucose oxidase and its application in glucose/O2 biofuel cell and biosensor†
Zepeng Kanga,
Kailong Jiaoa,
Ruiyun Pengb,
Zongqian Hu*b and
Shuqiang Jiao *a
*a
aState Key Laboratory of Advanced Metallurgy, University of Science and Technology Beijing, Beijing, 100083, P. R. China. E-mail: sjiao@ustb.edu.cn; Fax: +86-10-62334204; Tel: +86-10-62334204
bBeijing Institute of Radiation Medicine, Beijing, 100850, P. R. China. E-mail: huzongqian@hotmail.com; Tel: +86-10-66930272
First published on 17th February 2017
Abstract
Herein, we report the first example of using the Al-based porous coordination polymers (Al-PCP) as a template for preparation of nanoporous carbon through a two-step carbonized method. By applying the appropriate carbonized temperature in the first-step carbonization process, both high surface area and large pore volume are realized in the second-step carbonization process even at a high-temperature. The SEM images show that the carbonized Al-PCP before and after HF treatment (PCP) retained mostly crystallite shapes and sponge-like surface morphology. The TEM images of carbonized Al-PCP and PCP clearly exhibited high porosity with a wide range of pore sizes spanning from micro- to macropores. The maximum BET surface area and pore volume were 2773.5 m2 g−1 and 1.885 cm3 g−1, respectively. The obtained highly nanoporous carbon PCPs were used to modify a glassy carbon electrode (GCE) based on glucose oxidase (GOx), resulting in efficient direct electron transfer and excellent bio-catalytic performance. In addition, a glucose/O2 fuel cell constructed using Nafion/GOx/PCP/GCE as the anode and an E-TEK Pt/C modified GCE as the cathode generated a maximum power density of 0.548 mW cm−2 at 0.41 V. The findings in this work may be helpful for exploiting novel nanoporous carbons derived from metal–organic framework (MOF) by using a two-step carbonization method for the immobilization of enzymes in enzymatic biofuel cells or biosensors.
1. Introduction
Enzymatic biofuel cells (EBFCs) are considered promising, environmentally friendly and green energy devices, which are capable of harvesting electrical energy from renewable and abundantly available biofuels by using redox enzymes as the catalysts for oxidation of biofuels and reduction of oxidizers.1–4 However, efficient electron transfer between the active sites of enzymes and the current collector or the electrode is not efficient, mostly because the active sites of enzymes are embedded in the electrical insulation of protein shells.2,5 Therefore, it is necessary and desirable to establish an effective bioelectrocatalytic system for oxidation of biofuels for biofuel cells.6 Glucose oxidase (GOx) is one of the most commonly considered enzymes for bioanode in biofuels cells, because it can oxidize glucose directly to glucolactone in a two-electron transfer step.7–10 Judicious choice of the biocompatible materials for immobilization of GOx is the key step to construct a bioanode.3,11,12 Therefore, exploring new electrode materials for the immobilization of GOx is highly desirable for biofuel cell construction.Over the past few years, nanomaterials with high electrical conductivity, large specific surface area and high porosity have been introduced as supporting materials for immobilizing the GOx molecules.13–16 Among the various nanomaterials, carbon nanotubes (CNTs) and graphene (Gr) have been attracted enormous attentions for immobilization of GOx owing to their excellent physicochemical properties.2,4,9,17 Hence, extensive efforts have been put forward to achieve synergistic integration of three-dimensional (3D) CNTs network or Gr with other nanomaterials as supporting materials for enzyme immobilization.2,4,14,18–20 While these nanomaterials produce successful biofuel cell electrodes, there is still the possibility to develop electrode architectures with a more reliable attachment scheme and greater enzyme density using more convenient materials.
Recently, metal–organic frameworks (MOFs) or porous coordination polymers (PCPs), as typical inorganic–organic hybrids, have been used as templates/precursors to prepare porous carbons through thermal conversion.21–23 MOFs-templated carbons have attracted great attention because of their exceptionally high surface areas and the ability to control their pore textures.24 The MOFs-derived nanoporous carbons (NPCs) are promising for a variety of applications, such as contamination removal,25 gas/liquid storage,22,24 supercapacitors21,26 and fuel cell systems. In the EBFCs fields, the NPCs materials for immobilization of enzymes are mostly prepared by template methods using mesoporous silica or zeolites as templates.27–29 Compared with the traditional porous materials, MOFs are unique in terms of their extraordinarily high porosity, tunable pores, and diverse functional sites.30,31 However, the MOFs-derived NPCs have barely been reported for the application in EBFCs.
In this paper, we selected a typical Al-based porous coordination polymer (Al-PCP) as a precursor to synthesize the NPCs by a two-step carbonized method. The Al-PCP powders were first carbonized at 800 °C, and the obtained product Al-PCP800 (800 is the carbonized temperature) was washed extensively with an HF solution to remove the residual Al component. Then the PCP800 was calcined again at various temperatures from 1000 to 1600 °C under an insert gas. The obtained samples were denoted as “PCPx”, where the x is applied calcination temperature of the second-step carbonized process. Then the electrochemical performance of the PCPx as a novel substrate for immobilization of GOx were studied.
2. Materials and methods
2.1. Materials
Glucose oxidase (GOx, EC 1.1.3.4, from Aspergillus niger, 200 U mg−1) and Nafion solution (5 wt%) were purchased from Sigma-Aldrich and used as received. 1,4-NDC were purchased from Alfa-Aesar and pretreated as received. E-TEK Pt/C (20 wt%) catalyst was purchased from De Nora Elettrodi. Glucose, ascorbic acid (AA), uric acid (UA) and other conventional reagents were obtained from Sinopharm Chemical Reagent Co., Ltd. (China). All reagents were of analytical grade and used without further purification. Phosphate buffer solutions (PBS, 0.1 M, pH = 7.2) were prepared with 0.1 M NaH2PO4 and 0.1 M Na2HPO4. Different stock solution concentrations of glucose were prepared by 0.1 M PBS (pH 7.2) and mutarotated at least 24 h before use. All solutions were prepared with deionized water which was purified with a Millipore-Q purification system to a specific resistance over 18.0 MQ cm.2.2. Synthesis of nanoporous carbon
Al-PCP powers were prepared according to the previous report.31 Two-step carbonization method was carried out by means of gradual heating (heating rate is 2 °C min−1) up to the target temperature in argon atmosphere and maintained for 4 h. The applied carbonization temperature in first-step was 800 °C and referenced to the works of Hu et al.23 After calcination, the obtained black powder Al-PCP800 was immersed in 20% HF under magnetic stirring for 48 h to remove the residual Al component. Then the turbid liquid was centrifuged and the precipitate was washed extensively with deionized water, then the black powder PCP800 was dried under vacuum condition for 8 h at 60 °C. After that, the obtained black powder PCP800 was calcined again with applied calcination temperatures varying at 1000, 1200, 1400 and 1600 °C, respectively.2.3. Fabrication of GOx modified electrode based on PCPx
For preparing a GOx electrode, a glassy carbon electrode (GCE) was sequentially polished by using slurry of 0.5 μm and 0.03 μm alumina power and successively washed by ultrasonication in deionized water, 1 M HNO3, deionized water and ethanol for 3 minutes, respectively. Then the electrode was activated electrochemically in 0.1 M sulfuric acid by cyclic voltammetry (CV) until the CV curve to invariant.32 Thereafter, the electrode was abundantly washed with deionized water and dried under argon flow, then 5 μL of the PCPx suspension (5 mg mL−1, prepared by deionized water) was dropped on the GCE surface by using a microinjector, and then the electrode was dried in air. The obtained electrode was denoted as PCPx/GCE. After that, 2 μL of GOx solution (20 mg mL−1, prepared by PBS, pH 4) was spread onto the surface of PCPx/GCE electrode and then put them in a refrigerator (4 °C) for 6 h. The obtained electrode was denoted as GOx/PCPx/GCE. Finally, 5 μL of Nafion solution (1 v/v%, prepared by ethyl alcohol, 99.99%) was spread on surface of GOx/PCPx/GCE. Then put them in a refrigerator (4 °C) for 2 h. The final electrode was denoted as Nafion/GOx/PCPx/GCE. For comparison, Nafion/GC, Nafion/GOx/GC, and Nafion/PCPx/GC electrodes were prepared. All prepared enzyme electrodes were stored in PBS at 4 °C when not in use.2.4. Apparatus and measurements
All electrochemical experiments were carried out by a CHI 660C electrochemical workstation (CHI Instrument, Shanghai, China) using a conventional three-electrode consisting of a modified glassy carbon as working electrode (3 mm in diameter), a Pt sheet with surface area of 1 cm2 as counter electrode and an Ag/AgCl (3 M KCl) electrode as reference electrode. The electrochemical measurements were carried out in 0.1 M sodium phosphate buffer solution (PBS, pH 7.2) as the supporting electrolyte, which were purged with high-purity argon for at least 30 min prior to experiments and a argon environment was then kept over the solution in the cell. All experiments were performed at ambient temperature. Spectrum 100 FT-IR from Perkin Elmer was used for the Fourier Transform Infrared Spectroscopy (FT-IR) studies. XRD studies were performed on a PANalytical X'pert Pro X-ray diffractometer. Raman was measured by a WITec CRM200 using 532 nm laser. Scanning electron microscopy (SEM) analysis was carried out using a JSM-6701 field emission scanning electron microscopy (JEOL, Japan) at an accelerating voltage of 10 kV with a Phoenix energy dispersive X-ray analyzer (NS7, Thermo, USA). Transmission electron microscopy (TEM) images were recorded on a JEOL JEM-2100 microscope operated at an acceleration voltage of 200 kV.2.5. Electrochemical performance of the BFC
Power density measurements were referenced to previous report.19 To assemble a glucose/O2 BFC, the PCP-x nanoporous materials modified GC electrode immersed in 0.1 M PBS (pH = 7.2) containing 0.1 M glucose was used as the bioanode and an E-TEK Pt/C modified GC electrode immersed in 0.2 M Britton–Robinson (B–R) buffer (pH = 5) with continuously bumping oxygen was used as the cathode. The E-TEK Pt/C electrode was prepared by casting 10 μL of 10 mg mL−1 commercial E-TEK Pt/C (20 wt%) on the well-polished GC electrode. Nafion 117 film was used as a separator (membrane) between two electrodes. Linear sweep voltammetry (LSV) was used to evaluate the performance of BFC.3. Results and discussion
3.1. Morphology and structure
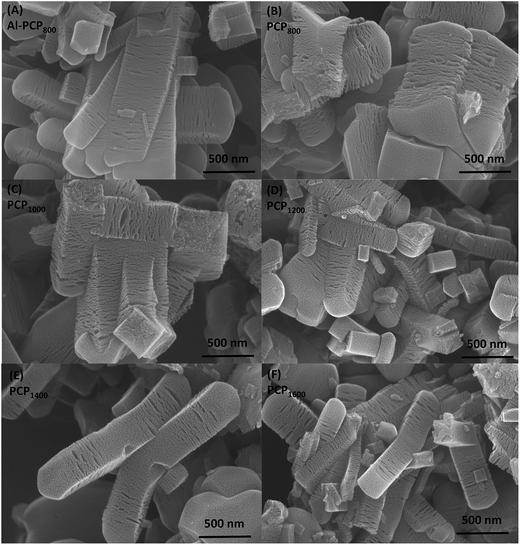
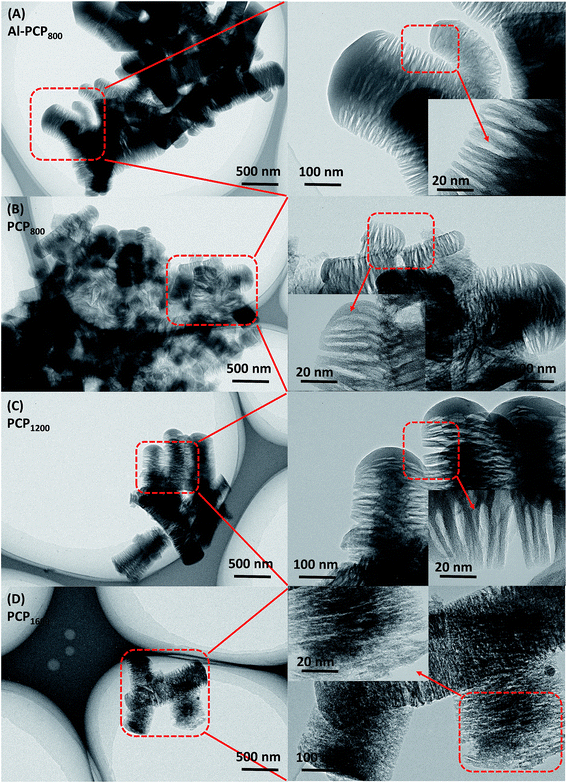
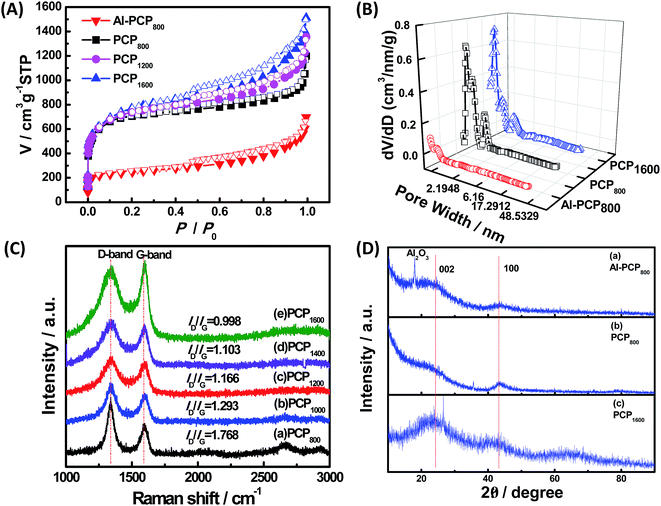
Fig. 1 shows the SEM images of carbonized Al-PCP800 and PCPx. As shown in Fig. 1(A), Al-PCP800 clearly exhibited mostly crystallite shapes and sponge-like surface morphology with numerous of large cracks/voids. It is noted that PCPx (Fig. 1(B–F)) retained the same morphology features but with more and larger cracks/voids, indicating that Al component was successfully removed by HF treatment. The more and larger cracks/voids were formed by the gas evolution (mostly CO2, CO, C6H6 and a small amount of H2 and CxHy hydrocarbon mixtures) during the pyrolysis at a high temperature.24,33 TEM images of Al-PCP800 and PCPx are shown in the Fig. 2 and S1.† As shown in Fig. 2(A), the Al-PCP800 exhibited homogeneous rod-like shape accompanied numerous flocculent structures at margin. The enlargement images further displayed high porosity with a wide range of pore sizes spanning from micro- to macrospores. The corresponding high resolution images showed in Fig. S2(A)† exhibited highly defective, randomly oriented graphitic type porous carbon. After HF treatment, PCP800 (Fig. 2(B)) retained macroscopic morphology of Al-PCP800 but with more cracks. After the second calcination, PCPx (Fig. 2(C), (D) and S1†) all retained the macroscopic morphology of PCP800, suggesting that the macroscopic structure of PCP800 was not destroyed by the second calcination process even at a higher temperature. On the microscopic structure, the PCPx tended to graphitization with the increase in calcination temperature. As shown in Fig. S2(C–F),† graphitic layers were becoming more and more obvious, especially in Fig. S2(F).†For, the specific surface areas and pore-size distribution of the samples (Al-PCP800, PCP800, PCP1200, PCP1600) were characterized by using N2 adsorption–desorption isotherms and shown in Fig. 3(A) and (B). As shown in Fig. 3(A), the steep increase in the adsorbed volume of Al-PCP800 at low relative (P/P0 < 0.1) revealed the presence of micropore, and the following small slope at medium relative pressure (0.1 < P/P0 < 0.8) as well as the desorption hysteresis denoted the existence of developed mesopores, while the final almost vertical tail at the relative pressure near 1.0 pointed to the presence of macropore.26 Al-PCP800 showed a BET surface area of 495.7 m2 g−1. The pore-size distribution calculated using a method called Non-Localized Density Functional Theory (NLDFT) (Fig. 3(B)) was distributed from 0.6 to 2.0 nm and the cumulative pore volume was 0.425 cm3 g−1. After HF treatment, there was a more sharply steep increase in the adsorbed volume of PCP800 at low relative pressure, indicating more micropores were generated. The BET surface area of PCP800 was 2669.9 m2 g−1 which was 5.4 times more than that of Al-PCP800. The pore-size was widely distributed from 0.6 to 5.0 and the cumulative pore volume was 1.352 cm3 g−1. These results revealed that the HF treatment was critical for the formation of NPCs. After the second-step calcined process, the N2 adsorption–desorption isotherms of PCP1200 and PCP1600 changed slightly, and the BET surface areas slightly increased to 2721.7 and 2773.5 m2 g−1, respectively. The cumulative pore volumes were 1.618 and 1.885 cm3 g−1. This result indicating that the porous structure of PCPx obtained in first-step calcined process was extremely stable in the second-step calcined process even at high temperature. In previous study of Hu et al., they reported that when Al-PCP was calcined at higher temperatures (above 900 °C), the surface area drastically decreased to ∼200 m2 g−1 due to the collapse of the nanoporous structure caused by graphitization.23 In this study, the two-step carbonized method can successfully avoid the occurrence of that phenomenon.
Fig. 3(C) shows the Raman spectrum of PCPx. The peak at 1350 cm−1 (D-band) is attributed to the vibration of sp2 hybridize carbon atoms, while the peak at 1580 cm−1 (G-band) is attributed to the vibration of sp3 hybridized carbon atoms. The intensity ratio of D-band to G-band (ID/IG) can be used to evaluate the degree of crystallization.4 The intensity ratios of D-band to G-band (ID/IG) were 1.768, 1.293, 1.166, 1.103 and 0.998 of PCPx (x is from low to high), respectively, suggesting that the degree of crystallization was increased with the increase in calcination temperature and PCPx were amorphous carbon. The chemical structure and composition of Al-PCP800, PCP800 and PCP1600 were further studied by XRD and shown in Fig. 3(C). The strong peak at 16.0° in the XRD pattern of the Al-PCP800 was attributed to Al2O3 which was formed by a dehydration reaction of Al(OH) parts of Al-PCP under a high temperature. While there was no peak at 16.0° in the XRD pattern of PCP800, indicating that the Al component was sufficiently removed by HF. Several broad peaks were observed at 26.0° and 44° in all patterns, which were belong to a typical (002) interlayer peak of graphitic carbon.
3.2. Direct electrochemical properties
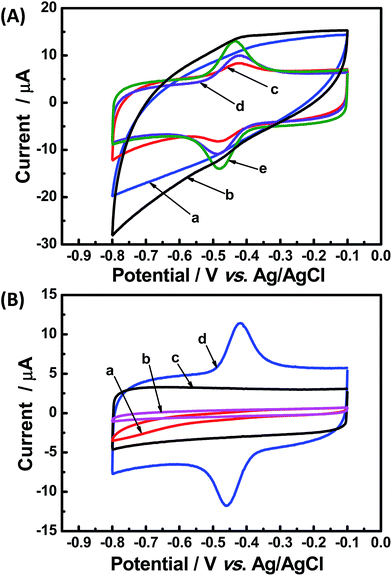
The direct electrochemical performances of GOx based on PCPx modified glassy carbon electrode were investigated by cyclic voltammetry (CV) and shown in Fig. 4(A). Obviously, there were no peaks on the Nafion/GOx/PCP800/GCE (curve a) and Nafion/GOx/PCP1000/GCE (curve b), while a pair of well-defined redox peaks were observed at the others electrodes (curve c–e) and the higher carbonized temperature the larger peak current. Especially, the redox peak separation (ΔEp) of 43 mV at Nafion/GOx/PCP1600/GCE (curve e) was estimated, indicating a high-efficient electron transfer rate.7 Hence, the Nafion/GOx/PCP1600/GCE was used as the model electrode in the subsequent experiments. Fig. 4(B) shows the CVs of Nafion/GCE (curve a), Nafion/GOx/GCE (curve b), Nafion/PCP1600/GCE (curve c), Nafion/GOx/PCP1600/GCE (curve e). As expect, no redox peak was observed at the curve a, b and c while a pair of well-defined redox peaks were observed at the curve e, indicating that the redox peak was attributed to the GOx.10 The reaction mechanism of GOx on an electrode without the interference of oxygen was previously proposed,34 and the equation was shown below:| GOx(FAD) + 2H+ + 2e− ↔ GOx(FADH2) | (1) |
Curve d in Fig. 4(B) displayed a pair of redox peaks with anodic peak potential at −0.418 V and reduction peak potential at −0.461 V. Its formal potential E′0, the average of anodic and reduction peak potentials, was estimated to be −0.440 V, which was very close to that of GOx and its cofactor FAD reported previously,9 suggesting that the GOx molecules retained their bioactivity after they were immobilized on PCP1600. Therefore, all these results indicated that the MOFs-derived nanoporous carbons have tremendous potential for the application in immobilization of enzymes.
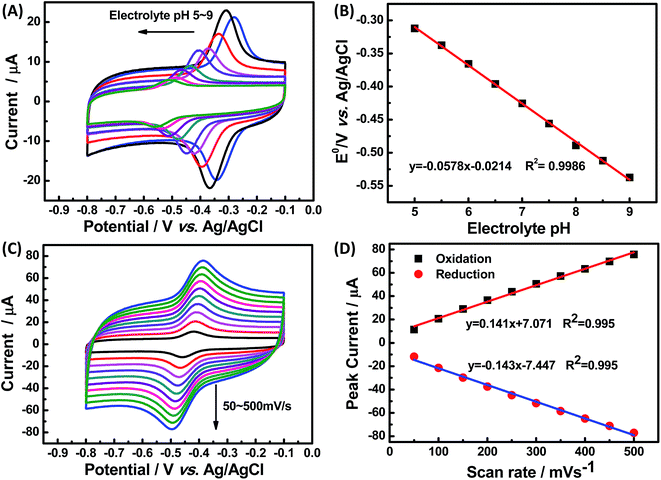
The effect of supporting electrolyte pH value on the direct electron transfer of GOx was studied.9 Fig. 5(A) shows the CVs of Nafion/GOx/PCP1600/GCE in 0.1 M Ar-saturated PBS with various pH values from 5 to 9 at a scan rate of 50 mV s−1. The formal potential E′0 displayed a linear relation to pH with a slope of 57.8 mV per pH (R2 = 0.9986) (Fig. 5(B)). This value was very close to the theoretical value of −59.2 mV pH−1, indicating that two-proton and two-electron participated in the transportation process of FAD/FADH2 redox couples in the GOx.35 The effect of scan rate on the electrochemical performance of Nafion/GOx/PCP1600/GCE was shown in Fig. 5(C). The redox peak currents increased linearly with the potential scan rate increasing from 50 to 500 mV s−1 (Fig. 5(D)), indicating a quasi-reversible surface-controlled electrochemical process.36 Furthermore, the dependence of anodic and reduction peak potentials on the Napierian logarithm of scan rates was examined and used to determine anodic electrochemical parameters according to eqn (2) and (3):37
 | (2) |
 | (3) |
 | (4) |
From the eqn (4), ks was estimated to be 9.5 at 100 mV s−1, which is larger than that in previous reports.2,10 According to the Laviron eqn (5):37
 | (5) |
3.3. Bio-catalytic property of the Nafion/GOx/PCP1600/GCE electrode and its application in biofuel cell
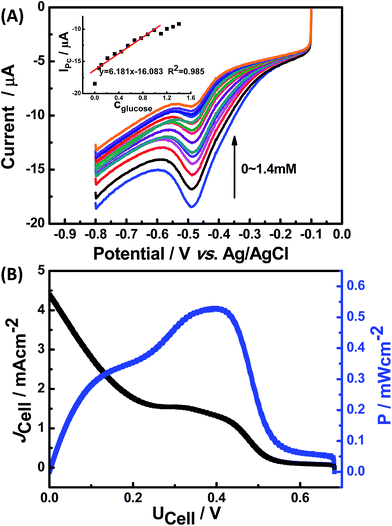
Fig. 6(A) shows the CV curves of Nafion/GOx/PCP1600/GCE in air-saturated 0.1 M PBS containing different concentrations of glucose at a scan rate of 50 mV s−1. The reduction peak current decreased gradually with increasing glucose concentration. It's well known that the DET process of GOx is a two-electron and two-proton coupled reaction. The reduction peak current IPc is attributed to reduction of GOx(FAD), while the anodic peak current IPa is attributed to oxidation of GOx(FADH2).35 Upon addition of glucose, the reduction peak current decreased linearly, which could be attributed to the enzyme-catalyzed glucose oxidation (reaction (6)). The calibration curve (inset in Fig. 6(A)) corresponding to CV response was linear against the glucose concentration ranging from 0.07 to 0.99 mM with a sensitivity of 6.81 μA mM−1. The detection limit was estimated to be about 0.065 mM based on the criterion of a signal-to-noise ratio of 3.13| GOx(FAD) + glucose → GOx(FADH2) + gluconolactone | (6) |
Anti-interference ability of the fabricated electrode of Nafion/GOx/PCP1600/GCE was investigated by introducing electro active species such as AA and UA. Fig. S4† shows i–t curve of the influence of AA (0.5 mM) and UA (0.5 mM) on the detection of glucose at the applied potential of −0.4 V versus Ag/AgCl. When these species were consecutively added into continuously stirred 0.1 M PBS the current response were changed weakly, indicating that Nafion/GOx/PCP1600/GCE exhibited good selectivity for glucose.
The performance of the assembled glucose/O2 BFC was further investigated under the optimum conditions. Fig. 6(B) shows the current and the power density of the BFC as a function of the operating cell voltage (I–V and I–P curves) at a room temperature (25 °C).19 The open-circuit voltage (VOC) and the short-circuit current of the BFC are 0.68 V and 4.46 mA cm−2, respectively. A maximum power density of 0.548 mW cm−2 was obtained at 0.41 V.
4. Conclusions
In this study, we successfully prepared NPCs with a high surface area and large pore volume by a two-step carbonized method of Al-PCP. The obtained PCP1600 exhibited highly hierarchical porous carbons with a high BET surface area up to 2773.5 m2 g−1 and high cumulative pore volume up to 1.885 cm3 g−1. Base on PCP1600, a high performance bioanode has been developed successfully. The fabricated electrode of Nafion/GOx/PCP1600/GCE showed efficient DET and good catalytic activity towards glucose oxidation. In addition, a glucose/O2 BFC fabricated by the GOx electrode as the bioanode and a commercial E-TEK Pt/C modified GC electrode as the cathode, delivered a maximum power density of 0.548 mW cm−2 at 0.41 V. The two-step carbonized method provides a new example of thermal decomposition of MOFs, which can avoid the collapse of MOF structure at high temperatures. This finding may show tremendous potential for exploring more NPCs derived from MOF family.Conflict of interest
The authors declare no competing financial interest.Acknowledgements
Financial support for this work was provided by National Natural Science Foundation of China (No. 81301345, No. 61402486) and the Fundamental Research Funds for the Central Universities (FRF-TP-15-002C1).References
- Y. Chen, P. Gai, J. Zhang and J.-J. Zhu, J. Mater. Chem. A, 2015, 3, 11511–11516 CAS.
- K. P. Prasad, Y. Chen and P. Chen, ACS Appl. Mater. Interfaces, 2014, 6, 3387–3393 CAS.
- M. Rasmussen, S. Abdellaoui and S. D. Minteer, Biosens. Bioelectron., 2016, 76, 91–102 CrossRef CAS PubMed.
- Y. Zhang, M. Chu, L. Yang, Y. Tan, W. Deng, M. Ma, X. Su and Q. Xie, ACS Appl. Mater. Interfaces, 2014, 6, 12808–12814 CAS.
- M. Ammam and J. Fransaer, J. Power Sources, 2014, 257, 272–279 CrossRef CAS.
- D. Sarauli, K. Peters, C. Xu, B. Schulz, D. Fattakhova-Rohlfing and F. Lisdat, ACS Appl. Mater. Interfaces, 2014, 6, 17887–17893 CAS.
- R. Zhao, X. Liu, J. Zhang, J. Zhu and D. K. Wong, Electrochim. Acta, 2015, 163, 64–70 CrossRef CAS.
- L. Qian and L. Lu, RSC Adv., 2014, 4, 38273 RSC.
- Y. F. Gao, T. Yang, X. L. Yang, Y. S. Zhang, B. L. Xiao, J. Hong, N. Sheibani, H. Ghourchian, T. Hong and A. A. Moosavi-Movahedi, Biosens. Bioelectron., 2014, 60, 30–34 CrossRef CAS PubMed.
- Q. Liu, X. Lu, J. Li, X. Yao and J. Li, Biosens. Bioelectron., 2007, 22, 3203–3209 CrossRef CAS PubMed.
- H. Uk Lee, H. Young Yoo, T. Lkhagvasuren, Y. Seok Song, C. Park, J. Kim and S. Wook Kim, Biosens. Bioelectron., 2013, 42, 342–348 CrossRef CAS PubMed.
- A. A. Babadi, S. Bagheri and S. B. Hamid, Biosens. Bioelectron., 2016, 79, 850–860 CrossRef CAS PubMed.
- J. Chen, R. Zhu, J. Huang, M. Zhang, H. Liu, M. Sun, L. Wang and Y. Song, Analyst, 2015, 140, 5578–5584 RSC.
- N. Wang, M. Wen and Q. Wu, Colloids Surf., B, 2013, 111, 726–731 CrossRef CAS PubMed.
- J. Liu, C. Guo, C. M. Li, Y. Li, Q. Chi, X. Huang, L. Liao and T. Yu, Electrochem. Commun., 2009, 11, 202–205 CrossRef CAS.
- R. Zhao, X. Liu, J. Zhang, J. Zhu and D. K. Y. Wong, Electrochim. Acta, 2015, 163, 64–70 CrossRef CAS.
- C. Hou, D. Yang, B. Liang and A. Liu, Anal. Chem., 2014, 86, 6057–6063 CrossRef CAS PubMed.
- J. Balamurugan, T. D. Thanh, N. H. Kim and J. H. Lee, Biosens. Bioelectron., 2016, 83, 68–76 CrossRef CAS PubMed.
- J. Liu, X. Zhang, H. Pang, B. Liu, Q. Zou and J. Chen, Biosens. Bioelectron., 2012, 31, 170–175 CrossRef CAS PubMed.
- S. El Ichi, A. Zebda, A. Laaroussi, N. Reverdy-Bruas, D. Chaussy, M. Naceur Belgacem, P. Cinquin and D. K. Martin, Chem. Commun., 2014, 50, 14535–14538 RSC.
- A. J. Amali, J. K. Sun and Q. Xu, Chem. Commun., 2014, 50, 1519–1522 RSC.
- Y. Li, Y. X. Zhou, X. Ma and H. L. Jiang, Chem. Commun., 2016, 52, 4199–4202 RSC.
- M. Hu, J. Reboul, S. Furukawa, N. L. Torad, Q. Ji, P. Srinivasu, K. Ariga, S. Kitagawa and Y. Yamauchi, J. Am. Chem. Soc., 2012, 134, 2864–2867 CrossRef CAS PubMed.
- A. Aijaz, N. Fujiwara and Q. Xu, J. Am. Chem. Soc., 2014, 136, 6790–6793 CrossRef CAS PubMed.
- L. Wang, F. Ke and J. Zhu, Dalton Trans., 2016, 45, 4541–4547 RSC.
- B. Liu, H. Shioyama, T. Akita and Q. Xu, J. Am. Chem. Soc., 2008, 130, 5390–5391 CrossRef CAS PubMed.
- E. Magner, Chem. Soc. Rev., 2013, 42, 6213–6222 RSC.
- Z. Zhou and M. Hartmann, Chem. Soc. Rev., 2013, 42, 3894–3912 RSC.
- Z. Zhou and M. Hartmann, Top. Catal., 2012, 55, 1081–1100 CrossRef CAS.
- Y. Cui, B. Li, H. He, W. Zhou, B. Chen and G. Qian, Acc. Chem. Res., 2016, 49, 483–493 CrossRef CAS PubMed.
- A. Comotti, S. Bracco, P. Sozzani, S. Horike, R. Matsuda, J. Chen, M. Takata, Y. Kubota and S. Kitagawa, J. Am. Chem. Soc., 2008, 130, 13664–13672 CrossRef CAS PubMed.
- Inamuddin, K. Ahmad and M. Naushad, Int. J. Hydrogen Energy, 2014, 39, 7417–7421 CrossRef CAS.
- G. Srinivas, Energy Environ. Sci., 2013, 7, 335–342 Search PubMed.
- M. Tasviri, H.-A. Rafiee-Pour, H. Ghourchian and M. R. Gholami, J. Mol. Catal. B: Enzym., 2011, 68, 206–210 CrossRef CAS.
- B. Liang, X. Guo, L. Fang, Y. Hu, G. Yang, Q. Zhu, J. Wei and X. Ye, Electrochem. Commun., 2015, 50, 1–5 CrossRef CAS.
- Z. Li, C. Xie, J. Wang, A. Meng and F. Zhang, Sens. Actuators, B, 2015, 208, 505–511 CrossRef CAS.
- A. S. Campbell, Y. J. Jeong, S. M. Geier, R. R. Koepsel, A. J. Russell and M. F. Islam, ACS Appl. Mater. Interfaces, 2015, 7, 4056–4065 CAS.
- K. H. Hyun, S. W. Han, W.-G. Koh and Y. Kwon, J. Power Sources, 2015, 286, 197–203 CrossRef CAS.
- E. Laviron, J. Electroanal. Chem. Interfacial Electrochem., 1974, 52, 395–402 CrossRef CAS.
- H. P. Peng, R. P. Liang, L. Zhang and J. D. Qiu, Biosens. Bioelectron., 2013, 42, 293–299 CrossRef CAS PubMed.
Footnote |
| † Electronic supplementary information (ESI) available. See DOI: 10.1039/c7ra00852j |
| This journal is © The Royal Society of Chemistry 2017 |

