 Open Access Article
Creative Commons Attribution 3.0 Unported Licence
Maghemite–gold core–shell nanostructures (γ-Fe2O3@Au) surface-functionalized with aluminium phthalocyanine for multi-task imaging and therapy
B. C. P. Coelhoa,
E. R. Siqueirab,
A. S. Ombredaneb,
G. A. Joanittib,
S. B. Chavesb,
S. W. da Silvac,
J. A. Chakerd,
J. P. F. Longob,
R. B. Azevedob,
P. C. Moraisce and
M. H. Sousa *d
*d
aFederal Institute of Education Science and Technology of Brasília, Brasília, 72429-005, Brazil
bDepartment of Genetics and Morphology, Institute of Biological Sciences, University of Brasília, Brasília, 70919-900, Brazil
cInstitute of Physics, University of Brasília, Brasília, 70910-900, Brazil
dGreen Nanotechnology Group, Faculty of Ceilândia, University of Brasília, Brasília, 72220-900, Brazil. E-mail: mhsousa@unb.br
eAnhui University, School of Chemistry and Chemical Engineering, Hefei 230601, China
First published on 13th February 2017
Abstract
In this study we report on the elaboration and characterization of core–shell maghemite–gold nanoparticles with the shell modulated for different thicknesses below 2 nm. Gold-shelled maghemite nanoparticles with an average core size of about 9 nm were developed using a single-step protocol involving reduction of Au3+ in the presence of citrate-coated maghemite nanoparticles. Additionally, post-functionalization of the core–shell structures with aluminium phthalocyanine was successfully accomplished, aimed at the production of a material platform for photodynamic therapy. The as-produced samples were structurally, morphologically, magnetically and optically characterized and presented long-term colloidal stability at physiological pH. Impressively, we found the as-produced samples showed good X-ray attenuation properties, making them able to be used as nanoprobes for targeted computed tomography. Moreover, in vitro nanocytotoxicity tests confirmed a superior biocompatibility of the as-produced samples, making them a very promising multi-task platform for in vivo applications.
Introduction
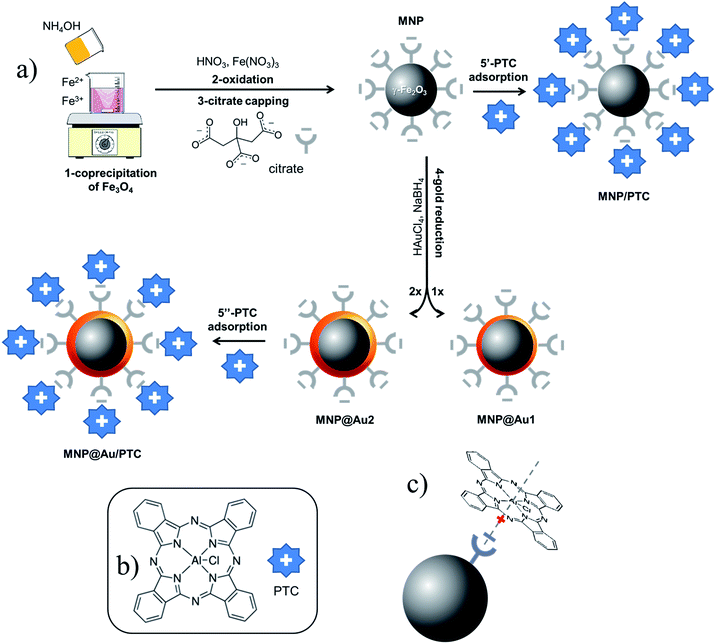
Iron oxide nanoparticles, mainly magnetite (Fe3O4) and maghemite (γ-Fe2O3), have found numerous applications in the biomedical field, credited to their size-dependent physical (e.g. magnetic and optical) and chemical (e.g. surface reactivity) properties, which can be used not only to improve biocompatibility and specificity, but also offer a way to achieve the dual goal of theranostics (diagnostics plus therapy).1 Along this line, co-assembled nanosized magnetic iron oxide and metallic gold in a core–shell heteromaterial has attracted broad interest, aimed at its application as a multifunctional material nanoplatform.2 Magnetism associated with the core iron oxide affords noninvasive manipulation (using gradient of magnetic field) and heating (using AC magnetic field), which are key features for site targeting and magnetohyperthermia,3 respectively. Additionally, while lowering nanotoxicity the gold-shell increases long-term colloidal stability and presents a versatile platform for bioconjugation.4 Furthermore, at the nanoscale surface plasmon in gold is enhanced, which results in significant and tunable optical absorption and emission in the visible (VIS) and near-infrared (NIR) regions, covering the biological window of human tissues while allowing partial transparency to light.5 Therefore, in addition to magnetohyperthermia, gold-shelled magnetic nanoparticles are useful in photothermal therapy, where localized heating is accomplished via light irradiation.6 Besides, due to their unique optical properties gold-based nanostructures can act as fluorescent probes for in vivo imaging.7 Moreover, fluorophores can easily functionalize gold-terminated surfaces, thus enhancing the optical performance of gold-shelled magnetic iron oxide nanoparticles. Particularly interesting for surface-functionalization are phthalocyanines, which are photosensitizers capable of converting specific light energy into chemical potential and widely used in photodynamic therapy (PDT).8 However, due to the high hydrophobicity and tendency to self-aggregate in aqueous medium the use of phthalocyanines is quite limited in the bioenvironment. To circumvent this drawback phthalocyanines have been incorporated into nanostructured systems, such as nanoemulsions9 or linked to magnetic10 and gold11 nanoparticle surfaces, resulting in improvement in PDT efficacy. Still in the diagnostics area, while presenting high electron density and strong X-ray attenuation gold-based nanostructures can be used as contrast agents for computed tomography (CT) imaging.12 Worth mentioning that the conventional iodine-based contrast agents usually present severe limitations, such as short imaging time and low specificity.This study reports on the elaboration and investigation (structural, morphological, magnetic, optical, and biological) of nanostructures comprising a magnetic core (maghemite) surface-shelled with gold, which is further surface-functionalized with aluminium phthalocyanine to act as a nanoplatform for multi-therapy and multi-imaging combined techniques. Gold-shelled maghemite nanoparticles, with Au-shell modulated for different thicknesses, were elaborated by borohydride-mediated reduction of Au3+ in the presence of citrate-capped maghemite nanoparticles, the latter obtained by co-precipitation in aqueous medium. Maghemite–gold core–shell nanostructures surface-functionalized with aluminium phthalocyanine is a novelty in the literature, yielding sols with long-term colloidal stability and biocompatibility. The promising application of the as-elaborated materials as contrast agents in computed tomography imaging was herein evaluated using a commercial microtomograph (SkyScan1076, Bruker). In order to support the bioimaging application of the as-elaborated nanoplatform in vitro assays were performed to assess the nanocytotoxicity.
Experimental
All chemicals listed in the present report were of analytical degree and used as received without any further purification. Water used to perform the experiments was purified by a Milli-Q water system (Millipore, USA).Samples
Characterization
X-ray diffraction (XRD) powder analyses of the samples were carried out in a Miniflex 600 diffractometer (Rigaku) over 2θ range of 20–70°, using Cu-Kα radiation (λ = 1.541 Å) and operating at 40 kV and 30 mA. Size and morphology of the as-produced materials were examined by high-resolution transmission electron microscopy (HRTEM) using a JEOL 1100 apparatus. Room temperature magnetization curves were obtained using a vibrating sample magnetometer (VSM) ADE model EV7. Hysteresis loops were recorded in the ±18 kOe range. Chemical analyses of the as-produced samples14 were determined using an inductively coupled plasma optical emission spectrometer (ICP-OES) Perkin Elmer model Optima 8000, with radiofrequency power of 1400 W, 1.5 mL min−1 sample flux, 10 L min−1 argon plasma flux, nebulizer flux 0.7 L min−1 and flux of auxiliary gas (argon) of 0.2 L min−1. Hydrodynamic average diameter (DH), polydispersity indexes (PDI) and zeta potential (ζ-potential) of the as-produced nanoparticles were assessed from aqueous dispersions using a dynamic light scattering (DLS) Zetasizer nano ZS system (Malvern Instrument). Ultraviolet visible (UV-vis) spectra of aqueous dispersions were recorded on a spectrophotometer Shimadzu UV 2600. The X-ray density of samples was evaluated in plastic microtubes using a microtomograph device (SkyScan1076, Bruker) with the following parameters: 50 kV, 180 μA, 0.5 mm Al filter, 100 ms of exposition and pixels size of 35 μm. NRecon® and CTAn® softwares were employed respectively for reconstruction and image analysis. Slices were analyzed with Dataviewer® software. The Hounsfield scale (HU units) was used to quantify the X-ray density and a 3D image of the samples was prepared for qualitative evaluation. Using surface-enhanced Raman spectroscopy (SERS) technique, spectra were recorded after diluting the samples in distilled water (or ethanol for PTC), dropping them onto nanostructured probing silver films, and drying the wet films under nitrogen gas flux. The samples were illuminated using the 514.5 nm line of an argon ion laser, after passing the laser beam through a cylindrical lens and focusing (0.1 W cm−2) it onto the probed surface containing the samples while setting the acquisition time for 2 min. The scattered light was collected in almost backscattering configuration and analyzed using a triple spectrometer (Jobin Yvon Model T64000; Horiba) equipped with a charge-coupled device detector.Cell culture
Murine fibroblast cells (NIH-3T3) and human keratinocyte cells (HaCAT) were acquired from cell bank of Rio de Janeiro (Brazil). Dulbecco's Modified Eagle's Medium (DMEM) (Life, EUA) completed with 10% of fetal bovine serum and 1% of antibiotic solution (100 IU mL−1 penicillin to 100 μg mL−1 streptomycin, Life, EUA) was used to grow the cells at 37 °C and 5% CO2 in humid atmosphere.Cell treatment
The cells were grown into polystyrene culture flask of 75 cm2. The cells were counted using a Neubauer chamber and the number of the cells per mL was determined by the equation: number of cells per mL = (number of counted cells/4) × dilution factor × 104. For each experiment, the cells were seeded into a 96-well culture plates at the density of 3.103 cells per well in DMEM. The plates were incubated at 37 °C and 5% CO2 in humid atmosphere overnight.Cell-viability assay
Cell-viability assay was realized using MTT (3-[4,5-dimethylthiazol-2-yl]-2,5-diphenyltetrazolium bromide) dry reduction method. After 24 and 72 hours of incubation, 150 μL of the MTT solution (0.5 mg mL−1 in DMEM) was added in each well and the plates were incubated for 2 hours at 37 °C and 5% CO2 in humid atmosphere. The medium culture was discarded and 100 μL of dimethyl sulfoxide (DMSO) were added in each well. The absorbance was monitored using a spectrophotometer with a microplate reader at 595 nm (Molecular Devices, EUA) (Table 1).| Groups | MNP and MNP@Au (μg mL−1) | MNP and MNP@Au (μL) | H2O (μL) | Culture medium (μL) |
|---|---|---|---|---|
| Control | — | — | 50 | 150 |
| 1 | 100 | 50 | — | 150 |
| 2 | 50 | 25 | 25 | 150 |
| 3 | 25 | 12.5 | 37.5 | 150 |
| 4 | 12.5 | 6.25 | 43.75 | 150 |
| 5 | 6.25 | 3.12 | 46.88 | 150 |
Statistical analysis
The results were expressed as mean ± standard error of the mean (SEM). Evaluation of possible significant differences among the groups was determined by analysis of variance (ANOVA) and Bonferroni post hoc test using the program Prism 5 (EUA). The significance level was set at P < 0.05.Results and discussion
Samples
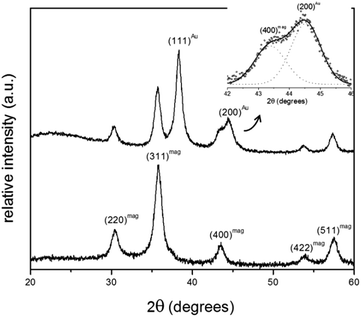
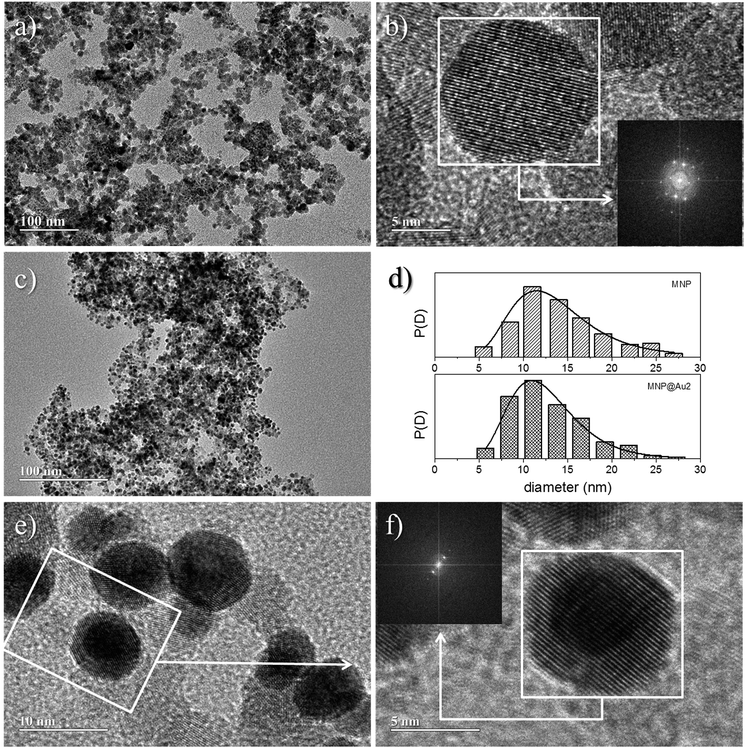
Fig. 2 shows XRD spectra of samples MNP and MNP@Au2. For the employed synthesis route all diffraction peaks observed sample MNP are consistent with the standard data of maghemite (JCPDS card no. 39-1346). The average crystallite size of the magnetic core, calculated from the 311 XRD line broadening of sample MNP using the Scherrer's formula, is about 9.3 nm. Additionally, for the MNP@Au2 sample, the XRD peaks appearing at 38.4° and 44.6° can be respectively assigned to (111) and (200) crystalline plane diffraction peaks of gold, in good agreement with standard data of gold (JCPDS file no. 040784).Moreover, one can notice a reduction of the maghemite XRD peak intensities after Au-capping, which is more likely due to the heavy atom effect of gold as a result of the formation of Au-coated γ-Fe2O3 nanoparticles.15 Similar results were found in the XRD data of sample MNP@Au1 (XRD data not shown here). Chemical analyses using ICP-OES revealed samples MNP@Au1 and MNP@Au2 with increasing gold content (Au/Fe2O3 ratio) of 7.3% and 12.1% (w/w), in agreement with the preparation protocol. Cross-linking ICP-OES data with XRD analyses strongly supports core–shell (γ-Fe2O3–Au) formation in samples MNP@Au1 and MNP@Au2, which is corroborated by the TEM data. As shown in Fig. 3a, maghemite nanoparticles (MNP) are polydisperse in size, but showing nearly spherical morphology. Moreover, the cubic structure of the maghemite phase is confirmed by fast Fourier transform (FFT) image shown in the inset of Fig. 3b (lower right hand-side), revealing planes (440), (311), (220) and (111) of the spinel phase. Fig. 3c shows a typical TEM image of sample MNP@Au2, with darker γ-Fe2O3 nanoparticle spots (darker than in the MNP sample) due to the Au-shell. Sparse-filled (MNP) and dense-filled (MNP@Au2) histogram patterned bars, assessed from the TEM micrographs, are shown in Fig. 3d, where black solid lines are the best fit using the lognormal size distribution. From this analysis, the average diameters (polydispersity index) of maghemite (MNP) and gold-coated nanoparticles (MNP@Au2) are respectively 12.9 nm (σ = 0.34) and 12.1 nm (σ = 0.30). This size-reduction could be associated to leaching of the iron oxide core during gold-coating, induced by the synthesis condition, such as low pH and the presence of reducing (sodium borohydride) and complexing (sodium citrate) agents.16 However, HRTEM of gold-coated nanoparticles shown in Fig. 3e clearly reveal core–shell formation with Au-shell thickness in the range of 1–2 nm, in good agreement with previous works.17 Furthermore, Fig. 3f shows HRTEM of an isolated core–shell (Au–γ-Fe2O3) nanoparticle where the interfringe spacings of the face centered cubic (FCC) gold (111) and (311) reflections are clearly seen in the FFT image (upper left hand-side inset), indicating that the maghemite nanoparticles are coated with a layer of crystalline gold.
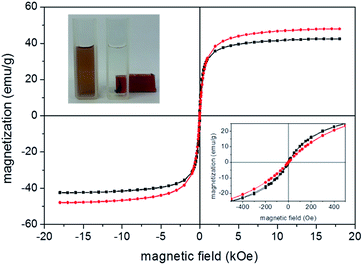
Magnetization measurements were performed for evaluating the Au-coating in the magnetic properties of the as-produced nanoparticles. Fig. 4 shows typical room temperature magnetization as a function of applied magnetic field recorded for samples MNP (red data) and MNP@Au2 (black data). We found the saturation magnetization decreasing from 47.9 emu g−1 (sample MNP) to 44.6 emu g−1 (sample MNP@Au1) and 42.4 emu g−1 (sample MNP@Au2), supporting the claim that a magnetic core (maghemite) is coated with a non-magnetic shell (gold).
Thus, considering there is no phase change of the magnetic core after Au-coating a Au/Fe2O3 ratio of 6.6% and 11.3% (w/w) can be estimated from the magnetization data respectively for samples MNP@Au1 and MNP@Au2, in good agreement with the chemical analysis (ICP-OES). Moreover, at room temperature the as-prepared uncoated and gold-coated nanoparticles shows superparamagnetic behavior, with negligible remanence and coercivity as shown in Fig. 4 (see lower right hand-side inset). Besides, saturation magnetization of the as-prepared core maghemite is lower than typical bulk values (60–80 emu g−1), credited to the nanometer size18 and surface functionalization.19 Likewise, the as-prepared samples functionalized with phthalocyanine also presented similar magnetic behavior, with no alteration of saturation magnetization. Moreover, as can be observed in the inset of Fig. 4 (upper left hand-side), separation of the magnetic nanoparticles out from the transparent solvent can be observed while adding acetone to the water-based suspension and keeping a permanent magnet attached to the sample holder for several hours. This finding strongly indicates attachment of gold and phthalocyanine onto maghemite nanoparticles.
The nature of maghemite surface-coating (gold, citrate, and/or aluminum phthalocyanine) changes the interface nanoparticle surface/solution and thus colloidal stability, which indeed affects optical properties. Therefore, DLS and UV-vis spectroscopy were used to assess surface modification information of bare maghemite nanoparticles. Table 2 lists DLS data for the as-prepared samples. All measurements were performed at pH ∼ 7 and 25 °C. The ζ-potential of citrate-coated maghemite nanoparticles (sample MNP) is highly negative (about −38 mV) and is likely due to the ionization of attached citrate molecules onto the oxide surface.20,21 The ζ-potential of gold-coated nanoparticles (samples MNP@Au1 and MNP@Au2) are also highly negative, not differing significantly from the value found for citrate-coated nanoparticles in sample MNP (see Table 2). Actually, it is well known that reduction of gold in the presence of sodium citrate yields gold-coated inorganic core nanoparticles with citrate molecules attached onto the surface, providing a negatively charged surface for the Au-coated nanoparticle.22 In the case of our samples, at neutral pH the free carboxyl groups of citrate are fully deprotonated, providing extra colloidal stability to the as-suspended nanoparticles via electrostatic repulsion. Magnetic separation of the as-produced sols (see inset of Fig. 4) is only achieved by adding a non-aqueous solvent, such as acetone.
| Sample | DH (nm) | PDI | ζ-Potential (mV) |
|---|---|---|---|
| MNP | 68.1 | 0.23 | −38.6 |
| MNP@Au1 | 114.3 | 0.19 | −34.3 |
| MNP@Au2 | 156.6 | 0.18 | −39.6 |
| MNP/PTC | 235.9 | 0.21 | −12.6 |
| MNP@Au/PTC | 211.1 | 0.25 | −25.5 |
Moreover, the hydrodynamic sizes of citrate-coated maghemite nanoparticles (sample MNP) increased from 68.1 nm to 114.3 nm and 156.6 nm for samples MNP@Au1 and MNP@Au2, respectively. This finding is credited to the increasing thickness of the deposited gold-shell onto the maghemite core. However, possible nanoparticle agglomeration must be considered in this analysis. On the other hand, data listed in Table 2 show that adsorption of aluminium phthalocyanine significantly reduces the ζ-potentials of samples MNP/PTC (−12.6 mV) and MNP@Au/PTC (−25.5 mV). The colloidal stability reduces while the ζ-potential decreases, reflecting on increasing hydrodynamic diameters after PTC coating (see Table 2). These results indicate that electrostatic interaction between negatively charged citrate-coated nanoparticles and positively charged aluminium phthalocyaninate occurs, as schematically shown in Fig. 1c. Previous work8 showed similar results where zinc tetrasulfonated phthalocyanine (a tetra-anion) was strongly adsorbed onto positively charged surface of maghemite nanoparticles. Furthermore, once PTC presents small charge-to-area ratio formation of a PTC layer onto the nanoparticle surface is not enough to neutralize all negative nanoparticle surface sites and therefore a net negative surface charge still remains, but smaller than before PTC coating.
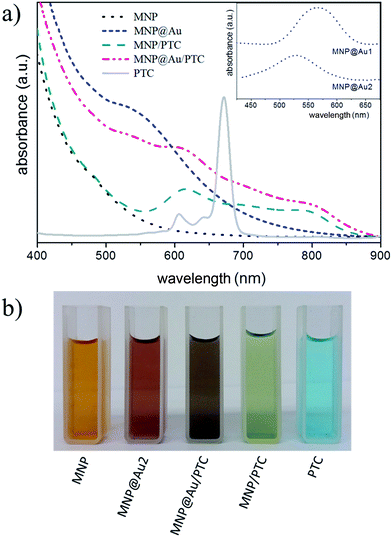
Typical UV-vis spectra of surface-coated (citrate, gold, and PTC) maghemite nanoparticles in suspension are shown in Fig. 5a. Citrated-coated maghemite nanoparticles present a wide silent feature in the visible region. On the other hand, gold-coated maghemite nanoparticles exhibit an absorption band centered around 555 nm, which is due to the surface plasmon absorption.23 In fact, it is reported that the position of this band depends on the core size as well as on the Au-shell thickness.24 In our case, as the ratio Au/Fe2O3 increases a blue shift of the surface plasmon peak is observed (see the inset of Fig. 5a), in good agreement with previous works.25 A reddish-pink color was observed in the brown tinged γ-Fe2O3 sol after Au-coating, indicating the formation of gold shell onto maghemite nanoparticles (see Fig. 5b). Moreover, after magnetic separation of nanoparticles from suspension of sample MNP@Au2 the supernatant remains colorless (see inset of Fig. 4), supporting this claim.
Fig. 5a also shows the UV-vis spectrum of PTC solution, showing a major band at 680 nm, which is characteristic of phthalocyanine monomeric state. Besides, two others bands labeled at 606 nm and 640 nm are present and assigned to vibrational transition.26 As shown in Fig. 5b after functionalizing maghemite (sample MNP) and gold-coated maghemite (sample MNP@Au2) nanoparticles with PTC to prepare samples MNP/PTC and MNP@Au/PTC the color of formed sols drastically changes to green and violet, respectively. Magnetic separation of suspensions of samples MNP/PTC and MNP@Au/PTC led to colorless supernatants, meaning that adsorption of PTC onto magnetic nanoparticles were effective. A surface plasmon absorption at 530 nm was still observed in sample MNP@Au/PTC, due to the Au-shell contribution.
Nevertheless, for PTC-functionalized samples (MNP/PTC and MNP@Au/PTC) the intense absorption band at 684 nm, typical of pure PTC, was practically suppressed. However, in the 606 nm and 640 nm regions, a broad band with a hypsochromic shift appears in PTC-functionalized nanoparticles (samples MNP/PTC and MNP@Au/PTC). This finding indicates interaction of PTC with magnetic nanoparticles.27
SERS was used to investigate the interaction of the PTC molecule with the nanoparticle's surface. The SERS spectra of the PTC-functionalized (MNP@Au/PTC) and alcoholic medium of PTC are displayed in Fig. 6a. For comparison, the conventional Raman spectrum of the PTC powder28 is also displayed in Fig. 6a. All the spectra were normalized using areas integrated in the range of 400 to 1800 cm−1. The SERS spectrum of the PTC molecule in both alcoholic medium (Fig. 6a(ii)) and MNP@Au/PTC (Fig. 6a(iii)) differs significantly from that of powder PTC (Fig. 6a(i)). As shown in Fig. 6b (a detail of the spectra in the wavelength range of 1560 to 1700 cm−1), the main spectral differences with respect to the PTC powder are firstly associated with the shift of C–N modes (from 1521 to 1502 cm−1 and 1535 to 1525 cm−1). Moreover, we observed enhancement of relative intensities of in-plane skeletal modes of PTC (around 1144, 1338, and 1440 cm−1), quenching of out-of-plane skeletal modes of PTC (around 750, 783, 1110, and 1305 cm−1), and the onset of extra vibrational modes of PTC in the region of 1550–1750 cm−1. Taking into account selection rules, which state that a planar-like molecule adsorbed perpendicularly (parallel) to a metal surface shows enhancement of the in-plane (out-of-plane) vibrational modes while compared to the out-of-plane (in-plane) ones,29 our findings suggest that the PTC molecule in MNP@Au/PTC is likely anchored perpendicularly to the probing silver film. However, extra peaks at 1578 and 1635 cm−1 can be observed only in the SERS spectrum of PTC in alcoholic medium, but not in sample MNP@Au/PTC. This finding strongly suggests that the PTC molecules in alcoholic medium are much more free to interact with the probing silver film, favoring perpendicular anchoring. Differently, in the MNP@Au/PTC sample parallel and perpendicular anchoring of the absorbed PTC molecules with the probing silver film can be expected, leading to the quenching of totally symmetric modes (1190 and 1210 cm−1) and the onset of forbidden ones, such as those observed at 960 and 1270 cm−1.
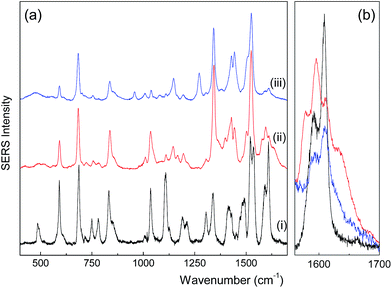 | ||
| Fig. 6 SERS spectra of (a) solid PTC (i), alcoholic medium of PTC (ii) and sample MNP@Au/PTC (iii) and (b) detail of the SERS spectra in the wavelength range of about 1560 to 1700 cm−1. | ||
Nanocytotoxicity
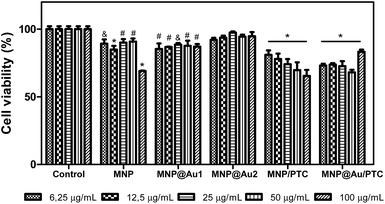
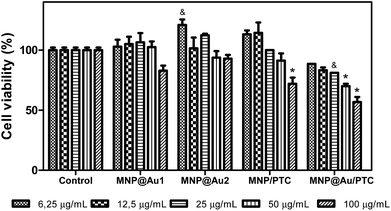
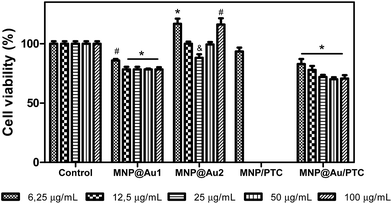
The cytotoxicity of the nanoparticles on keratinocyte cells after 24 hours of exposure is illustrated in the Fig. 7. The sample MNP and MNP@Au1 presented significant decrease of cell viability in all concentrations (6.25 to 100 μg mL−1). However, only MNP at higher concentration showed a significant biologically decrease of 30% of cell viability. At others concentrations, the decrease was about 5 to 10%, which is not considered biologically significant. The nanoparticle MNP@Au2 did not demonstrate cytotoxic activity in any concentration tested, probably due to the presence of gold that turned the nanostructure more biocompatible. In parallel, the nanoparticles associated to phthalocyanine were more cytotoxic.In fact, the MNP/PTC showed a dose-dependent activity and reduced the cell viability of 20 to 35%. The MNP@Au/PTC also demonstrated cytotoxic activity of 17 to 32%, but independent of the concentration. The effect of the samples on the HaCAT cell viability after 72 h of incubation is shown in Fig. 8. The MNP is not represented in the graph because the sample precipitate during the experiment making unfeasible the analysis of the cell viability. It is possible to observe that MNP@Au1 and MNP@Au2 did not show cytotoxic activity. The nanoparticles coated with phthalocyanine showed a dose-dependent activity. The MNP/PTC decreased the cell viability about 30% at higher concentration, similar to the activity observed after 24 hours of exposure. In parallel, the MNP@Au/PTC decreased the cell viability about 45% at 100 μg mL−1, more than the decrease observed after 24 hours of exposure. Therefore, the MNP@Au/PTC was more efficient after 72 hours of exposure than the MNP/PTC. The activity of the nanoparticles on the fibroblast cell viability was also investigated after 24 and 72 hours of exposure.
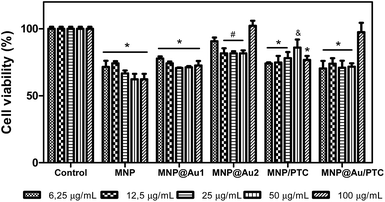
Fig. 9 shows the result after 24 hours. In this analysis, it is possible to observe that all samples demonstrated significant decrease of cell viability. The MNP and MNP@Au1 presented a decrease of cell viability about 30 to 40% and 20 to 30%, respectively, with the increase of concentrations. The MNP@Au2 demonstrated less activity with reduction of cell viability of only 20%. This reduction of toxicity can be explained by the presence and increment on the gold shell which allowed improving the biocompatibility, in good agreement with previous work.30 The sample with phthalocyanine reduced the cell viability in about 30%. Only the higher concentration of the MNP@Au/PTC did not demonstrated cytotoxic activity. After 72 hours of exposure, MNP in all concentrations and MNP/PTC at 12.5 to 100 μg mL−1 precipitate during the experiment making unfeasible the analysis of the cell viability. The MNP@Au1 induced reduction of cell viability in about 20%. In parallel, the MNP@Au2 only showed decrease of the cell viability of 10% at 25 μg mL−1, which is not considered biologically significant.
The MNP@Au2 showed biocompatible property in fibroblast cells line NIH3T3. The MNP/PTC did not present cytotoxic activity at 6.25 μg mL−1 after 72 hours of exposure. However, MNP@Au/PTC demonstrated a decrease of cell viability with the increase of concentration from 20 to 30%, which is more than after 24 hours of exposure (Fig. 10).
An important remark is that toxicity studies of PTC-conjugated nanoparticles were carried out under light. As a result, radiation excites the light-sensitive PTC, generating cytotoxic species,31 essential tool for PDT application and result that could explain the deflated biocompatibility of these nanostructures.
Computed tomography
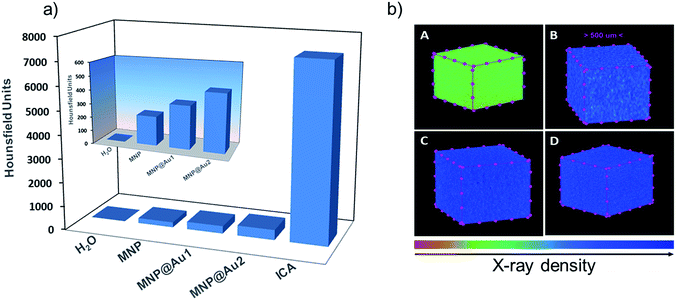
Fig. 11a shows the CT signal intensity, in HU, for bare maghemite (MNP) and gold-shelled MNP@Au1 and MNP@Au2 sols, compared to water (a negative control) and a positive control, an iodine-based contrast agent (ICA). The inset shows a detail of the CT signal for samples MNP, MNP@Au1 and MNP@Au2, compared to water. Moreover, qualitative images that represent the X-ray cell density of these samples are shown in Fig. 11b.As already reported,23 Au-shelled magnetic iron oxide nanohybrids show high CT attenuation mostly due to the presence of Au-shell, once Fe in the core displays weaker X-ray attenuation than Au in the shell due to the lower atomic mass of the former. Moreover, this attenuation is concentration dependent and increases with the content of the active element (i.e. the Au-shell thickness). For the same maghemite content (0.4 mg mL−1) we found the X-ray attenuation increasing as the thickness of the Au-shell increased in the range of 1–2 nm, in good agreement with the literature. While compared to water the CT signals of samples MNP@Au1 and MNP@Au2 are much higher, though smaller than the CT signal of ICA, which was used without dilution whereas the as-produced nanohybrid sols were highly diluted. The CT signal of sample MNP@Au2 (Au concentration ∼0.05 mg mL−1) was about 400 HU, which is much higher than the value reported for similar Au-shelled magnetic materials at 5 mg mL−1 gold concentration: such as ∼48 nm sized Au-shelled maghemite nanoparticles (∼240 HU);32 ∼35 nm sized gold-magnetite nanohybrid (∼190 HU);33 ∼20 nm polymer assembly with multicore Au–Fe3O4 entrapped nanoparticles (280 HU);12 and ∼150 nm sized Fe3O4–Au core/shell nanostars (∼200 HU).34 The higher efficient in CT attenuation found in the as-synthesized nanohybrids herein reported is likely due to an effective gold-coating of the magnetic core, reduced size of the nanohybrid and improved colloidal stability of the sols. Actually, aggregation of the nanomaterial strongly influences the X-ray attenuation and therefore the higher the sol stability the stronger the X-ray attenuation effect.35 Moreover, for the same gold mass the smaller the core size the better the CT response once more attenuation centers will be available in a given volume.36 Worth mentioning that in all cited works the average diameter of Au-shelled nanoparticles is above 20 nm, which is larger than the values reported in the present study (below 13 nm).
Moreover, despite the high X-ray attenuation, the contrast agents commercially available – which present low molecular weight – are rapidly eliminated by the kidneys, disabling their use in pre-clinical trials. In contrast, the kind of nanoparticles used here present long residence time in the blood stream, overcoming the challenge of pre-clinical tests.
Conclusions
In conclusion, citrate-coated maghemite nanoparticles were elaborated via aqueous co-precipitation, following oxidation and citrate functionalization via an improved chemical route herein described. Gold shells were successfully deposited onto magnetic cores by reducing Au3+ ions in the presence of γ-Fe2O3 nanoparticles during 2 cycles of borohydride seeding. Moreover, we succeed in modulating the gold shell thickness while increasing the Au/γ-Fe2O3 ratio during seeding. Successful gold-shelling was confirmed by different characterization techniques. Particularly interesting were the optical absorption measurements, showing a blueshift depending on the shell thickness. All samples presented a long-term colloidal stability in physiological pH, even after functionalization with aluminium phthalocyanine (PTC), as confirmed by DLS measurements.Moreover, according to in vitro nanocytotoxicity assays the gold-shelling enhanced the biocompatibility of the γ-Fe2O3 nanoparticles. Differently from previous works, in which functionalization with PTC requires several steps to complete, extra-cappings and/or cross-linking molecules to be covalently attached to nanoparticles, our data indicated strong electrostatic coupling between PTC and the nanoparticle surface, yet accomplished by a single-step process. Impressively, the gold-shelled nanoparticles revealed efficient response as a contrast agent in computed tomography, dependent upon the Au/γ-Fe2O3 ratio. Possible application of the as-elaborated core–shell nanoparticles will derive from the combination of magnetic properties of the core (maghemite) and the optical properties of the shell (gold). From the therapeutic point of view, the as-elaborated samples represent a promising multi-task platform to perform magnetic hyperthermia (core) combined or not with photothermal therapy (shell) and/or photodynamic therapy (PTC functionalization). Taking into account the diagnosis approach, the nanomaterials herein reported can also be used as optical probes and contrast agents in in vivo medical imaging techniques.
Acknowledgements
The authors gratefully acknowledge financial support from Conselho Nacional de Desenvolvimento Científico e Tecnológico (CNPq), Fundação de Apoio à Pesquisa do Distrito Federal (FAPDF), and Fundação de Empreendimentos Científicos e Tecnológicos (FINATEC).References
- G. S. Demirer, A. C. Okur and S. Kizilela, J. Mater. Chem. B, 2015, 3, 7831–7849 RSC.
- L. Wang, H.-Y. Park, S. I. I. Lim, M. J. Schadt, D. Mott, J. Luo, X. Wang and C.-J. Zhong, J. Mater. Chem., 2008, 18, 2629 RSC.
- A. Ito, H. Honda and T. Kobayashi, Cancer Immunol. Immunother., 2006, 55, 320–328 CrossRef CAS PubMed.
- K. Saha, S. S. Agasti, C. Kim, X. Li and V. M. Rotello, Chem. Rev., 2012, 112, 2739–2779 CrossRef CAS PubMed.
- N. S. Abadeer and C. J. Murphy, J. Phys. Chem. C, 2016, 120, 4691–4716 CAS.
- J. Ren, S. Shen, Z. Pang, X. Lu, C. Deng and X. Jiang, Chem. Commun., 2011, 47, 11692–11694 RSC.
- O. Chen, L. Riedemann, F. Etoc, H. Herrmann, M. Coppey, M. Barch, C. T. Farrar, J. Zhao, O. T. Bruns, H. Wei, P. Guo, J. Cui, R. Jensen, Y. Chen, D. K. Harris, J. M. Cordero, Z. Wang, A. Jasanoff, D. Fukumura, R. Reimer, M. Dahan, R. K. Jain and M. G. Bawendi, Nat. Commun., 2014, 5, 5093 CrossRef CAS PubMed.
- J. C. O. Silva, M. H. Sousa, F. A. Tourinho and J. C. Rubim, Langmuir, 2002, 18, 5511–5515 CrossRef CAS.
- L. A. Muehlmann, M. C. Rodrigues, J. P. Longo, M. P. Garcia, K. R. Py-Daniel, A. B. Veloso, P. E. de Souza, S. W. da Silva and R. B. Azevedo, J. Nanobiotechnol., 2015, 13, 36 CrossRef PubMed.
- O. Penon, M. J. Marin, D. B. Amabilino, D. A. Russell and L. Perez-Garcia, J. Colloid Interface Sci., 2016, 462, 154–165 CrossRef CAS PubMed.
- Y. Cheng, A. C. Samia, J. D. Meyers, I. Panagopoulos, B. Fei and C. Burda, J. Am. Chem. Soc., 2008, 130, 10643–10647 CrossRef CAS PubMed.
- H. Cai, K. Li, M. Shen, S. Wen, Y. Luo, C. Peng, G. Zhang and X. Shi, J. Mater. Chem., 2012, 22, 15110 RSC.
- S. Shrestha, P. Jiang, M. H. Sousa, P. C. Morais, Z. Mao and C. Gao, J. Mater. Chem. B, 2016, 4, 245–256 RSC.
- M. H. Sousa, G. J. da Silva, J. Depeyrot, F. A. Tourinho and L. F. Zara, Microchem. J., 2011, 97, 182–187 CrossRef CAS.
- M. Mandal, S. Kundu, S. K. Ghosh, S. Panigrahi, T. K. Sau, S. M. Yusuf and T. Pal, J. Colloid Interface Sci., 2005, 286, 187–194 CrossRef CAS PubMed.
- R. M. Cornell and U. Schertmann, The Iron Oxides: Structure, Properties, Reactions, Occurrence and Uses, VCH Publishers, Weinheim, 2003 Search PubMed.
- Z. Xu, Y. Hou and S. Sun, J. Am. Chem. Soc., 2007, 129, 8698–8699 CrossRef CAS PubMed.
- C. R. Alves, R. Aquino, M. H. Sousa, H. R. Rechenberg, G. F. Goya, F. A. Tourinho and J. Depeyrot, J. Metastable Nanocryst. Mater., 2004, 20, 694–699 CrossRef.
- M. Mikhaylova, D. K. Kim, N. Bobrysheva, M. Osmolowsky, V. Semenov, T. Tsakalakos and M. Muhammed, Langmuir, 2004, 20, 2472–2477 CrossRef CAS PubMed.
- J.-C. Bacri, R. Perzynski and D. Salin, J. Magn. Magn. Mater., 1990, 85, 27–32 CrossRef CAS.
- N. C. Feitoza, T. D. Goncalves, J. J. Mesquita, J. S. Menegucci, M. K. M. S. Santos, J. A. Chaker, R. B. Cunha, A. M. M. Medeiros, J. C. Rubim and M. H. Sousa, J. Hazard. Mater., 2014, 264, 153–160 CrossRef CAS PubMed.
- Y. C. Yeh, B. Creran and V. M. Rotello, Nanoscale, 2012, 4, 1871–1880 RSC.
- K. C. Leung, S. Xuan, X. Zhu, D. Wang, C. P. Chak, S. F. Lee, W. K. Ho and B. C. Chung, Chem. Soc. Rev., 2012, 41, 1911–1928 RSC.
- L. Wang, J. Luo, Q. Fan, M. Suzuki, I. S. Suzuki, M. H. Engelhard, Y. Lin, N. Kim, J. Q. Wang and C.-J. Zhong, J. Phys. Chem. B, 2005, 109, 21593–21601 CrossRef CAS PubMed.
- J. L. Lyon, D. A. Fleming, M. B. Stone, P. Schiffer and M. E. Williams, Nanoletters, 2004, 4, 719–723 CrossRef CAS.
- K. Liu, Y. Wang, J. Yao and Y. Luo, Chem. Phys. Lett., 2007, 438, 36–40 CrossRef CAS.
- M. Idowu and T. Nyokong, J. Photochem. Photobiol., A, 2007, 188, 200–206 CrossRef CAS.
- T. V. Basova, V. G. Kiselev, V. A. Plyashkevich, P. B. Cheblakov, F. Latteyer, H. Peisert and T. Chassè, Chem. Phys., 2011, 380, 40–47 CrossRef CAS.
- X. Gao, J. P. Davies and M. J. Weaver, J. Phys. Chem. C, 1990, 94, 6858–6864 CrossRef CAS.
- Y. Li, J. Liu, Y. Zhong, J. Zhang, Z. Wang, L. Wang, Y. An, M. Lin, Z. Gao and D. Zhang, Int. J. Nanomed., 2011, 6, 2805–2819 CrossRef CAS PubMed.
- C. S. de Paula, A. C. Tedesco, F. L. Primo, J. M. Vilela, M. S. Andrade and V. C. Mosqueira, Eur. J. Pharm. Sci., 2013, 49, 371–381 CrossRef PubMed.
- S. Zhang, Y. Qi, H. Yang, M. Gong, D. Zhang and L. Zou, J. Nanopart. Res., 2013, 15, 1–9 Search PubMed.
- S. Narayanan, B. N. Sathy, U. Mony, M. Koyakutty, S. V. Nair and D. Menon, ACS Appl. Mater. Interfaces, 2012, 4, 251–260 CAS.
- Y. Hu, R. Wang, S. Wang, L. Ding, J. Li, Y. Luo, X. Wang, M. Shen and X. Shi, Sci. Rep., 2016, 6, 28325 CrossRef CAS PubMed.
- D. Xi, S. Dong, X. Meng, Q. Lu, L. Meng and J. Ye, RSC Adv., 2012, 2, 12515 RSC.
- L. E. Cole, R. D. Ross, J. M. R. Tilley, T. Vargo-Gogola and R. K. Roeder, Nanomedicine, 2015, 10, 321–341 CrossRef CAS PubMed.
| This journal is © The Royal Society of Chemistry 2017 |

