 Open Access Article
Investigation into 1,3-butadiene and other bulk chemicals' formation from bioethanol over Mg–Al catalysts†
Meixiang Gaoab,
Minhua Zhangab and
Yonghui Li *ab
*ab
aKey Laboratory for Green Chemical Technology of Ministry of Education, R&D Center for Petrochemical Technology, Tianjin University, Tianjin 300072, PR China. E-mail: yhli@tju.edu.cn; liyh@tju.edu.cn; Fax: +86-22-27401826; Tel: +86-22-27401826
bCollaborative Innovation Center of Chemical Science and Engineering, Tianjin 300072, China
First published on 17th February 2017
Abstract
Mg–Al catalysts were adopted in the direct synthesis of 1,3-butadiene and other bulk chemicals from bioethanol. The influence of MgO content and sample calcination temperature on the catalytic performance was investigated. The optimization of reaction conditions for 1,3-butadiene, ethylene and 1-butanol, including reaction temperatures and the feed rate of ethanol, was also carried out. The catalysts were characterized by X-ray diffraction, nitrogen sorption, SEM, NH3-TPD, CO2-TPD and FTIR of adsorbed pyridine. On the basis of these analysis results and catalytic performance of yielding 1,3-butadiene, both the MgO content and the calcination temperature play a great role on the nature of acid and basic sites, then the proper active sites for producing 1,3-butadiene and other important chemicals such as ethylene and 1-butanol have been elaborated. The balance of moderate acid–basic sites is crucial to production of 1,3-butadiene from ethanol. Ethylene is obtained on strong acid and strong basic sites. 1-Butanol tends to form on the strong basic sites. To further improve the target product selectivity, modifiers adjusting the balance of acidity–basicity need to be involved in the Mg–Al catalysts.
1. Introduction
In the 21st century, the world is faced with the pressure of energy sources and energy-saving emission reduction.1 Utilization of reproducible resources effectively such as biomass, solar and geothermal power will be an effective measure to take to address those energy issue. Especially, large-scale utilization of the biomass is becoming a more and more important research topic.2 One of the most abundant practicable and sustainable raw materials produced from biomass is bioethanol,3–6 especially lots of researches have shifted toward non-grain biomass feedstock conversion to bioethanol recently.7–9 Conversion of bioethanol to some bulk chemicals is very important for several reasons, and maybe most significant of all, it helps to realize the reduction in nonrenewable fuel consumption and reduce environment pollution.101,3-Butadiene (BD) is widely applied in synthesis of rubber and polymers.11,12 With the development of economy, demand for BD is growing. The use of ethylene as raw material for chemical products is also being considered as an effective measure to offer the market an alternative of commodity plastics with a wide range of applications, especially to produce polyethylene and other polymers.13–16 Compared to the more commonly used ethanol, 1-butanol might be a promising gasoline replacement due to many advantages. Specifically, 1-butanol has a higher energy density than ethanol and is less corrosive.17
The mechanism of ethanol conversion to BD is also open to debate, currently. But the following reaction route is approved by most scholars: acetaldehyde formation from ethanol, acetaldehyde coupling to acetaldol, dehydration of acetaldol to crotonaldehyde, reaction between ethanol and crotonaldehyde to crotyl alcohol and dehydration of crotyl alcohol to BD. The process of 1-butanol from ethanol follows a similar reaction route with that of conversion of ethanol to BD, except that the final step to be the hydrogenation of the acetaldol to 1-butanol. Ethylene is formed from ethanol dehydration.
The main challenge in BD and other bulk chemicals production from ethanol is the relationship between product distribution and catalyst nature, although many classes of catalysts studied in this process.18–24 Our previous work was dedicated to improve new catalyst system and Mg–Al catalysts were adopted in this process based on some literatures.25–29 So the investigations on the influence of MgO content and calcination temperature on structure and properties of the catalysts, BD selectivity, and the optimization of reaction conditions will be focused in this study.
2. Experimental
2.1 Catalyst preparation
A balanced amount of 25% ammonia solution was slowly added in the mixed Mg(NO3)2·6H2O and Al(NO3)3·9H2O aqueous solutions respectively containing the 15 wt%, 20 wt%, 25 wt%, 30 wt%, 35 wt%, 40 wt% and 45% MgO at 333 K under stirring, maintaining the pH 9–10. Repeat the above operation until precipitate completely. All the precipitate samples were washed several times until the pH of the solution was 7. Then these samples were dried at 353 K for 6 h and calcined at 773 K for 5 h. The same method was adopted in the synthesis of 35 wt% Mg–Al but the samples were respectively calcined at 723 K, 773 K, 823 K, 873 K, 923 K and 973 K.2.2 Catalyst characterization
X-ray powdered diffraction patterns were obtained with a Rigaku Multiplex instrument using Cu–K radiation operated at 40 kV and 40 mA. Nitrogen adsorption isotherms were determined at 77 K on a Micromeritics Tristar 3000 volumetric adsorption analyzer. Before the adsorption measurements, all samples were preprocessed at 673 K in a degassing station for 12 h. Scanning electron micrograph (SEM) images were recorded on a Philips XL-30S FEG scanning electron microscope. The nature of acid sites and basic sites were measured by NH3-TPD and CO2-TPD using a Micromeritic Autochem II 2920. Pyridine adsorbed FTIR was studied on Thermo Scientific Nicolet 560 FTIR spectrometer with 64 scans at 4 cm−1 resolution.2.3 Catalytic test
The reaction of ethanol conversion to BD and other bulk chemicals was performed in a fixed bed reactor system at atmospheric pressure. The 3.0 g catalyst sieved to 0.425–0.850 mm (20–40 mesh) particle size was packed in the middle of the quartz tube (R = 22 mm). Before the reaction, the catalyst was pretreated to the reaction temperature (673 K, heating rate = 5.0 K min−1) carried by 40 ml min−1 N2 flow. The reaction was then performed with a preset weight hourly space velocity (WHSV) at preset reaction temperature. Products were detected online by Agilent 7890A equipped with a Carbon-Plot column (0.535 mm id × 3 μm thickness × 30 m length) and Thermal Conductivity Detector (TCD). The optimization reaction conditions included reaction temperature of 623 K, 648 K, 673 K, 698 K and 723 K as well as WHSV of 0.8 h−1, 1.2 h−1, 1.4 h−1, 1.8 h−1, 2.2 h−1 and 2.4 h−1.3. Results and discussion
3.1 Properties of Mg–Al catalysts
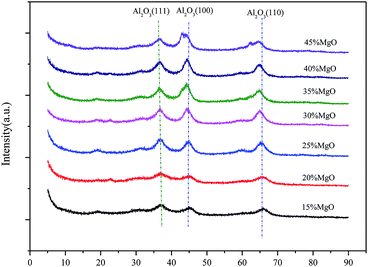
The structures of the Mg–Al catalysts with different MgO contents were analyzed by powder X-ray diffraction (Fig. 1). The XRD patterns of the Mg–Al samples with 15∼40% show typical peaks in 2θ = 37°, 45° and 65°, which corresponds to Al2O3 diffraction by planes (111), (100) and (110), respectively. While the MgO content increases to 45%, the typical diffraction patterns of MgO gradually appears.The textural characteristics of Mg–Al catalysts with different MgO contents are presented in Table 1. The BET surface areas gradually decreases as the MgO content increases from 15% to 45%. However, the change of the average pore diameters of all Mg–Al samples, which fluctuate in the range of 40–50 Å, shows no pattern with the increase of the MgO content, from 15% to 45%.
| MgO content | BET surface area (m2 g−1) | Average pore diameter (Å) |
|---|---|---|
| 15% | 271.2 | 54 |
| 20% | 188.7 | 44 |
| 25% | 176.7 | 51 |
| 30% | 164.6 | 45 |
| 35% | 155.8 | 43 |
| 40% | 151.3 | 46 |
| 45% | 133.2 | 47 |
SEM images of the Mg–Al samples with different MgO contents are shown in Fig. 2. As a whole, all the samples present irregularly blocky shapes. But as the MgO content increases, it exhibits a more spongy but distribution–intensive morphology. This may be explained by the fact that catalyst morphology shows MgO image when the MgO content increases to a certain extent. Moreover, this is agreed with the trends of the BET surfaces.
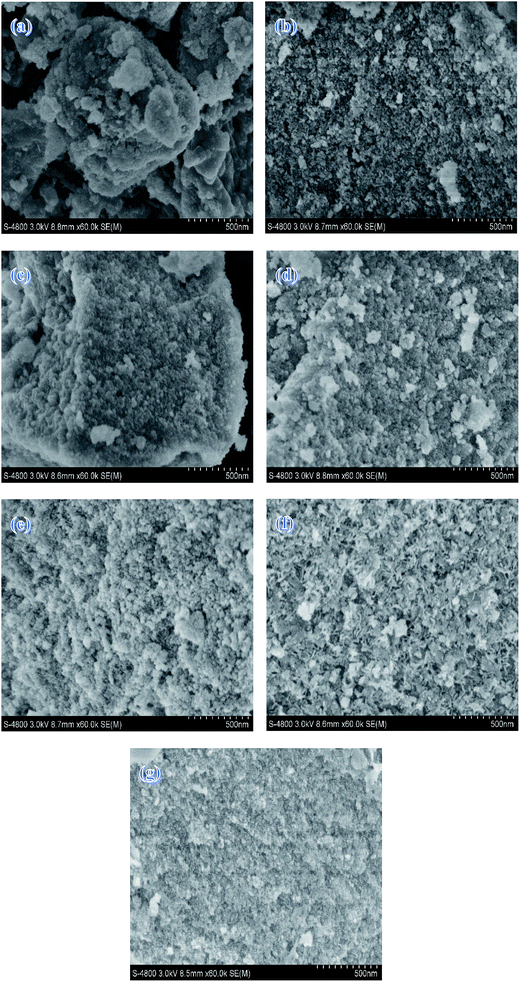 | ||
| Fig. 2 SEM images of (a) 15% Mg–Al (b) 20% Mg–Al (c) 25% Mg–Al (d) 30% Mg–Al (e) 35% Mg–Al (f) 40% Mg–Al (g) 245% Mg–Al. | ||
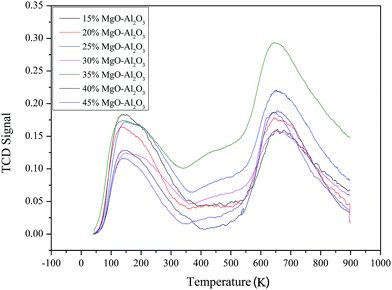
Acidic properties of Mg–Al catalysts with different MgO contents were studied by NH3-TPD (Fig. 3). NH3-TPD profiles of all samples show two intensive peaks on ∼423 K and ∼923 K, which suggests catalysts have weak and strong acid sites. The relative acid amounts of the catalyst estimated from the peak areas don't have much regulation as the MgO content increases. But the Mg–Al sample with 35% MgO content has the most amount of acid sites on the surface.
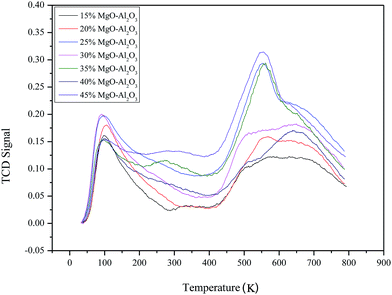
Similarly, the basic properties of the catalysts were investigated by CO2-TPD and the results are presented in Fig. 4. Two peaks of all samples appear at ∼373 K and ∼823 K, respectively. The peak at low temperature corresponds to weak basic sites and the high temperature peak is attributed to strong basic sites. The relative basic amounts of the catalyst estimated from the peak areas are still not regular with the varying MgO content. There are also more basic sites on the surface of the Mg–Al sample with 35% MgO content.
As shown in Fig. 5, the nature of acid sites was detected by IR spectroscopy of adsorbed pyridine. For samples with 15∼40% MgO content, two main bands detected at 1590 cm−1 and 1450 cm−1 are attributed to H-bonded pyridine and pyridine adsorbed on the Lewis acid sites, respectively. More interesting, adsorption strength of pyridine on catalyst surfaces slowly weakened as the MgO content increased so that Lewis acid sites could not be detected when the MgO content was 45%.
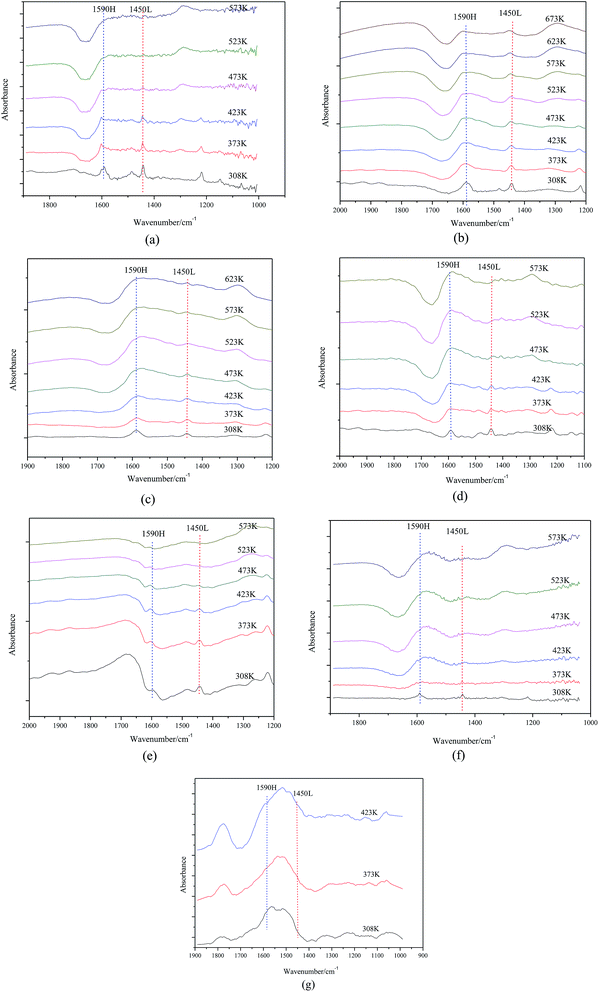 | ||
| Fig. 5 FTIR spectra of (a) 15% Mg–Al (b) 20% Mg–Al (c) 25% Mg–Al (d) 30% Mg–Al (e) 35% Mg–Al (f) 40% Mg–Al (g) 45% Mg–Al after pyridine adsorption. | ||
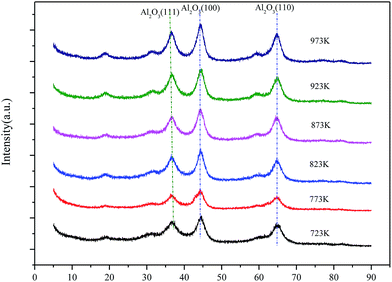
Based on the following catalyst activity data, Mg–Al catalysts with 35% MgO content were optimized. Now, calcination temperatures would be a more important factor needed to consider. XRD patterns of 35% Mg–Al catalysts with different calcination temperatures are shown in Fig. 6. Catalysts calcined at the temperatures from 723 K to 973 K only show typical features of crystalline Al2O3 (111), (100) and (110). No peaks due to crystalline MgO or any other crystalline impurity phases are discerned. But diffraction peak becomes sharper with the calcination temperature increasing, which indicates the crystallinity has improved.
Table 2 shows the structural properties of catalysts with different calcination temperatures. Both the BET surface areas and the average pore diameters fluctuate within the scope of 165–185 m2 g−1 and 40–60 Å, respectively. But there are still no patterns as the calcination temperature increasing, which can be confirmed by SEM images.
| Calcined temperature (K) | BET surface area (m2 g−1) | Average pore diameter (Å) |
|---|---|---|
| 723 | 166.3 | 44 |
| 773 | 185.0 | 41 |
| 823 | 170.1 | 56 |
| 873 | 175.9 | 48 |
| 923 | 179.4 | 60 |
| 973 | 169.1 | 49 |
SEM images of the samples with different calcination temperatures are shown in Fig. 7. All the samples, as a whole, present irregularly blocky shapes. There is no apparent agglomeration body as the calcination temperature goes up, which is agreed with BET measurement. This also illustrates that calcination temperature has little influence on the catalyst morphology at the temperature range of 723–973 K.
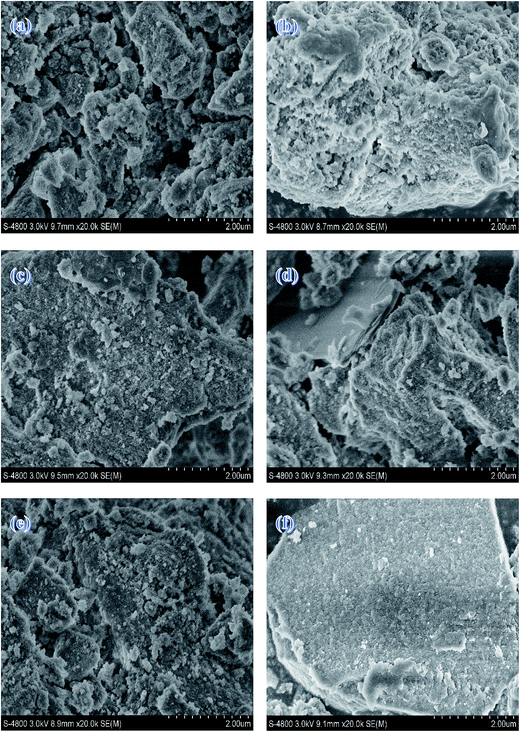 | ||
| Fig. 7 SEM images of (a) Mg–Al-723 K (b) Mg–Al-773 K (c) Mg–Al-823 K (d) Mg–Al-873 K (e) Mg–Al-923 K (f) Mg–Al-973 K. | ||
As shown in Fig. 8, the acid site nature of catalysts with different calcination temperatures was explored by IR spectroscopy of adsorbed pyridine. For samples (a), (b) and (c), there are two bands that can be detected at 1590 cm−1 and 1450 cm−1, which are due to H-bonded pyridine and pyridine adsorbed on the Lewis acid sites, respectively. However, no band can be observed for the samples (d), (e) and (f). That is, calcination temperature has influence on the acid site nature and higher calcination temperature makes Lewis acid sites disappear from the surface of the catalysts.
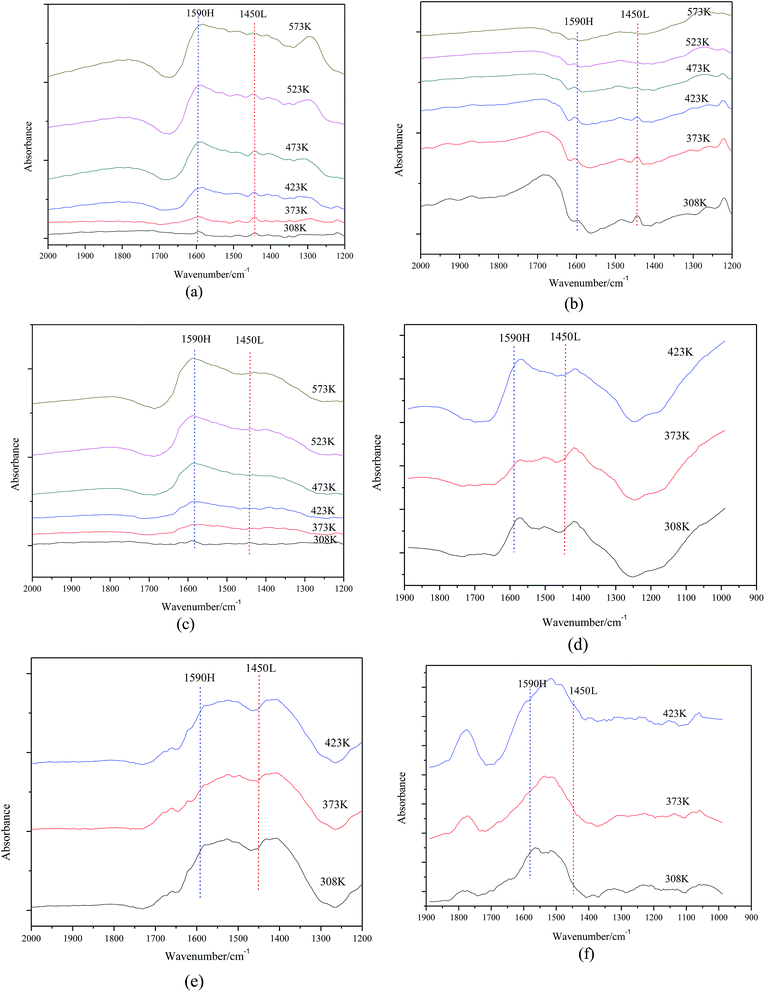 | ||
| Fig. 8 FTIR spectra of (a) Mg–Al-723 K (b) Mg–Al-773 K (c) Mg–Al-823 K (d) Mg–Al-873 K (e) Mg–Al-923 K (f) Mg–Al-973 K after pyridine adsorption. | ||
3.2 Catalytic test for ethanol conversion
The selectivity and product distribution of catalysts with different MgO contents are shown in Fig. 9(a). The results show that the reaction products were mainly BD, ethylene, ether, acetaldehyde, 1-butene and 1-butanol. The BD selectivity increases first, and then decreases with the increase of MgO content. However, there is no linear relationship between other products including ethylene, ether, acetaldehyde, 1-butene as well as 1-butanol and the MgO content.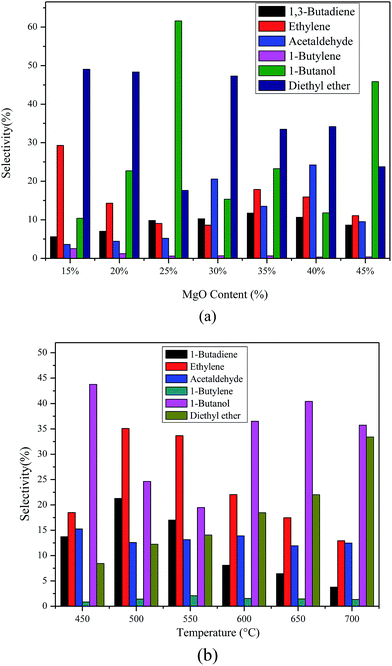 | ||
| Fig. 9 The selectivity and products distribution of catalysts with different MgO contents (a), different calcination temperatures (b). Reaction temperature 673 K, WHSV 1.8 h−1. | ||
Similarly, the selectivity and product distribution of catalysts with different calcination temperatures are shown in Fig. 9(b). The selectivity of both BD and ethylene increases firstly and then decreases as calcination temperature goes up. The selectivity of diethyl ether increases with the calcination temperature. Likewise, other products such as acetaldehyde, 1-butylene and 1-butanol change irregularly as the calcination temperature varies.
The possible reasons of the above mentioned results are that the acid–basic sites suitable for BD also increase firstly and then decrease with the increase the MgO content and calcination temperature, but the other acid or basic sites vary irregularly with the MgO content and calcination temperature based on our NH3-TPD and CO2-TPD studies. On the basis of results of IR spectroscopy of adsorbed pyridine, the Lewis acid sites are appropriate for BD formation.
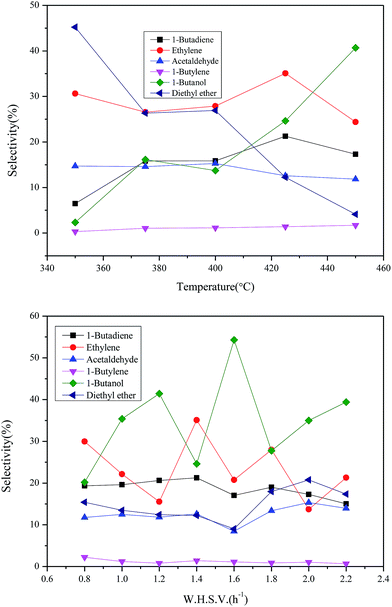
To investigate the influence of reaction conditions to bulk chemicals including reaction temperatures and the feed rate of ethanol, the following experiment was also carried out. The variation trend and specific data are summarized in Fig. 10. The suitable conditions for BD and ethylene: temperature 698 K and WHSV 1.4 h−1. The suitable conditions for 1-butanol: temperature 713 K and WHSV 1.6 h−1, and for higher reaction temperatures, the production of 1-butanol becomes much easier. The selectivity of both ethylene and 1-butanol fluctuates widely as the feed rate varies. However, the trends of products such as BD, acetaldehyde diethyl ether and 1-butylene become more moderate with the feed rate increasing. This may be due to the former is less demanding in terms of active sites while the latter has high requirement to the proper active sites.
4. Conclusions
Conversion ethanol to BD and other bulk chemicals over Mg–Al catalysts has been investigated. The reaction products were mainly BD, ethylene, ether, acetaldehyde, 1-butene and 1-butanol.The influence of MgO content has been systematic studied. The MgO content has a great impact on the catalyst structure and acid–basic properties. The BET surface areas gradually decreases as the MgO content increases from 15% to 45%. When MgO content is under 40%, MgO and Al2O3 components can be uniformly distributed in the catalyst so as to raise the activity of BD. There is no simple linear relationship between the acid as well as basic sites and MgO content. So the products selectivities based on acid, basic and acid–basic sites change irregularly.
The effect of calcination temperature on catalyst activity also has been analyzed. There are no pattern about BET surface areas as the calcination temperature increasing. Both the BET surface areas and the average pore diameters fluctuate within the scope of 165–185 m2 g−1 and 40–60 Å, respectively. The acid–basic sites suitable for BD also increase firstly and then decrease with the increase the calcination temperature, but the other acid or basic sites vary irregularly with calcination temperature based on our NH3-TPD and CO2-TPD studies. On the basis of results of IR spectroscopy of adsorbed pyridine, the Lewis acid sites are appropriate for BD formation.
35% Mg–Al catalysts calcined at 773 K show good performance for BD and ethylene when ethanol reacts at 698 K with the feed rate of 1.4 h−1. The suitable conditions for 1-butanol: temperature 713 K and feed rate 1.6 h−1, higher reaction temperatures, the production of 1-butanol is much easier. To further improve the product selectivity, modifiers adjusting the balance of acid–basic also need to be included in the Mg–Al catalysts.
References
- M. K. Jindal and M. K. Jha, RSC Adv., 2016, 6(48), 41772–41780 RSC.
- C. Angelici, B. M. Weckhuysen and P. C. A. Bruijnincx, ChemSusChem, 2013, 6(9), 1595–1614 CrossRef CAS PubMed.
- Y. Sun and J. Y. Cheng, Biotechnol. Bioeng., 2002, 83, 1–11 CAS.
- J. O. Alves, C. Zhuo, Y. A. Levendis and J. A. Tenório, Appl. Catal., B, 2011, 106, 433–444 CrossRef CAS.
- R. O. de Souza, L. S. Miranda and R. Luque, Green Chem., 2014, 16, 2386–2405 RSC.
- K. D. Maher and D. C. Bressler, Biotechnol. Bioeng., 2007, 98, 2351–2368 CAS.
- K. A. Gray, L. S. Zhao and M. Emptage, Curr. Opin. Chem. Biol., 2006, 10, 141–146 CrossRef CAS PubMed.
- P. Alvira, E. Tomas-Pejo, M. Ballesteros and M. J. Negro, Bioresour. Technol., 2010, 101(13), 4851–4861 CrossRef CAS PubMed.
- B. Hahn-Hagerdal, M. Galbe, M. F. Gorwa-Grauslund, G. Liden and G. Zacchi, Trends Biotechnol., 2006, 24, 549–556 CrossRef CAS PubMed.
- J. J. Bozell and G. R. Petersen, Green Chem., 2010, 12, 539–554 RSC.
- R. Bhatt, D. Shah, K. C. Patel and U. Trivedi, Biotechnol. Bioeng., 2008, 99, 4615–4620 CAS.
- A. Morschbacker, J. Macromol. Sci., Polym. Rev., 2009, 49(2), 79–84 CAS.
- R. Le Van Mao, P. Levesque, G. McLaughlin and L. H. Dao, Appl. Catal., 1987, 34, 163–179 CrossRef CAS.
- S. Ma, M. Sadakiyo, R. Luo, M. Heima, M. Yamauchi and P. J. Kenis, J. Power Sources, 2016, 301, 219–228 CrossRef CAS.
- H. B. Zasloff, US Pat. No. 4,134,926, U.S. Patent and Trademark Office, Washington, DC, 1979.
- K. N. T. Tseng, S. Lin, J. W. Kampf and N. K. Szymczak, Chem. Commun., 2016, 52(14), 2901–2904 RSC.
- W. C. White, Chem.-Biol. Interact., 2007, 166, 10–14 CrossRef CAS PubMed.
- W. M. Quattlebaum, W. J. Toussaint and J. T. Dunn, J. Am. Chem. Soc., 1947, 69, 593–599 CrossRef CAS.
- S. K. Bhattacharyya and N. D. Ganguly, J. Appl. Chem., 1962, 12, 105–110 CrossRef CAS.
- M. H. Zhang, M. X. Gao, J. Y. Chen and Y. Z. Yu, RSC Adv., 2015, 5(33), 25959–25966 RSC.
- S. Kvisle, A. Aguero and R. P. A. Sneeden, Appl. Catal., 1988, 43, 117–131 CrossRef CAS.
- V. V. Ordomsky, V. L. Sushkevich and I. I. Ivanova, J. Mol. Catal. A: Chem., 2010, 333, 85–93 CrossRef CAS.
- V. L. Sushkevich, I. I. Ivanova, V. V. Ordomsky and E. Taarning, ChemSusChem, 2014, 7, 2527–2536 CrossRef CAS PubMed.
- H.-J. Chae, T.-W. Kim, Y.-K. Moon, H.-K. Kim, K.-E. Jeong, C.-U. Kim and S. Y. Jeong, Appl. Catal., B, 2014, 150, 596–604 CrossRef.
- J. I. Di Cosimo, V. K. Dıez, M. Xu, E. Iglesia and C. R. Apesteguıa, J. Catal., 1998, 178, 99–510 CrossRef.
- K. K. Rao, M. Gravelle, J. S. Valente and F. Figueras, J. Catal., 1998, 173, 115–121 CrossRef CAS.
- K. Yamaguchi, K. Ebitani, T. Yoshida and K. Kaneda, J. Am. Chem. Soc., 1999, 121(18), 4526–4527 CrossRef CAS.
- L. Hora, V. Kelbichová, O. Kikhtyanin and O. Kubička, Catal. Today, 2014, 223, 138–147 CrossRef CAS.
- M. León, E. Díaz and S. Ordóñez, Catal. Today, 2011, 164, 436–442 CrossRef.
Footnote |
| † Electronic supplementary information (ESI) available. See DOI: 10.1039/c6ra27610e |
| This journal is © The Royal Society of Chemistry 2017 |

