 Open Access Article
Optimizing photovoltaic performance in CuInS2 and CdS quantum dot-sensitized solar cells by using an agar-based gel polymer electrolyte†
E. Raphael ab,
D. H. Jarab and
M. A. Schiavon
 *a
*a
aDepartment of Natural Science, Federal University of São João del-Rei – UFSJ, São João del-Rei, Minas Gerais 36301-160, Brazil. E-mail: schiavon@ufsj.edu.br
bRadiation Laboratory, Department of Chemistry and Biochemistry, University of Notre Dame, Notre Dame, Indiana 46556, USA
First published on 19th January 2017
Abstract
Quantum dot-sensitized solar cells (QDSSCs) offer new opportunities to address the clean energy challenge, being one of the top candidates for third generation photovoltaics. Like dye-sensitized solar cells (DSSCs), QDSSCs normally use liquid electrolytes that suffer from issues such as evaporation or leakage. In this study a gel polysulfide electrolyte was prepared containing a natural polymer, agar, and was used as a quasi-solid-state electrolyte in solar cells to replace the conventional liquid electrolytes. This gel electrolyte shows almost the same conductivity as the liquid one. The solar cells were fabricated using CuInS2 quantum dots (QDs), previously synthesized, deposited on TiO2 photoanodes by electrophoretic deposition (EPD). CdS was deposited on TiO2 by successive ionic layer adsorption and reaction (SILAR). Reduced graphene oxide (RGO)–Cu2S, brass, and thin film CuxS were used as counter electrodes. Compared to a liquid polysulfide water based electrolyte, solar cells based on CuInS2 and CdS using gel polymer electrolyte (GPE) exhibit greater incident photon to current conversion efficiency (IPCE = 51.7% at 520 nm and 72.7% at 440 nm), photocurrent density (Jsc = 10.75 and 13.51 mA cm−2), and power conversion efficiency (η = 2.97 and 2.98%) while exhibiting significantly enhanced stability. The solar cells employing the agar-based gel polymeric electrolyte are about a factor of 0.20 more stable than using a liquid electrolyte. The higher photovoltaic performance is due to the good conductivity and high wettability as well as the superior permeation capability of the gel electrolyte into the mesoporous matrix of a TiO2 film.
Introduction
The worldwide demand for energy is increasing. The production, storage and distribution of energy are necessities of industry and society, and because of limited fossil fuel reserves on the planet, reliable and alternative renewable energy sources are becoming increasingly important areas of interest.1 Quantum dot (QD)-sensitized solar cells (QDSSCs), as an alternative to dye-sensitized solar cells (DSSCs), have been of focus in research because of their efficient charge separation and transport,2 offering new opportunities to address the clean energy challenge.3,4 Quantum dots (QDs) are semiconductor nanocrystals in which quantum confinement occurs. They usually have diameters in the range of 2–10 nanometers and their size tunability drastically affects the optical and electronic properties, which in turn have a strong impact on their performance in devices such as photovoltaics.5,6 Different deposition techniques like: Chemical Bath Deposition (CBD), QD functionalization, Close Space Sublimation (CSS), Successive Ion Layer Adsorption and Reaction (SILAR), Metal Organic Chemical Vapor Deposition (MOCVD), Vapor Phase Epitaxy (VPE), and electrophoretic deposition (EPD) have been used to deposit the absorber layer onto mesoscopic oxide (e.g., TiO2) films.3,4,7 QDSSCs typically exhibit lower power conversion efficiency when comparable to DSSCs or thin film solar cells, however, their efficiency has considerably increased from 1% to over 8%. Factors that limit the overall power conversion efficiency is the limited harvesting of the incident light, slow hole transfer rate, back electron transfer to the redox couple, or low counter electrode performance.8–10 In order to improve the efficiency, it is necessary to explore new approaches to different aspects such as different electrolytes. In a conventional QDSSC the redox electrolyte is located between the working and counter electrodes and plays an important role in regenerating the semiconductor by scavenging photogenerated holes and determines the photovoltage of the liquid junction solar cells.11 Organic-solvent-based liquid electrolytes have been conventionally used, but due to the toxicity of several organic solvents, water-based electrolytes are being employed. The aqueous cells are environmentally friendly,12 but the efficiency and stability of the cells in an aqueous phase have been low.13 The liquid sulfide/polysulfide redox electrolyte has remained a preferred choice because it assists in delivering high open circuit voltage and stability of solar cell operation. The I−/I3− redox couple, traditionally used in DSSCs, is corrosive to QDs, causing a decrease in photocurrent.14 However, liquid electrolytes have a fundamental limitation for long-term operation due to their volatilization and leakage due to inadequate sealing of cells, possible desorption, and photodegradation of the sensitizer.12,15,16 Therefore, a development of new materials to replace traditional liquid electrolytes is essential. Polymer electrolytes are nowadays the focus of researches. One method to make these electrolytes is to alter the physical-chemistry properties of these polymeric materials by addition of plasticizers to obtain gel polymeric electrolytes (GPE). The plasticizer influences the thermal and mechanical properties and attains sufficient penetration of the polymer electrolyte into the porous photoelectrode.17,18 GPEs have recently received considerable attention because they can be prepared in a semisolid or solid form, they are cheap, acquire liquid-like conductivity (10−2 to 10−3 S cm−1), have superior mechanical properties and promise long-term stability.16,19,20 With these properties, GPEs can be applied in devices such as fuel cells, electrochromic devices, sensors, batteries and solar cells.21 However, a common feature related to most solar cells prepared with polymer electrolyte is the notable reduction in efficiency primarily due to the lower mobility of the ionic species through the solid or quasi-solid medium, or poor wetting of pores with the electrolyte. The conversion efficiencies with the gel polymer electrolytes typically is low, but even at low efficiencies, these cells have been viable alternatives to the generally liquid electrolyte used in DSSCs or QDSSCs due to improved stability and better sealing ability.16Recently, electrolytes based on organic/inorganic hybrid materials22 and biopolymer materials, such as chitosan,17 agar,23 carrageen,13 and gelatin24 have been proposed with high conductivity and carrageenan,13 chitosan,25 xanthan gum12 and agar-based systems15,21,26 have been successfully applied in DSSCs. In 1988 Khare, N. applied an agar based electrolyte with a ferrous/ferric cyanide redox couple in a CdS electrochemical cell that exhibited results comparable to the liquid electrolyte.27 Agarose has been successfully applied in DSSCs using polyiodine based electrolytes. However, in QDSSCs dextran,14 as gelator, and a natural polysaccharide konjac glucomannan28 as a polysulfide based hydrogel, have been developed. The obtained photovoltaic performance with liquid and polymer gel electrolytes were almost identical, the liquid being slightly higher, indicating that gelation has no adverse effect on the conversion efficiency. However, studies using agar with polysulfide electrolyte in QDSSCs still have not been reported.19,29 Biopolymers are also relatively cheap, biodegradable and renewable, and most of the bio-macromolecules can dissolve inorganic salts or acids, making it possible to use them in polymer electrolytes.17,30 Agar is one biopolymer material extracted from red seaweed. It is a mixture of two polysaccharides: agaropectin and agarose. Although both polymers share the same galactose-based backbone, agaropectin presents acidic side-groups such as sulfate and pyruvate, and agarose has a neutral charge. Fig. S1† illustrates the structure of agarose.30 Agarose shows the ability to form a mechanically strong gel with a small amount of agarose. It is possible to use as gelator to obtain a solid system, keeping the ionic conductivity of the liquid electrolyte almost unaffected and assist in wetting the electrodes. It is considered a good and environment-friendly polymer matrix because of their rich hydroxyl groups in molecule structure, generating complexing sites. The conduction process occurs through the exchange of ions between complexed sites.20,21,31
In the present paper, agar-based gel electrolytes were prepared and applied in CuInS2 and CdS QDSSCs. The counter electrodes such as reduced graphene oxide (RGO)–Cu2S, brass and thin film CuxS were tested with this agar-based gel electrolyte. Impedance spectroscopy measurements were performed in order to determine the ionic conductivity of the electrolyte. The photovoltaic performance including long-term stability was evaluated and discussed to highlight the best solar cell device.
Results and discussion
Synthesis and characterization of CuInS2 quantum dots and preparation of CdS semiconductor
Fig. 1 shows the absorption and photoluminescence spectra for the synthesized CuInS2 QDs. CuInS2 QDs synthesized in this study displays a broad absorption and emission feature and a large stokes shift indicating the presence of two optical transitions and defect-induced emission as reported previously.33 CuInS2 QDs were prepared using a slightly copper-deficient sample ([Cu]![[thin space (1/6-em)]](https://www.rsc.org/images/entities/char_2009.gif) :
:![[thin space (1/6-em)]](https://www.rsc.org/images/entities/char_2009.gif) [In] = 0.86 according to ICP) in order to obtain a higher photoluminescence quantum yield (Φ) as well as more absorption in the visible spectrum.33 The Φ obtained was 0.085. In our previous work we found that CuInS2 QDs with higher Φ exhibit better solar cell efficiency.6
[In] = 0.86 according to ICP) in order to obtain a higher photoluminescence quantum yield (Φ) as well as more absorption in the visible spectrum.33 The Φ obtained was 0.085. In our previous work we found that CuInS2 QDs with higher Φ exhibit better solar cell efficiency.6
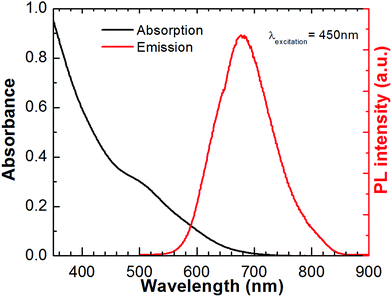 | ||
| Fig. 1 Absorption and emission spectra for CuInS2 QDs. Emission spectrum was recorded at 450 nm excitation wavelength in CHCl3 solution. | ||
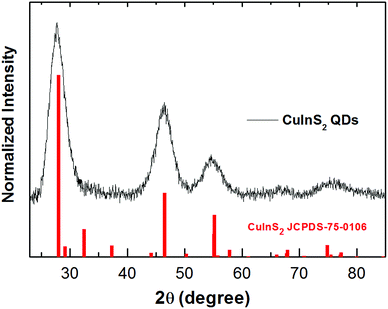
The shape and size of the CuInS2 QDs were determined by scanning transmission electron microscopy (STEM). STEM analysis revealed that CuInS2 QDs possess a pyramidal shape and size distribution of 2.9 ± 0.4 nm (Fig. 2A and B). The X-ray diffraction (XRD) patterns were scanned in the range of 20 to 85° as shown in Fig. 3. It shows five diffraction peaks at 28, 47, 55, 67 and 76° corresponding to indices (112), (204/220), (312), (400) and (316/322) lattice planes of a tetragonal chalcopyrite-like structure (JCPDS-75-0106).34–36 There is no evidence of other secondary phases.
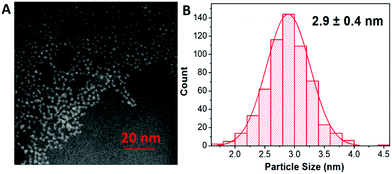 | ||
| Fig. 2 (A) STEM image of CuInS2 QDs showing the particles with pyramidal shape. (B) Size distribution of the particles with an average size of 2.9 nm. | ||
The deposition of CdS onto TiO2 electrodes was performed by SILAR method. The preparation of CdS by SILAR method has already been described in literature.37,38 It was used here for comparison purposes with this novel GPE electrolyte.
Preparation and characterization of agar-based polymer gel electrolyte
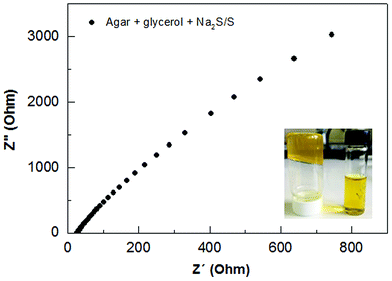
The preparation of agar-based gel electrolyte was made by dispersing 0.125 g of agar and 0.125 g of glycerol in 7.5 mL of water. This solution was constantly stirred and heated until boiling. The temperature was decreased to 60–70 °C, then 130 μL of formaldehyde was added while still stirring. Before application of the electrolyte in the QDSSCs, 2 mL of a 2 M Na2S/S solution was added under stirring for 10–20 min. The ionic conductivity of agar-based polymer gel electrolyte was evaluated by Impedance Electrochemical Spectroscopy (IES) using an Autolab PGSTAT 302N Potentiostate over frequency range 100 Hz to 1 MHz. Fig. 4 shows the impedance plots for the agar-based gel electrolyte at room temperature. The intersection of the imaginary axis with the real axis provides the electrolyte bulk resistance (Rb). The ionic conductivity is then deduced using the relationship: σ = l/(RbA), where (σ) is ionic conductivity, l is the thickness of the electrolyte and A is the contact area between the electrolyte and the electrode. There is no existing capacitance component; the agar-based gel electrolyte shows only a resistive component at low frequency ranges which corresponds to the mass transport through the gel.15 The agar-based electrolyte containing Na2S/S showed resistance 32.15 ohm, from which we can determine an optimal result of ionic conductivity = 1.81 × 10⁻³ S cm−1. This conductivity value can be compared to the conductivity value of liquid electrolyte (4.40 × 10⁻³ S cm−1) usually applied in solar cells,13 and being higher than previous results reported for an agar-based solid polymer electrolyte.23In order to evaluate the thermal stability of the agar, thermogravimetric analysis (TGA) was performed. Fig. S2† shows the thermogravimetric curves from pure agar in the form of powder, and processed in the form of a membrane prepared with agar, glycerol and formaldehyde. From these results a slight weight loss of around 10% is recorded up to 150 °C in both samples. This mass loss event can be explained as a vaporization of residual water always present in the sample.30,39 In the temperature range of 250–350 °C, an accentuated event reaching to 60% of mass loss occurs, which marks the degradation process of both samples. This degradation slowly continues as the temperature is increased to 800 °C with 10% of residue remaining. The processed sample (membrane) exhibits similar degradation to the plain agar, in which good thermal stability up to 250 °C can be highlighted. This thermal stability is suitable for application in solar cell preparation.
Photovoltaic performance of CdS and CuInS2-based solar cells
To evaluate the photovoltaic performance of CdS and CuInS2-based solar cells, different electrolytes and counter electrodes were used. The photoanode was prepared by first depositing a layer of 20 nm TiO2 nanoparticles (active layer) with an area of 0.20 cm2 on fluorine-doped tin oxide (FTO) followed by a layer of 400 nm TiO2 nanoparticles (scattering layer). It has been previously reported that the thickness of the active and scattering layer using doctor blade method is 11 ± 0.5 μm and 6 ± 0.5 μm, respectively.36 Then, the active layer of TiO2 was coated with CdS using SILAR method40 with ten cycles of deposition or CuInS2 QDs using an electrophoretic deposition (EPD) method. A DC voltage of 225 V cm−1 was applied between the TiO2 film electrode and a FTO electrode immersed in QD suspensions. Loading of the CuInS2 QDs onto mesoscopic TiO2 film was optimized by tracking the absorption spectrum of the TiO2/CuInS2 film versus the time of EPD. Fig. S3† exhibits the absorption spectra of maximum loaded CuInS2 photoanodes. These electrodes were subjected to two cycles of ZnS passivation layer using the SILAR method before assembling them in solar cells. A reduced graphene oxide (RGO)–Cu2S composite41 and CuxS/brass were used as the counter electrode for the CdS QDSSCs. The same reduced graphene oxide (RGO)–Cu2S composite and a thin film layer of CuxS42 (300 nm) were used as the counter electrode for the CuInS2 QDSSCs. A liquid electrolyte (LE) employing a Na2S/S solution and an agar-based gel polymer electrolyte (GPE) with Na2S/S, both using a concentration of 0.42 M Na2S/S.Photovoltaic performance of the QDSSCs were measured under AM 1.5G simulated solar irradiation. Fig. 5 compares the Open Circuit Voltage, J–V characteristics and photocurrent stability of the CuInS2 QDSSCs for the different electrolytes: liquid electrolyte (LE) or agar-based gel electrolyte (GPE) and different counter electrodes: graphene oxide (RGO)–Cu2S composite (Cu2S/RGO) or a thin film of CuxS. Two different counter electrodes were used for each photosensitizer (RGO and CuxS for CuInS2 QDs and RGO and Cu-brass for CdS QDs) in order to test the GPE in the most common counter electrodes used in QDSSCs. We found that all of them work perfectly well with GPE opening the possibility of using this quasi-solid electrolyte with any counter electrode. The highest photocurrent was obtained for GPE, exhibiting a maximum short-circuit current density (Jsc) of 10.75 ± 0.87 mA cm−2 using Cu2S/RGO as counter electrode and having an open-circuit voltage (Voc) of 0.584 ± 0.018 V (Fig. 5B). As a result, the power conversion efficiency (PCE (η)) was highest for the QDSSCs employing GPE of 2.97 and 2.45%, from Cu2S/RGO and CuxS counter electrode, respectively. It should be noted that the efficiencies for these cell using an agar based gel polymeric electrolyte are about factor of 0.3 and 0.07 higher than using a liquid electrolyte. Furthermore, we demonstrated that CuxS counter electrode may work as well as Cu2S/RGO.
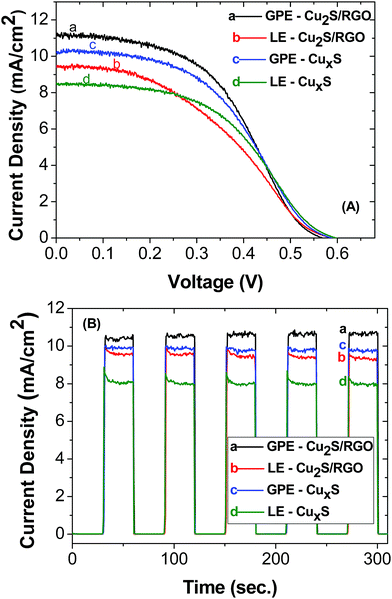 | ||
| Fig. 5 Current–voltage characteristic (A) and photocurrent stability (B) of CuInS2 QDSSCs. The electrolyte and counter electrode used in both experiments are shown in the inset. | ||
Fig. 6A compares the open circuit voltage, J–V characteristics and photocurrent stability of the CdS QDSSCs for the different electrolytes: liquid electrolyte (LE) or agar based gel electrolyte (GPE) and different counter electrodes: graphene oxide (RGO)–Cu2S composite (Cu2S/RGO) or brass (CuxS/brass). The highest photocurrent was obtained for GPE using Cu2S/RGO as counter electrode, exhibiting a maximum short-circuit current density (Jsc) of 13.51 ± 0.85 mA cm−2 and an open-circuit voltage (Voc) of 0.575 ± 0.003 V (Fig. 6B). As a result, the highest power conversion efficiency (PCE (η)) was 2.98 and 2.77% for the solar cells employing GPE with Cu2S/RGO and CuxS/brass counter electrode, respectively. It should be noted that the efficiencies for these cell using an agar-based gel polymeric electrolyte are about factor of 0.06 and 0.31 higher than using a liquid electrolyte. The solar cell parameters are summarized in Table 1.
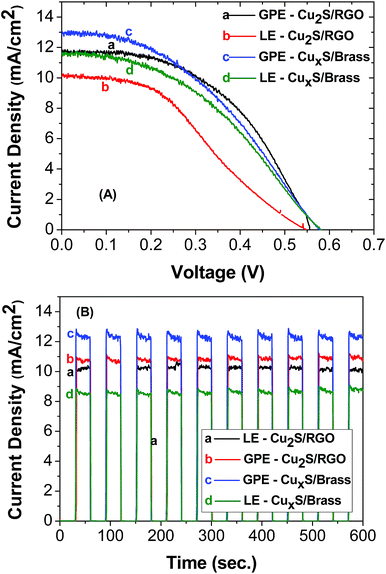 | ||
| Fig. 6 Current–voltage characteristic (A) and photocurrent stability (B) of CdS QDSSCs. The electrolyte and counter electrode used in both experiments are shown in the inset. | ||
| Sensitizer/CE | Electrolyte | Voc (V) | Jsc (mA cm−2) | FF | η (%) |
|---|---|---|---|---|---|
| a Results are tabulated and calculated for three tested cells. | |||||
| CuInS2/Cu2S–RGO | LE | 0.579 ± 0.018 | 8.91 ± 0.50 | 0.39 ± 0.05 | 2.06 ± 0.17 |
| CuInS2/Cu2S–RGO | GPE | 0.584 ± 0.018 | 10.75 ± 0.87 | 0.47 ± 0.06 | 2.97 ± 0.06 |
| CuInS2/CuxS | LE | 0.597 ± 0.003 | 8.40 ± 0.15 | 0.45 ± 0.01 | 2.28 ± 0.10 |
| CuInS2/CuxS | GPE | 0.577 ± 0.013 | 9.26 ± 0.88 | 0.46 ± 0.01 | 2.45 ± 0.27 |
| CdS/Cu2S–RGO | LE | 0.587 ± 0.008 | 10.95 ± 0.85 | 0.43 ± 0.04 | 2.80 ± 0.03 |
| CdS/Cu2S–RGO | GPE | 0.575 ± 0.003 | 13.51 ± 0.85 | 0.38 ± 0.01 | 2.98 ± 0.11 |
| CdS/CuxS-brass | LE | 0.506 ± 0.070 | 9.74 ± 0.80 | 0.41 ± 0.06 | 1.88 ± 0.21 |
| CdS/CuxS-brass | GPE | 0.553 ± 0.007 | 12.40 ± 0.98 | 0.41 ± 0.09 | 2.77 ± 0.39 |
The photovoltaic parameters of the QDSSCs with GPE were enhanced by the introduction of a polymer into the electrolyte. According to Table 1, which shows a summary of photovoltaic parameters for all cells, Voc is observed to be quite similar between solar cells using LE and GPE considering the error of the three solar cells tested for each sample. This observation is in agreement with the fact that both solar cells, LE and GPE, are using the same redox couple. The most relevant parameter affected by the electrolyte phase is Jsc, which is clearly higher for all samples containing GPE. This last factor is responsible for the enhancement of the photovoltaic efficiency. This polymer improves the dissociation of Na2S, by coordination of Na+ with the agar hydroxyl groups, resulting in an increase in S2−/Sn2− content in the electrolyte. A higher concentration of S2−/Sn2− will accelerate the regeneration of the oxidized quantum dot and the accumulated electrons in TiO2 via charge injection from excited quantum dot.20,43 Another factor is that a water based polysulfide electrolyte does not have a good permeation into TiO2 mesoporous film or a good contact between electrolyte and QDs, while with an agar the good permeation of gel electrolyte may contribute to the better photovoltaic performance.19,20 Higher PCE values were also obtained with agar as a solidified electrolyte in DSSCs.25 These promising results suggest new potential towards environmental friendly materials for new generation photovoltaics.
Incident photon-to-carrier conversion efficiency (IPCE) or external quantum efficiency (EQE) represents the percentage of incident photons that are converted to charge carriers and collected at the electrode surface. The IPCE spectra of CuInS2 QDSSCs is shown in Fig. 7A. The samples with the gel electrolyte exhibit greater incident photon to current conversion efficiency than the liquid electrolyte with a maximum IPCE of 52% at 520 nm. The IPCE spectra shown in the Fig. 7B for CdS with the same electrolytes exhibits greater incident photon to current conversion efficiency with a maximum IPCE of 71.7% at 440 nm. In both cases we can observe an improvement to the light absorption in the cells prepared with agar-based gel polymer electrolyte, as it exhibits better electron collecting and transport properties than the liquid electrolyte, which proved that the agar based gel electrolyte significantly improved the efficiency of the cell.
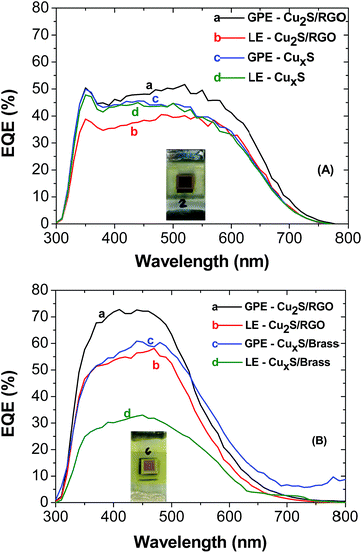 | ||
| Fig. 7 IPCE curves of CuInS2 QDSSCs (A) CdS QDSSCs (B). The electrolyte and counter electrode used in both samples are shown in the inset. | ||
Even though we obtained a lower photovoltaic efficiency than other QDSSCs devices, our results show preliminary and promising results using quasi-solid electrolytes. We believe that the solar cell efficiency may be increased by changing for example the long-chain capping ligand in CuInS2 QDs for shorter ligands as was demonstrated in a previous work.42 Shorter ligands help to increase the concentration of the dye in the mesoporous TiO2 and improve the electron transfer process between the photosensitizer and TiO2. Another strategy to improve the photovoltaic performance is using another counter electrode such as CoS–CuS hybrid structure, which has been shown to obtain higher photovoltaic performance than bare CoS or CuS.44
Stability after storage
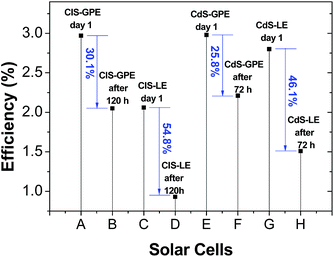
Fig. S4† compares the J–V curves and photocurrent stability of the solar cells employing CdS (being stored for 72 hours) and CuInS2 (being stored for 120 hours), both with RGO/Cu2S as counter electrode. Each cell was stored under dark at room temperature inside sealed plastic bottles. For both cells employing LE we can observe a decrease in the short-circuit current density (Jsc) about a factor of 0.25 and 0.28 (CdS and CIS respectively) after storage. For both cells employing GPE we can observe the best stability for the short-circuit current density (Jsc) decreasing about a factor of 0.20 and 0.09 after storage. From the results obtained, it is evident that the application of a gel polymer electrolyte in substitution of a conventional liquid electrolyte improves the device performance and shows a longer-term stability.Under such conditions, the water content in both electrolytes is expected to decrease due to evaporation. Indeed, the efficiency of the solar cells employing a liquid electrolyte (LE) decreases drastically by 55% (from 2.06% to 0.93%) after 120 hours in CuInS2 QDSSCs, and decreased about 46% (from 2.80% to 1.51%) after 72 hours in CdS QDSSCs. On the other hand, the solar cell efficiency employing GPE under the same conditions decrease in 30.1% (from 2.97% to 2.05%) and 25.8% (from 2.98% to 2.21%) for CuInS2 and CdS, respectively (Fig. 8).
The results indicate that the cells prepared using GPE enhanced long-term stability, which is an important requirement to practical application of liquid-junction solar cells, and still remains a challenge.45 The possible reasons for this result are that liquid electrolytes have several problems, such as leakage, volatilization of the solvent, and possible desorption of the attached sensitizers. Using agar as gelator in electrolyte has advantages such as higher power conversion efficiency and higher longevity of cell performance by mitigating the potential instability against solvent leakage and evaporation.15,21 This can be attributed to the strong affinity between polymer matrix and solvent.28 However we believe that polysulfide oxidation, QDs surface oxidation and its desorption from TiO2 in both cells results in photovoltaic performance small decrease in long-term, which still remains a challenge to obtain excellent stability.5,46 Table 2 summarizes the photovoltaic performance after storage.
| Sensitizer – hours | Electrolyte | Voc (V) | Jsc (mA cm−2) | FF | η (%) |
|---|---|---|---|---|---|
| a Results are tabulated and calculated for three tested cells. | |||||
| CuInS2 – 120 | LE | 0.545 ± 0.017 | 7.02 ± 0.23 | 0.25 ± 0.04 | 0.93 ± 0.11 |
| CuInS2 – 120 | GPE | 0.548 ± 0.020 | 9.74 ± 0.72 | 0.38 ± 0.03 | 2.05 ± 0.41 |
| CdS – 72 | LE | 0.463 ± 0.038 | 8.54 ± 1.79 | 0.38 ± 0.16 | 1.51 ± 0.20 |
| CdS – 72 | GPE | 0.559 ± 0.015 | 10.63 ± 2.89 | 0.45 ± 0.15 | 2.21 ± 0.09 |
Conclusions
An agar-based polymer gel electrolyte has been developed and successfully applied in CuInS2 and CdS QDSSCs. The solar cells were fabricated using CuInS2 quantum dots deposited on TiO2 photoanodes by electrophoretic deposition (EPD) and CdS semiconductor deposition on TiO2 photoanodes by ten cycles of successive ionic layer adsorption and reaction (SILAR) with reduced graphene oxide (RGO)–Cu2S and CuxS as counter electrodes.CuInS2 based QDSSCs with agar-based gel polymeric electrolyte exhibit IPCE (maximum IPCE = 51.7% at 520 nm), short circuit current (Jsc = 10.75 mA cm−2), power conversion efficiency (η = 2.97%). The CdS based QDSSCs with the same electrolyte exhibit greater incident photon to current conversion efficiency (maximum IPCE = 71.7% at 440 nm), short circuit current (Jsc = 13.91 mA cm−2), and power conversion efficiency (η = 2.98%).
The photovoltaic efficiency for the CdS solar cells employing GPE for Cu2S/RGO and CuxS/brass counter electrode are about a factor of 0.06 and 0.31 higher than using a liquid electrolyte, respectively. For the CIS solar cells employing GPE for Cu2S/RGO and CuxS counter electrode are about factor of 0.3 and 0.07 higher than using a liquid electrolyte, respectively. Such results are promising and suggest new potential material for solid/gel electrolytes in QDSSCs.
Both cells exhibited significantly enhanced stability, compared to the liquid electrolyte. These results indicate that the agar-based gel electrolyte exhibits almost the same conductivity as the liquid electrolyte. The electron transport was faster in the gel-electrolyte than the liquid one. Finally, since the gel network can create better sealing and avoid the leakage of solvent, this electrolyte has been identified as being a suitable material for practical photovoltaic devices.
Experimental
Materials
Copper(I) iodide (Alfa Aesar, puratronic, 99.998%), indium(III) acetate (Alfa Aesar, 99.99%), 1-dodecanethiol (Aldrich, ≤98%), toluene (Fisher Scientific, certified ACS grade), methanol (Fisher Scientific, certified ACS grade), chloroform (AMRESCO, biotechnology grade), TiCl4 (Alfa Aesar, puratronic, 99.0%) and agar (Sigma-Aldrich) were used without purification. FTO glass plates from Pilkington (TEC-7), TiO2 (Solaronix Ti Nanoxide T/SP, particle size ∼ 20 nm), TiO2 (CCIC, PST-400C, particle size ∼ 400 nm).Synthesis of CuInS2 quantum dots
CuInS2 (CIS) QDs were synthesized using a previously reported heating up method.32 In brief, 0.7 mmol of CuI and 1 mmol of In(Ac)3 were employed as precursors, and an excess of 1-dodecanethiol (1-DDT) was used as solvent, S donor, and capping ligand. Under vacuum, the reaction was heated for 30 min at 100 °C, and then the temperature was raised to 200 °C for 30 min. The as-synthesized CIS QDs were then washed by dispersing and precipitating the QDs with toluene and methanol, respectively. CIS QDs were stored in N2 purged toluene until further characterization.Quasi-solid electrolyte preparation
In order to prepare the quasi-solid electrolyte 0.125 g of agar (Aldrich®) and 0.125 g of glycerol (as a plasticizer), was dispersed in 7.5 mL of DI water and heated under magnetic stirring for a few minutes up to boiling to complete dissolution. Next, the solution was cooled down to 60 °C and 130 μL of formaldehyde (as a cross-linking agent) and 2 mL of a 2.0 M Na2S/S polysulfide solution were added to this solution under stirring.Photoanode preparation
Fluorine-doped tin oxide (FTO) glass plates from Pilkington (TEC-7) were cleaned in soap solution using an ultrasonic bath for 30 min and washed in ethanol for 15 min. Three layers of TiO2 were deposited on FTO: a blocking layer, an active layer, and a scattering layer. The blocking layer was deposited by immersing the plates in 40 mM TiCl4 aqueous solution at 70 °C for 30 min and washed with DI water and ethanol. The active TiO2 layer (Solaronix Ti Nanoxide T/SP, particle size ∼ 20 nm) was coated on top of the blocking layer by doctor blade technique. The film was dried at 80 °C for 1 h and then annealed at 400 °C, 450 °C and 500 °C for 15 min at each temperature. A scattering layer of TiO2 (CCIC, PST-400C, particle size ∼ 400 nm) was deposited on top of the active layer by doctor blade printing. The TiO2 electrodes were further dried at 80 °C and then annealed at 400 °C, 450 °C and 500 °C for 15 min each temperature. Finally, the electrodes were treated again with TiCl4 at 70 °C for 30 min and sintered at 500 °C for 30 min. The counter electrodes (CEs) were prepared by doctor blading Cu2S–RGO as reported earlier.41 CuxS counter electrodes were prepared by depositing a thin film (300 nm) of copper metal on a glass/FTO substrate, then it was immersed in a polysulfide solution (2 M Na2S/S) for 30 minutes.42 A brass electrode was prepared immersed in hydrochloric acid at 70 °C for 10 min, and then, the treated brass was dipped into polysulfide aqueous solution (2 M Na2S/S) for 5 min.47 The solar cells were fabricated by sandwiching the photoanode and counter electrodes using parafilm as spacer and a drop of redox electrolyte (0.42 M of S2−, 0.42 M of S in water, or dispersing 2 mL of a polysulfide solution, 2.0 M Na2S/S, in 7.5 mL of agar gel). The typical electrode area was 0.20 cm2 for regular solar cells and 0.5 cm2 for solar cells with no scattering layer. ImageJ software was used to determine the precise area of the electrodes.Electrophoretic deposition (EPD)
EPD was used to sensitize the FTO/TiO2 photoanodes with CuInS2. A TiO2 photoanode and a blank piece of FTO glass were immersed in a cuvette and kept at a distance of 0.4 cm. A dispersion of QDs in CHCl3 was added in the cuvette, and a bias voltage of 225 V cm−1 was applied between the TiO2 photoanode and FTO for different period of times to deposit the QDs onto the mesoporous TiO2 electrode, which was connected to the positive terminal of the power supply unit.Successive ionic layer adsorption and reaction (SILAR)
The deposition of CdS onto TiO2 electrodes was performed by SILAR method. A Cd(NO3)2 (0.1 M) solution in methanol and a Na2S (0.1 M) solution in methanol![[thin space (1/6-em)]](https://www.rsc.org/images/entities/char_2009.gif) :
:![[thin space (1/6-em)]](https://www.rsc.org/images/entities/char_2009.gif) water (1
water (1![[thin space (1/6-em)]](https://www.rsc.org/images/entities/char_2009.gif) :
:![[thin space (1/6-em)]](https://www.rsc.org/images/entities/char_2009.gif) 1) were used as cationic and anionic sources, respectively. Each cycle of SILAR consists of successive immersion of the TiO2 electrode in metal ion and sulfide anion solutions for 1 min and washing between each step. Ten cycles were applied for the CdS/TiO2 photoanodes.
1) were used as cationic and anionic sources, respectively. Each cycle of SILAR consists of successive immersion of the TiO2 electrode in metal ion and sulfide anion solutions for 1 min and washing between each step. Ten cycles were applied for the CdS/TiO2 photoanodes.
Two cycles of deposition of ZnS onto the CdS/TiO2 and CuInS2/TiO2 photoanodes were performed by SILAR method, in these cases a Zn(NO3)2 (0.1 M) solution in methanol and Na2S (0.1 M) in a mixture of methanol and water (1![[thin space (1/6-em)]](https://www.rsc.org/images/entities/char_2009.gif) :
:![[thin space (1/6-em)]](https://www.rsc.org/images/entities/char_2009.gif) 1) were used as cationic and anionic sources, respectively. Each cycle of SILAR consists of successive immersion of the TiO2 electrode in metal ion and sulfide anion solutions for 1 min and washing between each step.
1) were used as cationic and anionic sources, respectively. Each cycle of SILAR consists of successive immersion of the TiO2 electrode in metal ion and sulfide anion solutions for 1 min and washing between each step.
Material characterization
Acknowledgements
The authors thank Dr Prashant Kamat and DOE for providing the facilities and support. The research described herein was supported by the Division of Chemical Sciences, Geosciences, and Biosciences, Office of Basic Energy Sciences of the U.S. Department of Energy, through award DE-FC02-04ER15533. This is contribution number NDRL No. #5106 from the Notre Dame Radiation Laboratory. ER thanks CNPq (Ciência sem Fronteiras) for the Postdoctoral Fellowship (GDE 201293/2014-5). DHJ would like to thank to Comisión Nacional de Investigación Científica y Tecnológica (CONICYT) for the Becas Chile Scholarship, code 72110038.References
- P. V. Kamat, J. Phys. Chem. C, 2007, 111, 2834 CAS.
- L. Li, X. Yang, J. Gao, H. Tian, J. Zhao, A. Hagfeldt and L. Sun, J. Am. Chem. Soc., 2011, 133, 8458 CrossRef CAS PubMed.
- S. Rühle, M. Shalom and A. Zaban, ChemPhysChem, 2010, 11, 2290 CrossRef PubMed.
- P. V. Kamat, J. Phys. Chem. Lett., 2013, 4, 908 CrossRef CAS PubMed.
- D. A. Hines and P. V. Kamat, ACS Appl. Mater. Interfaces, 2014, 6, 3041 CAS.
- D. H. Jara, S. J. Yoon, K. G. Stamplecoskie and P. V. Kamat, Chem. Mater., 2014, 26, 7221 CrossRef CAS.
- R. Salazar, A. Delamoreanu, C. Levy-Clement and V. Ivanova, European Materials Research Society Conference Symposium: Advanced Inorganic Materials and Concepts for Photovoltaics, 2011, 10, DOI:10.1016/j.egypro.2011.10.164.
- M. R. Kim and D. Ma, J. Phys. Chem. Lett., 2015, 6, 85 CrossRef CAS PubMed.
- H. Choi, R. Nicolaescu, S. Paek, J. Ko and P. V. Kamat, ACS Nano, 2011, 5, 9238 CrossRef CAS PubMed.
- A. Polman, M. Knight, E. C. Garnett, B. Ehrler and W. C. Sinke, Science, 2016, 6283, 307 Search PubMed.
- P. V. Kamat, Acc. Chem. Res., 2012, 45, 1906 CrossRef CAS PubMed.
- S. J. Park, K. Yoo, J.-Y. Kim, J. Y. Kim, D.-K. Lee, B. Kim, H. Kim, J. H. Kim, J. Cho and M. J. Ko, ACS Nano, 2013, 7, 4050 CrossRef CAS PubMed.
- M. Kaneko, T. Hoshi, Y. Kaburagi and H. Ueno, J. Electroanal. Chem., 2014, 572, 21 CrossRef.
- H.-Y. Chen, L. Lin, X.-Y. Yu, K.-Q. Qiu, X.-Y. Lü, D.-B. Kuang and C.-Y. Su, Electrochim. Acta, 2013, 92, 117 CrossRef CAS.
- S. S. Alias and A. A. Mohamad, Ionics, 2013, 19, 1185 CrossRef CAS.
- O. A. Ileperuma, Mater. Technol., 2013, 28, 65 CrossRef CAS.
- A. Pawlicka, M. Danczuk, W. Wieczorek and E. Zygadlo-Monikowska, J. Phys. Chem. A, 2008, 112, 8888 CrossRef PubMed.
- Z. Seidalilir, R. Malekfar, H.-P. Wu, J.-W. Shiu and E. W.-G. Diau, ACS Appl. Mater. Interfaces, 2015, 7, 12731 Search PubMed.
- M. S. Su’ait, M. Y. A. Rahman and A. Ahmad, Sol. Energy, 2015, 115, 452 CrossRef.
- Y. Yang, H. Hu, C.-H. Zhou, S. Xu, B. Sebo and X.-Z. Zhao, J. Power Sources, 2011, 196, 2410 CrossRef CAS.
- R. Singh, N. A. Jadhav, S. Majumder, B. Bhattacharya and P. K. Singh, Carbohydr. Polym., 2013, 91, 682 CrossRef CAS PubMed.
- D. Sygkridou, A. Rapsomanikis and E. Stathatos, Sol. Energy Mater. Sol. Cells, 2017, 159, 600 CrossRef CAS.
- E. Raphael, C. O. Avellaneda, M. A. Aegerter, M. M. Silva and A. Pawlicka, Mol. Cryst. Liq. Cryst., 2012, 554, 264 CrossRef CAS.
- D. F. Vieira, C. O. Avellaneda and A. Pawlicka, Electrochim. Acta, 2007, 53, 1404 CrossRef CAS.
- S. A. Mohamad, R. Yahya, Z. A. Ibrahim and A. K. Arof, Sol. Energy Mater. Sol. Cells, 2007, 91, 1194 CrossRef CAS.
- M. Bidikoudi, D. Perganti, C. Karagianni and P. Falaras, Electrochim. Acta, 2015, 179, 228 CrossRef CAS.
- N. Khare, J. Power Sources, 1988, 24, 121 CrossRef CAS.
- S. Wang, Q.-X. Zhang, Y.-Z. Xu, D.-M. Li, Y.-H. Luo and Q.-B. Meng, J. Power Sources, 2013, 224, 152 CrossRef CAS.
- P. Wang, S. M. Zakeeruddin, J. E. Moser, M. K. Nazeeruddin, T. Sekiguchi and M. Gratzel, Nat. Mater., 2003, 2, 402 CrossRef CAS PubMed.
- E. Raphael, C. O. Avellaneda, B. Manzolli and A. Pawlicka, Electrochim. Acta, 2010, 55, 1455 CrossRef CAS.
- K. Suzuki, M. Yamaguchi, M. Kumagai, N. Tanabe and S. Yanagida, C. R. Chim., 2006, 9, 611 CrossRef CAS.
- L. Li, A. Pandey, D. J. Werder, B. P. Khanal, J. M. Pietryga and V. I. Klimov, J. Am. Chem. Soc., 2011, 133, 1176 CrossRef CAS PubMed.
- D. H. Jara, K. G. Stamplecoskie and P. V. Kamat, J. Phys. Chem. Lett., 2016, 7, 1452 CrossRef CAS PubMed.
- H. Z. Zhong, S. S. Lo, T. Mirkovic, Y. C. Li, Y. Q. Ding, Y. F. Li and G. D. Scholes, ACS Nano, 2010, 4, 5253 CrossRef CAS PubMed.
- L. Li, N. Coates and D. Moses, J. Am. Chem. Soc., 2010, 132, 22 CrossRef CAS PubMed.
- P. K. Santra, P. V. Nair, K. G. Thomas and P. V. Kamat, J. Phys. Chem. Lett., 2013, 4, 722 CrossRef CAS PubMed.
- Y. F. Nicolau, Appl. Surf. Sci., 1985, 22–3(5), 1061 CrossRef.
- M. A. Becker, J. G. Radich, B. A. Bunker and P. V. Kamat, J. Phys. Chem. Lett., 2014, 5, 1575 CrossRef CAS PubMed.
- G. O. Machado, R. E. Prud'homme and A. Pawlicka, e-Polym., 2007, 7, 1335 Search PubMed.
- D. R. Baker and P. V. Kamat, Adv. Funct. Mater., 2009, 19, 805 CrossRef CAS.
- J. G. Radich, R. Dwyer and P. V. Kamat, J. Phys. Chem. Lett., 2011, 2, 2453 CrossRef CAS.
- H. McDaniel, N. Fuke, N. S. Makarov, J. M. Pietryga and V. I. Klimov, Nat. Commun., 2013, 4, 2887 Search PubMed.
- D. Cahen, G. Hodes, M. Grätzel, J. F. Guillemoles and I. Riess, J. Phys. Chem. B, 2000, 104, 2053 CrossRef CAS.
- L. Givalou, M. Antoniadou, D. Perganti, M. Giannouri, C. S. Karagianni, A. G. Kontos and P. Falaras, Electrochim. Acta, 2016, 210, 630 CrossRef CAS.
- A. Hinsch, J. M. Kroon, R. Kern, I. Uhlendorf, J. Holzbock, A. Meyer and J. Ferber, Prog. Photovoltaics, 2001, 9, 425 CAS.
- H. K. Jun, M. A. Careem and A. K. Arof, Int. J. Photoenergy, 2013, 2013, 10 CrossRef.
- H. K. Jun, M. A. Careem and A. K. Arof, Nanoscale Res. Lett., 2014, 9(1), 1 CrossRef PubMed.
Footnote |
| † Electronic supplementary information (ESI) available. See DOI: 10.1039/c6ra27635k |
| This journal is © The Royal Society of Chemistry 2017 |

