 Open Access Article
Creative Commons Attribution 3.0 Unported Licence
Preparation of highly porous carbon through activation of NH4Cl induced hydrothermal microsphere derivation of glucose†
Chunyan Zhang ,
Shuang Lin,
Junjun Peng,
Yanzhong Hong,
Zhiyong Wang and
Xianbo Jin*
College of Chemistry and Molecular Sciences, Hubei Key Laboratory of Electrochemical Power Sources, Wuhan University, Wuhan, 430072, P. R. China. E-mail: xbjin@whu.edu.cn
First published on 19th January 2017
Abstract
There is considerable interest in the synthesis of activated carbons from biomass through hydrothermal carbonization (HTC) followed by activation. Here we report our findings that using NH4Cl additive for HTC of glucose changes the product from nanosphere carbon to N-doped microsphere carbon with a much lower surface area, but unexpectedly, the following KOH-activated N-doped microsphere carbon shows a significantly higher specific surface area (exceeding 3000 m2 g−1) than that (2385 m2 g−1) of activated conventional HTC carbon. Under similar conditions, other HTC additives, such as NaCl and HCl, can also lead to the formation of microsphere carbons with decreased surface area, but the specific surface area of the corresponding activated carbons decreased accordingly. These comparisons together with XPS and FTIR analyses suggest that the doped N in the HTC carbon play an important role on the formation of extra pores during the activation. Furthermore, the activated N-doped microsphere carbon delivers the highest specific capacity (349 F g−1) at a current density of 1 A g−1 in 6 mol L−1 KOH. Our findings promise an efficient route to the preparation of N-doped highly porous carbon with high capacitive performance.
1 Introduction
Activated carbons (ACs) have found a large number of applications in the environment and energy fields.1,2 Their extensive microporous structure and high specific surface areas (2000–3000 m2 g−1) make the ACs highly demanded by industry as adsorbents for water and air purification,3–6 and electrode materials for supercapacitors.7,8 The worldwide market of ACs is increasing by nearly 10% per year, and the global annual consumption will reach about 1.65 Mt in 2017.9 Developing simple processes for the preparation of high performance ACs is of great significance.ACs can be regarded as abundant in natural resources, because they can be derived from biomass through carbonization followed by activation. Hydrothermal carbonization (HTC) is a well-established route to convert biomass, including carbohydrates and lignocelluloses, to carbon materials.10–13 Particularly, HTC of monosaccharide (such as glucose14) and oligosaccharides (such as sucrose15) have been well studied. But just like high temperature carbonization processes,16 HTC generates carbons with very low specific surface areas. A following high temperature activation with H2O, CO2 or KOH is essential for the HTC carbons to be used as high performance absorbents or supercapacitor materials.17–20
Previously, many organic and inorganic additives for the HTC process have been studied, aiming at synthesis of HTC carbons with different morphologies and compositions. Some additives can decrease the specific surface area of the HTC carbons. For example, while HTC of glucose in water results in carbon nanopowders with particle sizes of about 200 nm,21,22 adding sodium borate into the HTC reactor could lead to finer carbon with particle sizes to about 50 nm.23 A further decrease of the particle size to about 10 nm HTC carbon has been realized by using ZnCl2 based additives mixtures,24 and the resulting HTC carbon has a relatively high specific surface area of about 650 m2 g−1. But most additives, on the contrary, tend to increase the particle size of the HTC carbon. For example, Na2SO4, NaCl, NaNO3 and some organic additives, such cysteine and its derivatives, all would increase the particle size of the glucose derived HTC carbon from 100–200 nm to several micrometers.22,25,26 These observations have led to many interesting processes for the synthesis of carbon microspheres with or without doping of heteroatoms, however, to our best knowledge, the influences of HTC additives on the following high temperature activation process have not yet been reported.
In this work, we report that HTC of glucose with NH4Cl additive followed by KOH-activation can lead to N-doped activated carbon with significantly enhanced specific surface area, despite the fact that the NH4Cl additive will decrease the surface area of the HTC carbon as a result of formation of carbon microspheres. The difference between HTC with and without the NH4Cl additive can be schematically shown in Scheme 1, where after activation, the NH4Cl will lead to a more porous structure and N-doping of the activated carbon is indicated. The resulting activated carbon has a specific surface area exceeding 3000 m2 g−1, and can deliver a specific capacity as high as 349 F g−1 at a current density of 1 A g−1 in 6 mol L−1 KOH.
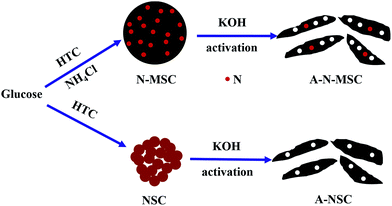 | ||
| Scheme 1 Schematically shown the hydrothermal carbonization and activation process of glucose with and without the NH4Cl additive. | ||
2 Experimental section
2.1 Preparation of nanosphere carbon (NSC) and microsphere carbons (MSCs) through HTC
All chemical reagents in this work were of analytical purity and purchased from Sinopharm Chemical Reagent Company. High-purity deionized water (18.5 MΩ cm) was prepared by water purifier (Chengdu Pincheng Technology Co, Ltd.). Typically, 4 g glucose, a certain amount of NH4Cl and 30 mL H2O were added into a hydrothermal autoclave of 50 mL capacity, which was maintained at 190 °C for 5 h, and then cooled to room temperature naturally. After filtration and washing with absolute ethanol and deionized water several times (until the filtrate becomes clear), the solid product was collected and vacuum dried at 70 °C overnight. Without using NH4Cl, the product is nanosphere carbon and denoted as NSC. The product of HTC with 2 g and 8 g NH4Cl are microsphere carbons and denoted as N-MSC1 and N-MSC2 respectively. Using 0.15 mol HCl and 0.15 mol NaCl additives for the HTC of glucose also led to the generation of microsphere carbons, which are denoted as H-MSC and Na-MSC respectively.2.2 Activation of the HTC carbons
The HTC carbons were impregnated with KOH with an alkali to carbon ratio of 3. After vacuum-dried at 75 °C overnight, the mixtures were heated (heating rate 10 °C min−1) to 800 °C and maintained for 2 h under Ar flow. The resulting activated carbons were washed with 1 M HCl solution and double-distilled water, and dried overnight for characterization. The activated NSC, N-MSC1, N-MSC2, H-MSC and Na-MSC are denoted as A-NSC, A-N-MSC1, A-N-MSC2, A-H-MSC and A-Na-MSC respectively.2.3 Characterizations
The structure and morphology of the samples were characterized by scanning electron microscopy (SEM, FEI Quanta 200), and high-resolution transmission electron microscopy (HRTEM, JEOL-2100), respectively. X-Ray photoelectron spectroscopy (XPS) analysis was carried out with a Thermo Fisher ESCALAB 250xi Ultra spectrometer with an Al Kα excitation source. Fourier-transform IR (FTIR) spectra of the samples were recorded using a Nicolet-MEXUS 670 Spectrophotometer. The pore structure of the samples was analysed by using a Micromeritics ASAP 2020 Analyzer (Norcross, GA) with nitrogen adsorption. The specific surface area was calculated using the Brunauer–Emmett–Teller (BET) method. Raman characterization was carried out using a RM-1000 Laser Confocal Raman Microspectroscopy (Renishaw, England) employing a 514.5 nm laser beam. Powder X-ray diffraction (XRD, Shimadzu XRD-6000 Cu Kα radiation) patterns were recorded between scattering angles (2θ) of 10–80°at a scanning rate of 4° min−1.2.4 Electrochemical measurements
The test electrodes were the nickel foam supported rolled membranes (dried in a vacuum oven at 110 °C before use) comprising 70 wt% active material and 15 wt% acetylene black plus 15 wt% polytetrafluoroethylene (PTFE). The mass load of the active material in an electrode was about 2.4 mg cm−2. Cyclic voltammetry, galvanostatic charge–discharge curves in a 6 M KOH solution were recorded using a CHI660a potentiostat. For all electrochemical tests, a graphite plate and a Hg/HgO electrode were employed as the counter electrode and the reference electrode respectively, and degassing of the electrolyte was conducted by bubbling Ar for 15 min before each test.3 Results and discussion
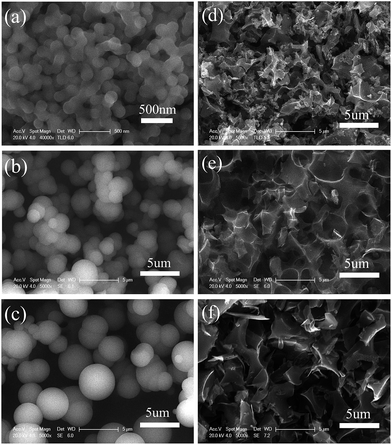
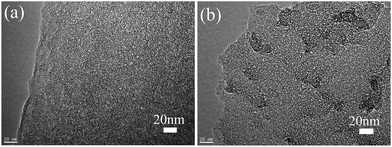
As shown in Fig. 1a, HTC of glucose without using any additive gave rise to nanosphere carbon (NSC) with particle sizes of about 200 nm. This sizes significantly increased to 2–3 μm (Fig. 1b) when 2 g NH4Cl was added into the HTC reactor, and further increased to 4–5 μm (Fig. 1c) when 8 g NH4Cl was added. The two microsphere carbons (MSCs) are denoted as N-MSC1 (2 g NH4Cl) and N-MSC2 (8 g NH4Cl) respectively. Apart from the great particle size difference between the MSCs and the NSC, the MSCs are black while the NSC presents a brown colour, suggesting that NH4Cl can catalyse the dehydration carbonization of glucose, like other inorganic additives.22,25 The catalytic role of NH4Cl can also be evidenced by the oxygen contents in the N-MSCs, which were much lower than that in the NSC (Table S1†). On the other hand, as an electrolyte, the NH4Cl might also induce flocculation and coagulation of carbonization products, leading to larger particle size of the HTC carbons.Considering that the as obtained HTC carbons usually are low in specific surface area,26 to obtain high surface area carbons, activation with KOH was performed at 800 °C, and the activated NSC, N-MSC1 and N-MSC2 are denoted as A-NSC, A-N-MSC1 and A-N-MSC2 respectively. The SEM images of these activated carbons are presented in Fig. 1 as well. It can be seen that after the activation, the spherical particles of the as obtained HTC carbons changed into many irregular carbon fragments. TEM images of the activated samples as exampled in Fig. 2 all indicate that there are plenty of micropores throughout the carbon fragments. In addition, XRD patterns (Fig. S1†) reveal these activated HTC carbons are in an amorphous feature, hence it can be concluded that activated carbons have been obtained after the KOH activation.
Fig. 3 shows the nitrogen adsorption–desorption isotherms of NSC, N-MSC1 and N-MSC2 before and after the activation. The NSC has a low specific surface area (11 m2 g−1), in line with previous reports.26 The N-MSC1 and N-MSC2 exhibit much lower specific surface areas, 0.93 and 0.19 m2 g−1 respectively, obviously due to the larger particle size of the N-MSCs. As expected, all the activated HTC carbons have large specific surface areas according to BET tests. However, the specific surface areas of the A-N-MSC2 (3003 m2 g−1) and A-N-MSC1 (2795 m2 g−1) are significantly larger than that of A-NSC (2385 m2 g−1), although by intuition, the surface area of A-NSC, from the NSC precursor originally with a much higher surface area, was supposed to be higher than that of A-N-MSCs. Moreover, considering that the specific surface area of A-N-MSC2 is higher than that of A-N-MSC1, it seems that the NH4Cl additive for HTC of glucose played an important role in the pore generation during the activation. At the same time, microsphere carbons, namely H-MSC and Na-MSC have also been prepared by HTC of glucose at the presence of HCl and NaCl, respectively, and they both comprise carbon spheres with particle sizes similar to that of N-MSCs (Fig. S2†). However, after activation with KOH, the specific surface area of the activated H-MSC (A-H-MSC, 1789 m2 g−1) and Na-MSC (A-Na-MSC, 1630 m2 g−1) (Fig. S3†) are both significantly lower than that of A-NSC, agreeing with the intuition that the smaller the particle size of carbon precursor, the higher specific surface area of the activated resultant. In addition, the N2 sorption behaviour of activated samples were more or less between type I and type II, which feature a mixture of high N2 uptake at P/P0 < 0.05 with continually increasing absorption at higher P/P0 (0.05–0.5) for developed mesopores (Fig. 3). The detailed analysis indicates that the increased surface area of A-N-MSC2 over A-NSC is mainly arising from the mesopores 2–5 nm in sizes (Table S2 and Fig. S3b†), which would be in favor of electrolyte accessibility compared to the micropores surface area.
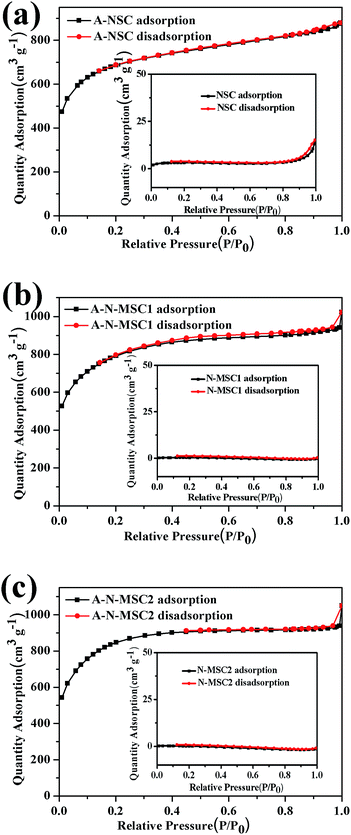 | ||
| Fig. 3 BET N2 gas sorption isotherms of different HTC carbons before and after the KOH activation as indicated. | ||
To identify the role of NH4Cl additive in the whole process, X-ray photoelectron spectroscopy (XPS) analyses were carried out, with the elemental analysis listed in Table S1.† As shown in Fig. 4a, besides signal of C, the XPS survey spectrum of NSC shows an apparent signal of O with a content of about 22.3% (atomic ratio, the same below), which decreased significantly to about 7.1% in the N-MSC1 and 5.8% in N-MSC2, confirming the catalytic effect of NH4Cl on the HTC of glucose. Obviously, NH4Cl additive has led to the N doping of the HTC carbon, because the N-MSCs showed XPS signal of N but no signal of Cl. The N doping levels were about 2.8 at% and 4.2 at% in the N-MSC1 and N-MSC2 respectively. The high resolution N 1s spectra (Fig. 4b and c) indicate that the N species include pyridinic-N (398.5 eV), NH2–N (399.4 eV), pyrrolic-N (400.1 eV) and graphitic-N (401 eV) respectively.27–29 The C 1s spectra (Fig. S4†) also confirm the formation of C–N bonds in the N-MSCs,30 and the more NH4Cl added for the HTC, the more C–N bonds in the resulting carbon.
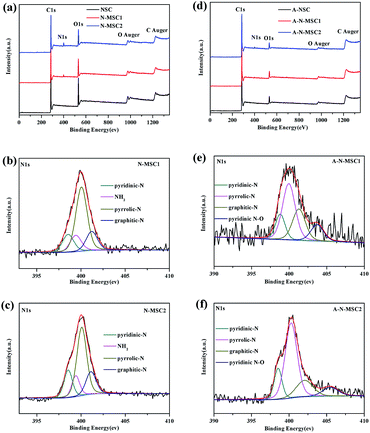 | ||
| Fig. 4 XPS spectra of the HTC carbons before (a) and after (d) KOH activation at 800 °C. (b), (c), (e) and (f) display the corresponding high resolution N 1s peaks. | ||
It is thus speculated that the high specific surface area of A-N-MSCs over that of A-NSC is due to the existence of doped N atoms in the N-MSCs, which caused extra pores during the activation. A possible explanation is that those nitrogenous groups are chemically more active than pristine carbon atoms, so there are more sites to be activated in the N doped HTC carbon. This can be evidenced by the XPS analyses. From Fig. 4a and d, it can be estimated that the N to C ratios in N-MSC1 and N-MSC2 are 0.035 and 0.053, and in A-N-MSC1 and A-N-MSC2 0.01 and 0.018 respectively, indicating that in comparison with pristine carbon sites, a larger percentage of N sites decomposed during the KOH activation. In detail, after the activation it can be seen that the NH2–N signal disappeared and the contents of all the other three kinds of N, namely, pyridinic-N, pyrrolic-N, graphitic-N decreased significantly. These changes could also been evidenced by the FTIR spectra (Fig. S5†). For the N-MSCs, there is an apparent absorption band between 3000–3400 cm−1, which can be linked to stretching vibrations of NH2 and NH groups, and the corresponding bending mode of NH2 occurs at 799 cm−1.31–33 There are also a series absorption peaks centred at 1620, 1382, 1250 and 1045 cm−1 respectively, which can be assigned to the stretching vibrations of C![[double bond, length as m-dash]](https://www.rsc.org/images/entities/char_e001.gif) N bonds and the aromatic C–N bonds.33 However, all these absorptions disappear or can be hardly recognized in the FTIR spectra of the A-N-MSCs when compared to the spectrum of A-NSC, indicating that most of N atoms were removed during the KOH activation.
N bonds and the aromatic C–N bonds.33 However, all these absorptions disappear or can be hardly recognized in the FTIR spectra of the A-N-MSCs when compared to the spectrum of A-NSC, indicating that most of N atoms were removed during the KOH activation.
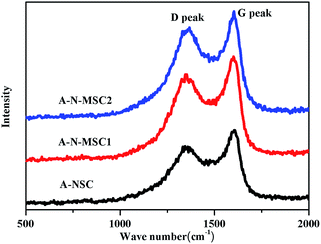
The removal of nitrogenous groups could result in extra defects in the AC. As shown in Fig. 5, the Raman spectra of A-NSC, A-N-MSC1 and A-N-MSC2 all display a D peak (signal of the defect- or disorder-induced scattering) at 1355 cm−1 and a G peak (signal of the vibration of sp2-bonded carbon atoms) at 1595 cm−1.34 The intensity ratio of D peak to G peak (ID/IG) is an indicator of structural disorder in carbon materials, and the larger the ID/IG value, the more defects in a carbon. The ID/IG values for the A-NSC, A-N-MSC1 and A-N-MSC2 were calculated to be 0.80, 0.84, and 0.86 respectively, suggesting there are more disorders and defects in the A-N-MSC2, which is in line with the fact that the A-N-MSC2 is most rich in pores according to the BET analysis (Fig. 3).
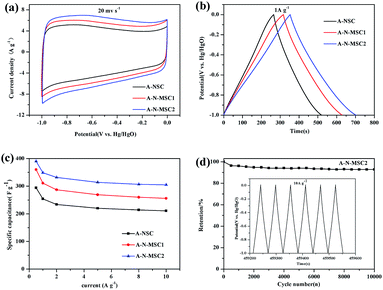
The A-N-MSCs with a surface area exceeding 3000 m2 g−1 could be high performance electrode materials for supercapacitors,35–40 because the abundant micropores, mesopores and defects in the carbon may benefit the electrolyte transfer and exposure of reactive sites. In addition, there are about 1.7% N doping in the A-N-MSC2, among which the pyridinic-N, and pyrrolic-N could increase the pseudo-capacitance, and the graphitic-N could enhance the electronic conductivity.29 Fig. 6a compares the cyclic voltammograms (CVs) of A-NSC, A-N-MSC1 and A-N-MSC2 at a scan rate of 20 mV s−1 in 6 M KOH. All the CVs show a rectangular-like shape, at the same time, the corresponding galvanostatic charge/discharge curves (Fig. 6b) between −1 V and 0 V (vs. the Hg/HgO reference electrode) at a current density of 1 A g−1, exhibit a nearly triangular shape, indicating excellent capacitive behaviour. Obviously, the specific capacitances of the A-N-MSCs are much higher than that of A-NSC. The higher specific capacitance of A-N-MSC2 than A-N-MSC1 can be ascribed to the higher specific surface area and nitrogen content in the A-N-MSC2.
The rate performances of the three samples are compared in Fig. 6c. In line with previous reports, at current densities of 0.5 A g−1, 1 A g−1 and 10 A g−1, the A-NSC activated from the glucose derived carbon by HTC without NH4Cl additive shows a specific capacitance of 294, 254, 211 F g−1 respectively.41 The A-N-MSC2 is superior over the A-N-MSC1 and A-NSC at all the tested current densities for the charge/discharge, which delivers a specific capacitance of 390, 349 and 305 F g−1 at current densities of 0.5 A g−1, 1 A g−1 and 10 A g−1 respectively, manifesting a significantly better supercapacitor performance than that of A-NSC.
The long-term cycling stability of A-N-MSC2 was also tested using galvanostatic charge/discharge at 10 A g−1 (Fig. 6d). The initial capacitance of A-N-MSC2 is about 305 F g−1, which keeps fairly stable over the 10![[thin space (1/6-em)]](https://www.rsc.org/images/entities/char_2009.gif) 000 cycles with a coulombic efficiency of about 100%. The capacitance at 10000th cycle is about 283 F g−1, corresponding to a capacity retention of 92.8% with respect to the first discharge capacity, revealing an excellent cycling performance. The high specific capacitance, high rate performance and cycling stability of the A-N-MSC2 suggesting that hydrothermal carbonization of glucose with NH4Cl additive followed by KOH activation is an efficient route to produce high performance capacitive carbon.
000 cycles with a coulombic efficiency of about 100%. The capacitance at 10000th cycle is about 283 F g−1, corresponding to a capacity retention of 92.8% with respect to the first discharge capacity, revealing an excellent cycling performance. The high specific capacitance, high rate performance and cycling stability of the A-N-MSC2 suggesting that hydrothermal carbonization of glucose with NH4Cl additive followed by KOH activation is an efficient route to produce high performance capacitive carbon.
4 Conclusions
In summary, we demonstrated a simple route to convert glucose to highly porous nitrogen-doped carbons: hydrothermal carbonization at the presence of NH4Cl, followed by KOH activation at 800 °C. It was found that the NH4Cl additive can catalyse the hydrothermal carbonization of glucose and change the product form nanosphere carbon (NSC, ∼200 nm in particle size) to nitrogen doped microsphere carbons (N-MSC, several micrometers in particle size), but after the following activation, the A-N-MSC shows a specific surface area (exceeding 3000 m2 g−1) greatly higher than that of A-NSC (2385 m2 g−1). The extra pores and/or defects generated in the A-N-MSC can be ascribed to the chemical etching of nitrogenous groups. The feed ratio between the NH4Cl and glucose for the hydrothermal carbonization has an important influence on the surface area and N-doping level of the A-N-MCS. In 6 M KOH, the A-N-MSC can deliver a specific capacitance of 349 and 311 F g−1 in 6 M KOH at 1 A g−1, significantly higher than 254 F g−1 of the A-NSC. The A-N-MSC also shows high rate performance and high cycling stability. Our findings promise an efficient route to prepare highly porous N-doped carbon with high capacitive performance.Acknowledgements
This work is supported by NSFC (21173161, 21673164) and the Large-scale Instrument and Equipment Sharing Foundation of Wuhan University.References
- M. Jordá-Beneyto, D. Lozano-Castelló, F. Suárez-García, D. Cazorla-Amorós and Á. Linares-Solano, Microporous Mesoporous Mater., 2008, 112, 235–242 CrossRef.
- M. Zyzlila Figueroa-Torres, A. Robau-Sánchez, L. De la Torre-Sáenz and A. Aguilar-Elguézabal, Microporous Mesoporous Mater., 2007, 98, 89–93 CrossRef CAS.
- C. P. Huang and M. H. Wu, Water Res., 1977, 11, 673–679 CrossRef CAS.
- M. Goyal, V. K. Rattan, D. Aggarwal and R. C. Bansal, Colloids Surf., A, 2001, 190, 229–238 CrossRef CAS.
- A. Perrin, A. Celzard, J. F. Marêché and G. Furdin, Carbon, 2004, 42, 1249–1256 CrossRef CAS.
- F. Rodríguez-Reinoso, Y. Nakagawa, J. Silvestre-Albero, J. M. Juárez-Galán and M. Molina-Sabio, Microporous Mesoporous Mater., 2008, 115, 603–608 CrossRef.
- Q.-Y. Li, H.-Q. Wang, Q.-F. Dai, J.-H. Yang and Y.-L. Zhong, Solid State Ionics, 2008, 179, 269–273 CrossRef CAS.
- P. Guo, Y. Gu, Z. Lei, Y. Cui and X. S. Zhao, Microporous Mesoporous Mater., 2012, 156, 176–180 CrossRef CAS.
- Roskill Report, http://www.roskill.com/reports/industrial-minerals/activated-carbon, 2008, accessed 26 August, 2016.
- M. M. Titirici, A. Thomas and M. Antonietti, Adv. Funct. Mater., 2007, 17, 1010–1018 CrossRef CAS.
- C. Falco, F. Perez Caballero, F. Babonneau, C. Gervais, G. Laurent, M.-M. Titirici and N. Baccile, Langmuir, 2011, 27, 14460–14471 CrossRef CAS PubMed.
- C. Falco, J. M. Sieben, N. Brun, M. Sevilla, T. van der Mauelen, E. Morallon, D. Cazorla-Amoros and M. M. Titirici, ChemSusChem, 2013, 6, 374–382 CrossRef CAS PubMed.
- N. Baccile, G. Laurent, F. Babonneau, F. Fayon, M.-M. Titirici and M. Antonietti, J. Phys. Chem. C, 2009, 113, 9644–9654 CAS.
- B. M. Kabyemela, T. Adschiri, R. M. Malaluan and K. Arai, Ind. Eng. Chem. Res., 1999, 38, 2888–2895 CrossRef CAS.
- M. Sevilla and A. B. Fuertes, Chem.–Eur. J., 2009, 15, 4195–4203 CrossRef CAS PubMed.
- L. Wei and G. Yushin, Nano Energy, 2012, 1, 552–565 CrossRef CAS.
- M. J. Munoz-Guillena, M. J. Illan-Gomez, J. M. Martin-Martinez, A. Linares-Solano and C. Salinas-Martinez de Lecea, Energy Fuels, 1992, 6, 9–15 CrossRef CAS.
- J. Alcanizmonge, D. Cazorlaamoros, A. Linaressolano, S. Yoshida and A. Oya, Carbon, 1994, 32, 1277–1283 CrossRef CAS.
- D. Lozano-Castelló, M. A. Lillo-Ródenas, D. Cazorla-Amorós and A. Linares-Solano, Carbon, 2001, 39, 741–749 CrossRef.
- Y. Zhu, S. Murali, M. D. Stoller, K. J. Ganesh, W. Cai, P. J. Ferreira, A. Pirkle, R. M. Wallace, K. A. Cychosz, M. Thommes, D. Su, E. A. Stach and R. S. Ruoff, Science, 2011, 332, 1537–1541 CrossRef CAS PubMed.
- M.-M. Titirici, M. Antonietti and N. Baccile, Green Chem., 2008, 10, 1204–1212 RSC.
- J. Ming, Y. Wu, G. Liang, J.-B. Park, F. Zhao and Y.-K. Sun, Green Chem., 2013, 15, 2722–2726 RSC.
- T.-P. Fellinger, R. J. White, M.-M. Titirici and M. Antonietti, Adv. Funct. Mater., 2012, 22, 3254–3260 CrossRef CAS.
- N. Fechler, S.-A. Wohlgemuth, P. Jäker and M. Antonietti, J. Mater. Chem. A, 2013, 1, 9418–9421 CAS.
- K. Latham, G. Jambu, S. Joseph and S. Donne, ACS Sustainable Chem. Eng., 2014, 2, 755–764 CrossRef CAS.
- S.-A. Wohlgemuth, F. Vilela, M.-M. Titirici and M. Antonietti, Green Chem., 2012, 14, 741–749 RSC.
- J. R. Pels, F. Kapteijn, J. A. Moulijn, Q. Zhu and K. M. Thomas, Carbon, 1995, 33, 1641–1653 CrossRef CAS.
- H. Wang, T. Maiyalagan and X. Wang, ACS Catal., 2012, 2, 781–794 CrossRef CAS.
- L. Sun, L. Wang, C. Tian, T. Tan, Y. Xie, K. Shi, M. Li and H. Fu, RSC Adv., 2012, 2, 4498–4506 RSC.
- Z.-H. Sheng, L. Shao, J.-J. Chen, W.-J. Bao, F.-B. Wang and X.-H. Xia, ACS Nano, 2011, 5, 4350–4358 CrossRef CAS PubMed.
- T. Ramanathan, F. T. Fisher, R. S. Ruoff and L. C. Brinson, Chem. Mater., 2005, 17, 1290–1295 CrossRef CAS.
- S. Hwang, S. Lee and J.-S. Yu, Appl. Surf. Sci., 2007, 253, 5656–5659 CrossRef CAS.
- D. Zhang, Y. Hao, Y. Ma and H. Feng, Appl. Surf. Sci., 2012, 258, 2510–2514 CrossRef CAS.
- P. K. Chu and L. Li, Mater. Chem. Phys., 2006, 96, 253–277 CrossRef CAS.
- D. Hulicova, J. Yamashita, Y. Soneda, H. Hatori and M. Kodama, Chem. Mater., 2005, 17, 1241–1247 CrossRef CAS.
- B. Xu, S. Hou, G. Cao, F. Wu and Y. Yang, J. Mater. Chem., 2012, 22, 19088–19093 RSC.
- B. Xu, H. Duan, M. Chu, G. Cao and Y. Yang, J. Mater. Chem. A, 2013, 1, 4565–4570 CAS.
- X. Wu, L. Jiang, C. Long and Z. Fan, Nano Energy, 2015, 13, 527–536 CrossRef CAS.
- C. Long, J. Zhuang, Y. Xiao, M. Zheng, H. Hu, H. Dong, B. Lei, H. Zhang and Y. Liu, J. Power Sources, 2016, 310, 145–153 CrossRef CAS.
- F. Sun, J. Gao, Y. Yang, Y. Zhu, L. Wang, X. Pi, X. Liu, Z. Qu, S. Wu and Y. Qin, Carbon, 2016, 109, 747–754 CrossRef CAS.
- D. Yuan, J. Chen, J. Zeng and S. Tan, Electrochem. Commun., 2008, 10, 1067–1070 CrossRef CAS.
Footnote |
| † Electronic supplementary information (ESI) available. See DOI: 10.1039/c6ra26141h |
| This journal is © The Royal Society of Chemistry 2017 |

