 Open Access Article
Nanotextured alpha Ni(II)–Co(II) hydroxides as supercapacitive active phases†
Nicolás Arencibiaa,
Víctor Oestreichera,
Federico A. Viva*b and
Matías Jobbágy *ac
*ac
aINQUIMAE-DQIAQF, Facultad de Ciencias Exactas y Naturales, Universidad de Buenos Aires, Ciudad Universitaria, Pab. II, C1428EHA, Buenos Aires, Argentina. E-mail: jobbag@qi.fcen.uba.ar
bDepartamento de Física de la Materia Condensada, Centro Atómico Constituyentes, Comisión Nacional de Energía Atómica, Av. General Paz 1499, B1650KNA, Buenos Aires, Argentina. E-mail: viva@tandar.cnea.gov.ar
cCentro Interdisciplinario de Nanociencia y Nanotecnología, Argentina
First published on 17th January 2017
Abstract
A family of monophasic nanoplatelets of Ni(II)–Co(II) layered hydroxides, were obtained by a one-pot room temperature homogeneous alkalinization driven by the the epoxide route with glycidol. Both cations precipitate in the form of solid solutions, giving the general formula Ni1−xCox(OH)2−yCly·nH2O. Co(II)-rich samples developed the simonkolleite-like alpha structure in which cations can adopt either octahedral (Oh) or tetrahedral (Td) environments, according to the formula (Ni,Co)Oh1−xCoTd2x(OH)2−2x(Cl)2x·nH2O. Ni(II)-rich ones resulted in ill-crystallized turbostratic (Ni,Co)1−x(OH)2−x(Cl)x·nH2O. Despite the inherent differences in the crystallochemical nature of theses phases, electrochemical measurements depict a monotonous behavior in terms of their capacitance. An optimum performance was observed for samples with XNi(II) = 0.83 under most of the experimental conditions explored. This sample reaches a maximum specific capacitance of 2091 F g−1, registered at a discharge current density of 0.5 A g−1, while an energy density of 80.7 W h kg−1 was recorded at a power density of 960.4 W kg−1.
Introduction
The development of advanced platforms for energy production and storage is a permanent source of inspiration for those scientists devoted to chemistry of applied nanomaterials. Among the various electrochemical-based power sources, electrochemical capacitors (EC), also known as supercapacitors, are a competitive alternative due to their advantages in energy storage applications, such as high power densities and long cyclic lifetime. In particular, water based supercapacitors present high safety and low price besides being environmentally friendly.1,2 Typically, these devices are based on the assembly of electroactive phases, able to develop faradic processes, dispersed at the nanoscale within suitable conductive substrates.1,3–6 Among the accepted electroactive phases,7 multicationic transition metal oxides8 or hydroxides9 play a key role in the race for efficiency in aqueous-based supercapacitors.10–14 Binary Ni(II)–Co(II) compounds15 were recently explored with special attention focused on hydroxilated phases.16–18 The homogeneous alkalinization driven by the controlled thermal hydrolysis of hexamethylenetetramine (HMT),18 formamide19 or urea20,21 succeeded in the preparation of monophasic layered hydroxides, including Ni(II)–Co(II) phases.21–26 However, these hydrothermal procedures, favor recrystallization process, with the subsequent loss of desirable metastable reactive phases.18 Eventually, molecular spacers can be added to develop reactive architectures.27,28 More recently it was demonstrated that several M(II) as well as M(II)–Al(III) LDH's can be obtained through chloride assisted epoxide's ring opening in aqueous solutions at 298 K, a mild method inherently free of carbonated or oxidized side-products.29 The present study explores the one pot preparation of monophasic Ni(II)–Co(II) hydroxides obeying to the general formula Ni1−xCox(OH)2−yCly·nH2O and their crystalline nature. The electrochemical behavior is systematically explored along the whole range of Ni(II) to Co(II) ratio, finding a well-defined optimum capacity.Results and discussion
Room-temperature homogeneous precipitation of several M(II) hydroxilated phases, including Ni(II) or Co(II) ones, can be driven by epoxide ring opening. It was reported that several epoxides are reactive enough to drive this reaction, however glycidol was chosen instead of the commonly employed propylene oxide30–34 due to is higher boiling point, that makes it easy to handle at room temperature, preventing losses due to evaporation and subsequent harmful inhalations.35 Fig. 1 presents the precipitation pH profiles of bare Co(II) or Ni(II) solutions (labeled as samples Ni0 and Ni100, respectively) as well as a solution containing an equimolar mixture of Co(II) and Ni(II), labeled as sample Ni50. The precipitation of sample Ni0 results in a pH plateau fixed at value of 8.2; sample Ni100 develop an analogous profile, except for an initial smooth pH overshoot reaching a value of 8.5 indicating a single massive nucleation event followed by a precipitation plateau fixed at pH = 8.4.36 The equimolar mixture of Co(II) and Ni(II), labeled Ni50, depicts a precipitation plateau fixed at pH = 8.1. The lower value recorded respect to bare Ni(II) or Co(II) solutions (samples Ni100 and Ni0, respectively) indicates the coprecipitation of both cations in a less soluble binary phase.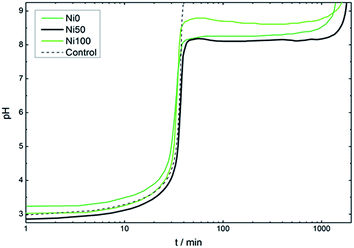 | ||
| Fig. 1 Evolution of pH along the precipitation of samples Ni0, Ni50 and Ni100. Dotted line indicates the control alkalinization curve in the absence of Ni(II) or Co(II) cations. | ||
SEM images of the obtained solids are shown in Fig. 2, revealing textural differences depending on the composition. Starting from sample Ni0, rose-like aggregates of well developed hexagonal platelets can be observed with no signs of amorphous material (see ESI Fig. S1†). The high aspect ratio observed in each hexagonal crystalline domains results from the fast growth along the xy plane respect to the c direction.29 The rose-like morphology obeys to the growth mechanism from a central seed depicted for related layered phases.37 Increasing Ni(II) contents resulted in smaller aggregates composed of particles with less defined geometries; Ni(II)-rich samples resulted in spheroidal aggregates of corrugated flakes with no sharp corners (see ESI Fig. S1†).
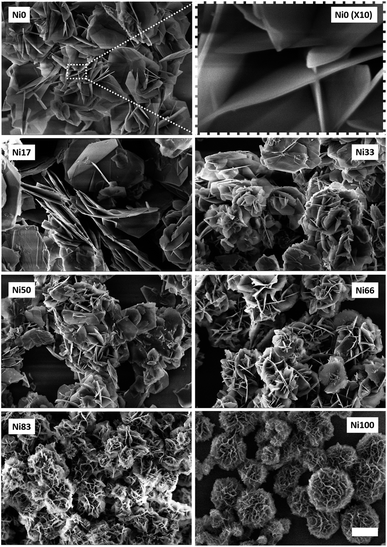 | ||
| Fig. 2 FESEM images of Ni0 to Ni100 samples. Scale bar represents 2 μm for all images except the inset (upper row). | ||
The PXRD patterns recorded for all samples are depicted in Fig. 3, revealing a layered nature, irrespective of composition or texture. Samples Ni0 to Ni66 adopted the simonkolleite-like structure,38 evidenced by the characteristic reflections recorded between 30 and 65 degrees.39 This phase, depicted by the general formula CoOh1−xCoTd2x(OH)2−2x(Cl)2x·0.46H2O, holds a main fraction of octahedral Co(II) centers, CoOh, belonging to an hexagonal cationic arrange. Certain CoOh positions within each layer are vacant and these sites are occupied by a couple of tetrahedral Co(II) centers, CoTd, positioned externally from the brucitic layer.39 The typical green color of this phase obeys to the contribution of the inherent transitions of Co(II) centers present in four-fold and six-fold coordination environments. In contrast with the Zn(II)-based mineral simonkolleite,38 that is defined by the precise formula ZnOh0.75ZnTd0.5(OH)1.5Cl·nH2O, the fraction of tetrahedral positions depends on the preparation method and is still a matter of discussion.40 However, the composition obtained under the present method is fully coincident with reports dealing with more energetic aging conditions.41 Ni(II)-rich samples resemble to bare Ni(II) end member also known as alpha hydroxide; this phase consists of a turbostratic lamellar hexagonal lattice obeying to the formula Ni(OH)2−x(A)x·nH2O, where A− represents an exchangeable anion,36 with Ni(II) centers located in octahedral environment, exclusively.42–44 This layered compound has the ability to exchange anions as related layered double hydroxides, despite the absence of trivalent cations in the structure.45 This ill-crystallized phase typically depicts broad interlamellar reflection due to the small thickness along the c direction and the inherent deformation of the nanoflakes.
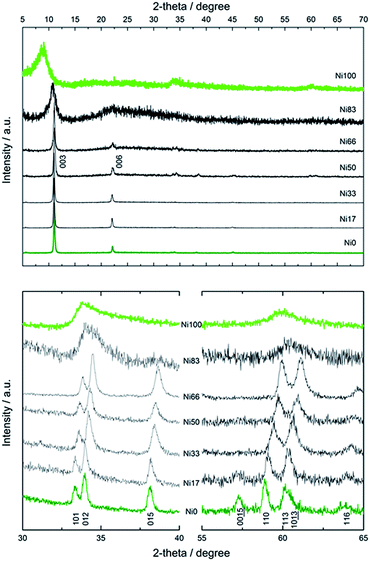 | ||
| Fig. 3 Wide range PXRD patterns of Ni0 to Ni100 samples (upper panel) and detail of intralamellar reflections (lower panel). | ||
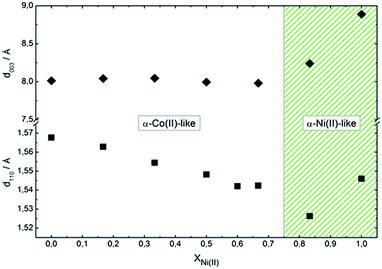
Fig. 4 presents the dependence of interlamellar distance c/3, deduced from 003 and 006 reflections as well as intralamellar cation to cation distance a, proportional to the 110 plane. For both end members, Ni0 and Ni100, the observed parameters are coincident with the chloride containing alpha forms reported before.39 In the case of sample Ni0, the replacement of CoOh positions by pairs of CoTd, results in a net contraction of the a parameter of 0.02 Å respect to the characteristic a value of pure brucitic or beta Co(OH)2. The contraction of sample Ni100 respect to reference beta Ni(OH)2 is in good agreement with previous reports.46 In the composition range in which the mixed phase adopts the simonkolleite-like structure, the interlamellar distance remains invariant while the cation to cation average distance contracts with increasing Ni(II) contents, confirming the inclusion of Ni(II) ions within the structure.46 Then, the structure observed for samples Ni0 to Ni66 can be described as a simonkolleite-like alpha structure according to the (Ni,Co)Oh1−xCoTd2x(OH)2−2x(Cl)2·nH2O formula.47 On the other side of the phase diagram, samples Ni83 and Ni100 resulted in ill-crystallized turbostratic alpha phase (Ni,Co)Oh1−x(OH)2−x(Cl)x·nH2O.
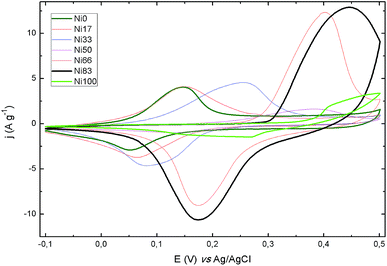
Electrochemical performance of all samples was evaluated by means of cyclic voltammetry (CV) and galvanostatic charge–discharge (CD) measurements, at increasing potential sweeping rates and specific currents, respectively. The CV curves show the expected peaks for the redox reaction of Ni(II) and Co(II) in the potential window resulting in the pseudocapacitance behavior of the faradic processes. Samples were cycled at 50 mV s−1 until reproducible voltammograms were obtained. A stable response was reached after up to 15 cycles, depending on the Ni content of the samples. Fig. 5 shows the CV recorded for the all samples at a sweep rate of 2 mV s−1; the complete set of CV plots are presented in Fig. S2.† The peaks observed for the binary samples lay between the potentials registered for the Ni0 and Ni100 end members. From sample Ni66 to Ni83 there is a change in the peaks shape, clearly noticeable in the forward scan. Moreover, for the bare Ni(II) sample, the presence of a pair of peaks can be discerned suggesting the occurrence of two redox processes for this sample, in agreement with recent findings.48 It is accepted that Ni(II) hydroxide evolves to Ni(III) oxohydroxide in a single electron conversion. Then, the complex signal observed suggest the coexistence of alpha and beta forms of Ni(II) hydroxide;49 steps are being taken in order to elucidate the origin of the observed peaks. In the CD plots (see ESI Fig. S3†), the pseudocapacitance behavior due to the electrochemical adsorption–desorption or surface redox reaction is represented by the non-linear discharge curves.
The specific capacitance (Cs) obtained from the CV and CD for the various composition at the different experimental conditions are presented as 3D plots in Fig. 6. Both techniques find a maximum Cs value in sample Ni83; CD reflects a Cs maximum value of 2100 ± 20 F g−1 for this sample. Related brucitic Ni0.8Co0.2(OH)2 solid solutions revealed a similar Cs value to Ni83, however once the discharge current density was increased to 8 A g−1, this value decreased to a half.50 Sample Ni83 retains 90% of Cs as the specific discharged current is increased up to 16 A g−1. Higher rates displace the optimum value to sample Ni66 with a marked decrease of Cs to 1500 F g−1 (Fig. 6, top graph). In contrast with this robust behavior, CV determinations reflect a lower Cs maximum value of 1500 F g−1 followed by a continuous decay and a shift towards Ni33 sample when the sweep rate increases (Fig. 6, bottom graph). Interestingly, Co(II) rich compositions maintains the Cs with the sweep rate, suggesting that these samples presents less kinetic hindrances for the redox-mediated phase transitions than their Ni(II) rich counterparts. The optimum performance recorded lie among the best values reported for related phases.51
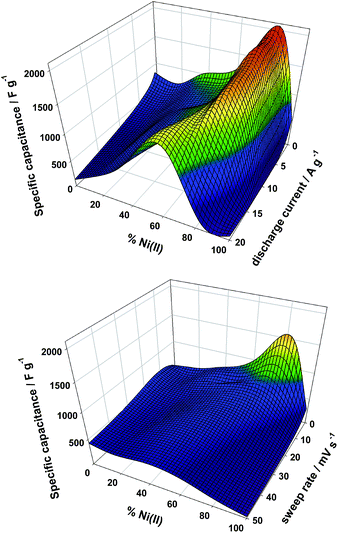 | ||
| Fig. 6 3D plot of specific capacitance as a function of composition obtained from CD plots (top graph) and CV plots (bottom graph). | ||
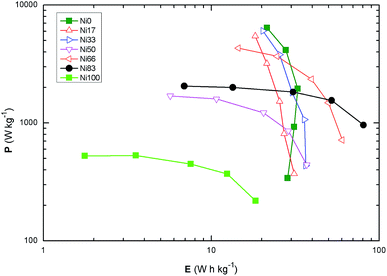
Fig. 7 shows the Ragone plot for all the samples at the various scan rates recorded; the values of E and P are in the expected region for the supercapacitors. The maximum specific energy is observed for sample Ni83 with 80.7 ± 0.8 W h kg−1 at specific power of 960 ± 9 W kg−1 followed by the composition Ni66 with a specific energy of 60.2 ± 0.6 W h kg−1 at a specific power of 717 ± 7 W kg−1. Cobalt-rich samples present a narrow range in specific energy while the compositions rich in Ni(II) show a narrow range in specific power. The samples around equimolar compositions (Ni33–66) stand intermediate of the aforementioned behaviors indicating that for those compositions there must be a change in the surface structure leading to the results of specific capacitance.
Conclusions
Epoxide's route allows the quantitative coprecipitation of layered monophasic Co(II)–Ni(II) hydroxides in the whole range of compositions, without the occurrence of undesired beta phases. Due to the absence of hydrothermal ripening, pristine born micrometric crystalline platelets preserve their nanometric thickness, along the c direction, ensuring a proper reactivity. Despite the layered crystalline structure of the obtained samples, two different phases can result, depending on the Co(II) to Ni(II) ratio. A simonkolleite-like structure, characterized by the coexistence of Oh and Td environments prevails for XNi(II) ≤ 0.66. For XNi(II) equal or higher than 0.83, a layered turbostratic phase is obtained. Beyond this structural differences, a continuous electrochemical performance is observed, finding an optimum value for samples with XNi(II) = 0.83. The high values recorded suggest that the parent micrometric particles are able to massively convert along the redox cycles, reaching the performance of complex nanotextured related systems. Marked differences were observed for the maximum specific capacitances recorded, depending on the evaluation method and/or protocol employed.51 This fact warns about the necessity of a wide range screening, in order to properly characterize this key electrochemical parameter.Experimental
Synthesis
Typically, precipitations were driven by aging for 48 h at 298 K 100 cm3 of filtered solutions containing NaCl (80 mM), a chloride salt of Co(II), Ni(II), or a combination of the aforementioned divalent cations (keeping a total cationic concentration of 10 mM) in the presence of glycidol (800 mM). All reagents were purchased from Sigma-Aldrich and employed without further purification. The precipitated solids were collected by centrifugation, washed three times with cold water, and dried at room temperature.Precipitation pH profiles
Representative precipitation curves were obtained by in situ potentiometric pH measurement in a reactor at 298 K under permanent stir constantly purged with N2, in order to prevent atmospheric CO2 uptake.Characterization of solids
All synthesized solids were characterized by powder X-ray diffraction (PXRD) using a graphite-filtered Cu Kα radiation (λ = 1.5406 Å), field emission scanning electron microscopy (FESEM), equipped with energy dispersive X-ray spectroscopy (EDS) probe. The content of cations, chloride and water were assessed by ICP, ionic chromatography and elemental analysis, respectively.Electrochemical characterization
The electrochemical properties of the obtained alpha hydroxides based electrodes were assessed in a three-electrode cell configuration at 25 °C. The hydroxides were deposited over the working electrode (WE), consisting of a graphite disk (5 mm in diameter). A mixture of the hydroxides (80%) with acetylene black (Cabot) (10%) and PVDF (Sigma Aldrich, powder) (10%) in N-methyl-2-pyrrolidone (Sigma Aldrich, anhydrous 99.5%), was prepared, deposited over the electrode and dried under vacuum until constant weight. Cyclic voltammetry (CV) and galvanostatic charge–discharge (CD) measurements, were performed with an Autolab PGSTAT302N (Metrohm, Netherlands) in 1 M KOH aqueous solution employing a Ag/AgCl electrode as reference electrode (RE) and a coiled Pt wire (150 × 0.5 mm, Vega y Camji, 99.9%) as a counter electrode (CE). CV were performed between −0.1 V to 0.5 V vs. Ag/AgCl at sweeping rates of 2 mV s−1 to 50 mV s−1 while the CD were performed in a potential window of 0.0 V to 0.45 V vs. Ag/AgCl at specific currents ranging from 0.5 A g−1 to 20 A g−1. The specific capacitance (Cs/F g−1) of the nanoparticles were calculated from the CV and the CD curves. From the CV, by the formula Cs = Q/(ΔV × m) where Q (C) is the charge, ΔV (V) is the potential window employed and m (g) the mass of the active material on the electrode. The capacitance was calculated as a half of the charge integer of the whole voltammogram. The capacitance from the CD curves was calculated by the formula: Cs = I × Δt/(ΔV × m), where I (A) is the discharge current, Δt (s) is the discharge time, ΔV (V) is the potential change during the discharge (excluding the IR drop) and m is again the mass of the active materials on the electrode.The energy and power densities of the electrodes were calculated from the CVs. At the various sweep rates by the equations: E = 0.5 × Cs × V2 and Pave = E × t−1, where E (J g−1) is the energy density, V (V) is the potential window, Cs (F g−1) the specific capacitance, Pave (J s−1 g−1) is the average power density, and t (s) is time corresponding to the potential window.7 E and P were converted to W h kg−1 and W kg−1, respectively.
Acknowledgements
This work was supported by the University of Buenos Aires (UBACyT 20020130100610BA), the Agencia Nacional de Promoción Científica y Tecnológica (ANPCyT PICT 2012-1167), the National Research Council of Argentina (CONICET PIP 11220110101020). NA acknowledges UBA for the undergraduate fellowship; VO acknowledges CONICET for doctoral fellowship and ALN for technical assistance. FAV and MJ are Research Scientists of CONICET (Argentina).References
- E. Umeshbabu, G. Rajeshkhanna and G. R. Rao, Int. J. Hydrogen Energy, 2014, 39, 15627–15638 CrossRef CAS.
- L. Demarconnay, E. Raymundo-Piñero and F. Béguin, Electrochem. Commun., 2010, 12, 1275–1278 CrossRef CAS.
- J. R. Miller and P. Simon, Science, 2008, 321, 651–652 CrossRef CAS PubMed.
- P. Simon and Y. Gogotsi, Nat. Mater., 2008, 7, 845–854 CrossRef CAS PubMed.
- S. Liu, S. Sun and X.-Z. You, Nanoscale, 2014, 6, 2037–2045 RSC.
- L. Cao, F. Xu, Y. Y. Liang and H. L. Li, Adv. Mater., 2004, 16, 1853–1857 CrossRef CAS.
- G. Wang, L. Zhang and J. Zhang, Chem. Soc. Rev., 2012, 41, 797–828 RSC.
- W. Deng, X. Ji, Q. Chen and C. E. Banks, RSC Adv., 2011, 1, 1171–1178 RSC.
- J. P. Cheng, J. Zhang and F. Liu, RSC Adv., 2014, 4, 38893–38917 RSC.
- F. Wang, S. Xiao, Y. Hou, C. Hu, L. Liu and Y. Wu, RSC Adv., 2013, 3, 13059–13084 RSC.
- R. R. Salunkhe, S. H. Hsu, K. C. W. Wu and Y. Yamauchi, Chemsuschem, 2014, 7, 1551–1556 CrossRef CAS PubMed.
- H. S. Huang, K. H. Chang, N. Suzuki, Y. Yamauchi, C. C. Hu and K. C. W. Wu, Small, 2013, 9, 2520–2526 CrossRef CAS PubMed.
- B. P. Bastakoti, H. Oveisi, C. C. Hu, K. C. W. Wu, N. Suzuki, K. Takai, Y. Kamachi, M. Imura and Y. Yamauchi, Eur. J. Inorg. Chem., 2013, 1109–1112 CrossRef CAS.
- W. Chaikittisilp, M. Hu, H. J. Wang, H. S. Huang, T. Fujita, K. C. W. Wu, L. C. Chen, Y. Yamauchi and K. Ariga, Chem. Commun., 2012, 48, 7259–7261 RSC.
- B. P. Bastakoti, Y. Kamachi, H. S. Huang, L. C. Chen, K. C. W. Wu and Y. Yamauchi, Eur. J. Inorg. Chem., 2013, 39–43 CrossRef CAS.
- V. Gupta, S. Gupta and N. Miura, J. Power Sources, 2008, 175, 680–685 CrossRef CAS.
- J. Han, K. C. Roh, M. R. Jo and Y.-M. Kang, Chem. Commun., 2013, 49, 7067–7069 RSC.
- H. Chen, L. Hu, M. Chen, Y. Yan and L. Wu, Adv. Funct. Mater., 2014, 24, 934–942 CrossRef CAS.
- G. V. Manohara, D. A. Kunz, P. V. Kamath, W. Milius and J. Breu, Langmuir, 2010, 26, 15586–15591 CrossRef CAS PubMed.
- H. Cai, A. C. Hillier, K. R. Franklin, C. C. Nunn and M. D. Ward, Science, 1994, 266, 1551–1555 CAS.
- U. Costantino, F. Marmottini, M. Nocchetti and R. Vivani, Eur. J. Inorg. Chem., 1998, 1439–1446 CrossRef CAS.
- H. Cai, A. C. Hillier, K. R. Franklin, C. C. Nunn and M. D. Ward, Science, 1994, 266, 1551–1555 CAS.
- M. Ogawa and H. Kaiho, Langmuir, 2002, 18, 4240–4242 CrossRef CAS.
- P. Benito, M. Herrero, C. Barriga, F. M. Labajos and V. Rives, Inorg. Chem., 2008, 47, 5453–5463 CrossRef CAS PubMed.
- M. Jobbagy, M. A. Blesa and A. E. Regazzoni, J. Colloid Interface Sci., 2007, 309, 72–77 CrossRef CAS PubMed.
- J. M. Oh, S. H. Hwang and J. H. Choy, Solid State Ionics, 2002, 151, 285–291 CrossRef CAS.
- X. H. Liu, R. Z. Ma, Y. Bando and T. Sasaki, Adv. Mater., 2012, 24, 2148–2153 CrossRef CAS PubMed.
- V. Oestreicher, I. Fábregas and M. Jobbágy, J. Phys. Chem. C, 2014, 118, 30274–30281 CAS.
- V. Oestreicher and M. Jobbágy, Langmuir, 2013, 29, 12104–12109 CrossRef CAS PubMed.
- A. E. Gash, T. M. Tillotson, J. H. Satcher, J. F. Poco, L. W. Hrubesh and R. L. Simpson, Chem. Mater., 2001, 13, 999–1007 CrossRef CAS.
- A. E. Gash, T. M. Tillotson, J. H. Satcher, L. W. Hrubesh and R. L. Simpson, J. Non-Cryst. Solids, 2001, 285, 22–28 CrossRef CAS.
- A. E. Gash, J. H. Satcher and R. L. Simpson, J. Non-Cryst. Solids, 2004, 350, 145–151 CrossRef CAS.
- A. E. Gash, J. H. Satcher and R. L. Simpson, Chem. Mater., 2003, 15, 3268–3275 CrossRef CAS.
- H. D. Zhang, B. Li, Q. X. Zheng, M. H. Jiang and X. T. Tao, J. Non-Cryst. Solids, 2008, 354, 4089–4093 CrossRef CAS.
- L. Ehrenberg and S. Hussain, Mutat. Res., 1981, 86, 1–113 CAS.
- G. Soler-Illia, M. Jobbagy, A. E. Regazzoni and M. A. Blesa, Chem. Mater., 1999, 11, 3140–3146 CrossRef.
- K. Okamoto, N. Iyi and T. Sasaki, Appl. Clay Sci., 2007, 37, 23–31 CrossRef CAS.
- F. C. Hawthorne and E. Sokolova, Can. Mineral., 2002, 40, 939–946 CrossRef CAS.
- R. Z. Ma, Z. P. Liu, K. Takada, K. Fukuda, Y. Ebina, Y. Bando and T. Sasaki, Inorg. Chem., 2006, 45, 3964–3969 CrossRef CAS PubMed.
- J. R. Neilson, B. Schwenzer, R. Seshadri and D. E. Morse, Inorg. Chem., 2009, 48, 11017–11023 CrossRef CAS PubMed.
- Z. P. Liu, R. Z. Ma, M. Osada, K. Takada and T. Sasaki, J. Am. Chem. Soc., 2005, 127, 13869–13874 CrossRef CAS PubMed.
- M. Taibi, N. Jouini, P. Rabu, S. Ammar and F. Fievet, J. Mater. Chem. C, 2014, 2, 4449–4460 RSC.
- M. Taibi, S. Ammar, N. Jouini, F. Fievet, P. Molinie and M. Drillon, J. Mater. Chem., 2002, 12, 3238–3244 RSC.
- K. I. Pandya, W. E. Ogrady, D. A. Corrigan, J. McBreen and R. W. Hoffman, J. Phys. Chem., 1990, 94, 21–26 CrossRef CAS.
- P. V. Kamath, G. H. Annal Therese and J. Gopalakrishnan, J. Solid State Chem., 1997, 128, 38–41 CrossRef CAS.
- J. B. Liang, R. Z. Ma, N. B. O. Iyi, Y. Ebina, K. Takada and T. Sasaki, Chem. Mater., 2010, 22, 371–378 CrossRef CAS.
- C. Tessier, L. Guerlou-Demourgues, C. Faure, A. Demourgues and C. Delmas, J. Mater. Chem., 2000, 10, 1185–1193 RSC.
- J. Yan, Z. Fan, W. Sun, G. Ning, T. Wei, Q. Zhang, R. Zhang, L. Zhi and F. Wei, Adv. Funct. Mater., 2012, 22, 2632–2641 CrossRef CAS.
- P. Oliva, J. Leonardi, J. F. Laurent, C. Delmas, J. J. Braconnier, M. Figlarz, F. Fievet and A. Deguibert, J. Power Sources, 1982, 8, 229–255 CrossRef CAS.
- G. Chen, S. S. Liaw, B. Li, Y. Xu, M. Dunwell, S. Deng, H. Fan and H. Luo, J. Power Sources, 2014, 251, 338–343 CrossRef CAS.
- H. Chen, F. Cai, Y. Kang, S. Zeng, M. Chen and Q. Li, ACS Appl. Mater. Interfaces, 2014, 6, 19630–19637 CAS.
Footnote |
| † Electronic supplementary information (ESI) available. See DOI: 10.1039/c6ra27839f |
| This journal is © The Royal Society of Chemistry 2017 |

