 Open Access Article
Creative Commons Attribution 3.0 Unported Licence
Tailoring the alignment of string-like nanoparticle assemblies in a functionalized polymer matrix via steady shear
Yulong Chen *a,
Jun Liub,
Li Liub,
Huanre Hana,
Qian Xua and
Xin Qian*a
aCollege of Materials Science and Engineering, Zhejiang University of Technology, Hangzhou 310014, China. E-mail: chenyulong@zjut.edu.cn; qianx@zjut.edu.cn
bBeijing Engineering Research Center of Advanced Elastomers, Beijing University of Chemical Technology, Beijing 100029, China
First published on 27th January 2017
Abstract
Recent work has shown that nanoparticles (NPs) dispersed in a sequence specific functionalized polymer matrix can be organized into a variety of superstructures, such as strings, sheets, and percolated networks. However, these spontaneously formed structures are generally ordered within the short range. To exploit the use of NPs to their full potential, defect-free, long-range ordered NP organization is usually necessary. The use of a shear field may be an appropriate means to reach this objective due to its well-understood orientation effect. Therefore, the present study seeks to probe the effect of steady shear on the ordering of string-like NP assemblies in a functionalized polymer matrix on the basis of coarse-grained molecular dynamics simulations. We found that by properly tuning shear rate, the shear can induce one-dimensional alignment to the NP strings, and the emerging structures can remain stable after the cessation of shear, which is required for many applications such as the fabrication of nanomaterial arrays. The mechanism for forming such a well-defined structure can be interpreted from the competition among the NP mobility, polymer relaxation, NP-functional group interaction, and external shear effect. It may be expected that the information derived in the present study provides a useful foundation for guiding the design and preparation of tailored PNCs.
1. Introduction
Controlling the organization of nanoparticles (NPs) in polymer matrices with high precision has received tremendous interest since the collective properties of polymer nanocomposites (PNCs) significantly depend on the dispersion and spatial arrangement of NPs.1,2 It has been shown that some PNC properties are optimized when the NPs are randomly dispersed,3 while others require the NPs to form percolated networks4,5 or to align in a given direction.6,7 A number of routes have been developed to achieve these goals. For NP anisotropic assembly, the most direct strategy is to use NPs with anisotropic shapes or directional interactions.8–12 It was generally believed that it is difficult for isotropically interacting spherical NPs to self-assemble into anisotropic superstructures. However, recently, some studies have established approaches for creating a range of anisotropic structures from common spherical NPs.13–18 As a typical representative, Kumar's group13,19–22 found that spherical NPs uniformly grafted with polymer chains can self-assemble into strings and sheets.Similar to the findings of Kumar's group, some studies have also demonstrated that bare spherical NPs dispersed in sequence specific functionalized polymers23–25 can be organized into a variety of morphologies, where the backbones of the functionalized chains inherently dislike the NPs but the periodically spaced functional groups on the chains are designed to show specific affinity for the NPs.17,18 The adsorption of the functional groups on the NP surfaces makes the NPs act like transient “grafted NPs” (Fig. 1d). The dislike between the “grafts” and NP cores drives the self-assembly, which is similar to the behaviour of microphase-separated block copolymers.26 When the polymer chains are highly functionalized, the NPs are well dispersed due to steric (entropic) repulsion of the dense surrounding “grafts”, that is, the attractions between the NPs (including van der Waals and depletion forces) are strongly reduced by the “grafts”. In the opposite limit of low functionalization, the NPs aggregate, owing to the dominance of the NP–NP attractions. Intermediate values of functionalization degree yield a variety of interconnected NP structures such as strings, sheets, and networks, due to a balance of the NP–NP attractions and the steric stabilization of the “grafts” which leads to anisotropic interactions. Among these cases, the string-like NP assemblies gained considerable interest because NPs organized in this way behave akin to “nanowires”27,28 which is advantageous for transport or conductive properties of PNCs. However, these spontaneously formed structures are generally ordered within the short-range, but disordered on a larger scale, due to the isotropic phase structure of the polymer matrices.
For some anisotropic functional PNCs, long-range order of NPs in a given direction is usually needed. To reach this objective, the use of a shear field may be an appropriate approach due to its well-understood orientation effect.29,30 Compared to the alternative strategies, e.g., electric and magnetic fields, the advantage of shear flow is the ability to order microstructures over macroscopic length scales and no need for doping or exotic NP properties, which makes the shear alignment feasible for large-scale industrial manufacturing.
Investigating the shear behaviour of NPs in polymers via experiments is often prohibitively costing and time-consuming. Meanwhile, the experimental techniques still have a great challenge in revealing the microscopic morphologies of NPs under flow conditions. Computer simulations have emerged as useful techniques in addressing these issues.31–33 Several methods have been developed for simulations of PNC systems. Atomistic or near-atomistic simulations are quite accurate approaches to understand the structural and dynamic properties of PNCs at the molecular level,34–36 but only allow for the sampling of relatively small systems and short time scales, since they are rather computationally expensive. The length- and time-scale limitations of these methods are particularly restrictive for the study of the NP dispersion or organization in polymer melts under shear. On the other hand, the phase-field methods such as Cahn–Hilliard37 and self-consistent field theories38,39 enable simulation over long time scales and for large systems, but prohibit the detailed analysis of microscopic properties. For these reasons, coarse-grained models which group atoms or molecules into single particles have been widely adopted to investigate the sheared PNC systems.40–52 Although these models are of much lower resolution than atomistic, they still can describe the microscopic nature of the systems at length scales comparable to the intermolecular distances. However, up to now, there still no study related to the investigation of functionalized polymer/NP systems under shear.
In this study, we seek to employ coarse-grained molecular dynamics (CGMD) simulations to investigate the steady-shear behaviour of string-like NP assemblies in functionalized polymers. We begin by studying how shear rate affects the ordering of the NP strings and find that there exists an optimal shear-rate range to induce the formation of stabilized one-dimensional (1D) alignment of NP strings. Such well-defined structure can also be observed in other similar systems. We then discuss the structural formation mechanism based on the structural, dynamic, and rheological properties of the equilibrated and sheared PNC systems. Finally, the relaxing behaviour of these systems after ceasing shear is also considered to explore the stability of the shear-induced aligned NP strings.
2. Computational methods
2.1. Coarse-grained models
Our model PNC systems (Fig. 1b) are composed of bare spherical NPs (Fig. 1c) within linear in-chain functionalized polymers (Fig. 1a). The functionalized polymer chains are modelled using the standard bead-spring (Kremer–Grest) model53 with N = 65 spherical beads of size σ and mass m. Each chain consists of two types of beads, “B” and “F”. B beads are backbone beads, while F beads are functionalized beads which are uniformly distributed within the polymer chain (Fig. 1a). The functionalization degree of the polymer was defined as dF = NF/N, where NF being the number of functionalized beads in a chain. The adjacent beads in each chain are connected via a strong finitely extensible nonlinear elastic (FENE) potential:
 | (1) |
 | (2) |
The NPs are treated as spheres of diameter σNP = 4σ and mass mNP = 64m that are weakly attractive with each other. The interactions between the NPs and B beads are purely repulsive, while the interactions between the NPs and F beads are strongly attractive. These interactions are modeled via the truncated and shifted Lennard-Jones (LJ) potential:
 | (3) |
2.2. Simulation details
In this work, all the physical quantities are expressed in terms of LJ reduced units where σ, m, and ε are the basic length, mass, and energy scales, respectively. The reduced temperature and time units are defined as T = ε/kB (where kB is the Boltzmann constant) and τ = σ(m/ε)1/2, respectively.We carried out the MD simulations using the open source LAMMPS package developed by Sandia National Laboratories,56 where the equations of motion are integrated using a velocity-Verlet algorithm with a time step of Δt = 0.001τ. The temperature was kept fixed at T = ε/kB via a Nosé–Hoover thermostat. The polymer systems under such temperature, roughly twice the glass transition temperature Tg of the polymers, are expected to be in melt state.53 Since our aim is to investigate the processing behavior of PNCs under shear, such a setting is necessary.
The simulations were started from a non-overlapped configuration of NPs and functionalized chains in a large simulation box implementing periodic boundary conditions. The simulation box was gradually compressed to a volume V during the initialization phase of the simulation until a reasonable polymer melt-like density of ρpoly = nbeadm/Vpoly = 0.85m/σ3 was obtained, where nbead being the number of beads inside the system and Vpoly is the volume of the simulation box occupied by the polymer only but not the NPs. In the current study, large system sizes composed of nNP = 40–100 NPs and nchain = 200 polymer chains are utilized. Thus, the volume fraction of the NPs, defined by ϕNP = nNPπσNP3/(6V), is varied from 0.08 to 0.18.
Then, we ran the simulations in a canonical (NVT) ensemble over 200 million time steps for equilibrium. After equilibrium was reached, steady shear flow was applied to these systems through a constant triclinic deformation in LAMMPS with particle velocities remapped when a shear-gradient boundary is crossed. This implementation is equivalent to the classic Lees–Edwards boundary conditions.57 By this method we can impose a linear velocity profile with constant gradient ![[small gamma, Greek, dot above]](https://www.rsc.org/images/entities/i_char_e0a2.gif) = ∂vx/∂y. The flow direction is parallel to the x-axis, the velocity gradient is along the y-axis, and the z-axis refers to the vorticity direction. During the shearing process, the stress tensor can be calculated using the virial theorem:
= ∂vx/∂y. The flow direction is parallel to the x-axis, the velocity gradient is along the y-axis, and the z-axis refers to the vorticity direction. During the shearing process, the stress tensor can be calculated using the virial theorem:
 | (4) |
3. Results and discussion
3.1. Shear-induced 1D alignment of NP strings
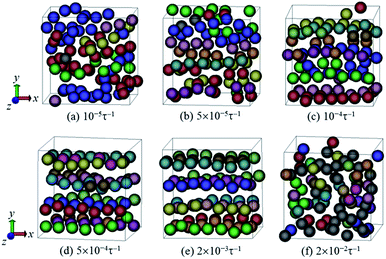
We start to simulate a system with functionalization degree dF = 0.12 and filler volume fraction ϕNP = 0.15. We found that when under the quiescent condition, the NPs can spontaneously self-assemble into interconnected strings (Fig. 1c). We then analyze the effect of shear on such a system by varying the shear rate![[small gamma, Greek, dot above]](https://www.rsc.org/images/entities/i_char_e0a2.gif) from 10−5 to 2 × 10⁻²τ−1. The steady-state structures of the NPs after shear are displayed in Fig. 2. It is clear that the initial interconnected strings can be broken up and restructured by shear force. When a moderate shear rate (e.g.,
from 10−5 to 2 × 10⁻²τ−1. The steady-state structures of the NPs after shear are displayed in Fig. 2. It is clear that the initial interconnected strings can be broken up and restructured by shear force. When a moderate shear rate (e.g., ![[small gamma, Greek, dot above]](https://www.rsc.org/images/entities/i_char_e0a2.gif) = 5 × 10⁻⁴τ−1 or 2 × 10⁻³τ−1) was applied, the NPs can arrange into 1D strings along the flow (x) direction (Fig. 2d and e). Keeping on increasing the shear rate (
= 5 × 10⁻⁴τ−1 or 2 × 10⁻³τ−1) was applied, the NPs can arrange into 1D strings along the flow (x) direction (Fig. 2d and e). Keeping on increasing the shear rate (![[small gamma, Greek, dot above]](https://www.rsc.org/images/entities/i_char_e0a2.gif) = 2 × 10⁻²τ−1), the strings would finally be broken into short strings or even individual NPs, as shown in Fig. 2f.
= 2 × 10⁻²τ−1), the strings would finally be broken into short strings or even individual NPs, as shown in Fig. 2f.
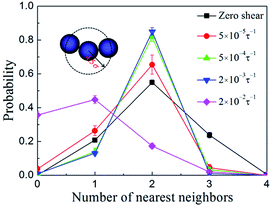
In order to describe the NP organization quantitatively, we calculated the probability distribution of the nearest neighbor coordination numbers of the NPs. Here the nearest neighbor coordination number was defined as follows: for the NPs in a simulation system, taking one of them as the central NP, the coordination number is the number of other NPs around the central NP within a distance of 4.5σ (range of strong short-range attraction between the NPs). The results are presented in Fig. 3. In the quiescent state, the majority of NPs have two neighbors and a small part of NPs have one or three neighbors, which indicates that the NPs were organized into interconnected strings because the NPs at the string ends, in the strings, and at the positions connecting different strings have one, two, and three neighbors, respectively. When the shear rate ![[small gamma, Greek, dot above]](https://www.rsc.org/images/entities/i_char_e0a2.gif) = 5 × 10⁻⁵ to 2 × 10⁻³τ−1, the probability at two neighbors is increasing while the probability at three neighbors decreases to a value close to zero, indicating that the interconnected strings were broken up and reconstructed into individual strings. With the shear rate further increasing (i.e.,
= 5 × 10⁻⁵ to 2 × 10⁻³τ−1, the probability at two neighbors is increasing while the probability at three neighbors decreases to a value close to zero, indicating that the interconnected strings were broken up and reconstructed into individual strings. With the shear rate further increasing (i.e., ![[small gamma, Greek, dot above]](https://www.rsc.org/images/entities/i_char_e0a2.gif) = 2 × 10⁻²τ−1), the individual strings would finally be broken into much shorter strings or even separated NPs, which can be reflected from the decrease of the probability at two neighbors as well as the increase of the probabilities at zero and one neighbor. These results are consistent with that presented in Fig. 2.
= 2 × 10⁻²τ−1), the individual strings would finally be broken into much shorter strings or even separated NPs, which can be reflected from the decrease of the probability at two neighbors as well as the increase of the probabilities at zero and one neighbor. These results are consistent with that presented in Fig. 2.
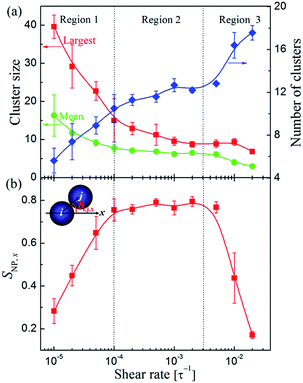
Next, the sizes and number of the NP clusters in each system were also calculated. Here we defined a NP belonging to a cluster if its center of mass is within 4.5σ from at least one other NP from that cluster. We found that under the quiescent condition, a main cluster, containing approximately 85% of NPs in the system, was formed, meaning that the majority of NP strings were connected to form network span throughout the system. When subjected to shear, the network would be broken into small clusters. As shown in Fig. 4a, the dependence of the largest and mean sizes as well as the number of clusters on the shear rate can be roughly divided into three regions, which relate to different packing structures shown in Fig. 2. Region 1 corresponds to the weak shear rate with ![[small gamma, Greek, dot above]](https://www.rsc.org/images/entities/i_char_e0a2.gif) < 10−4τ−1, where the largest (mean) cluster size decreases dramatically, and consequently, the number of clusters increases rapidly, in accordance with the phenomenon that the interconnected NP strings were gradually broken into separated strings as shown in Fig. 2a–c. While in the intermediate region 10−4τ−1 <
< 10−4τ−1, where the largest (mean) cluster size decreases dramatically, and consequently, the number of clusters increases rapidly, in accordance with the phenomenon that the interconnected NP strings were gradually broken into separated strings as shown in Fig. 2a–c. While in the intermediate region 10−4τ−1 < ![[small gamma, Greek, dot above]](https://www.rsc.org/images/entities/i_char_e0a2.gif) < 3 × 10⁻³τ−1 (Region 2), the sizes and number of clusters only show slight variations. In this region, the stabilized structures were formed. Finally, in Region 3 (
< 3 × 10⁻³τ−1 (Region 2), the sizes and number of clusters only show slight variations. In this region, the stabilized structures were formed. Finally, in Region 3 (![[small gamma, Greek, dot above]](https://www.rsc.org/images/entities/i_char_e0a2.gif) > 3 × 10⁻³τ−1), the cluster sizes further decrease and the number of clusters steeply increases, where the long strings would be further broken up by the shear flow.
> 3 × 10⁻³τ−1), the cluster sizes further decrease and the number of clusters steeply increases, where the long strings would be further broken up by the shear flow.
Moreover, we have also quantified the alignment of the NP clusters via the second Legendre polynomial SNP,x, also known as the Hermans orientation function, which was defined as follows:
 | (5) |
On the basis of the above analyses, we showed that there is a threshold shear rate, which turns out to be ![[small gamma, Greek, dot above]](https://www.rsc.org/images/entities/i_char_e0a2.gif) thr ≈ 10−4τ−1, below which no 1D alignment can be achieved. Meanwhile, we also showed that when the shear rate exceeds a critical value,
thr ≈ 10−4τ−1, below which no 1D alignment can be achieved. Meanwhile, we also showed that when the shear rate exceeds a critical value, ![[small gamma, Greek, dot above]](https://www.rsc.org/images/entities/i_char_e0a2.gif) c ≈ 3 × 10⁻³τ−1, the well-defined structures would finally be broken into randomly oriented short strings or even individual NPs. In the intermediate region, i.e.,
c ≈ 3 × 10⁻³τ−1, the well-defined structures would finally be broken into randomly oriented short strings or even individual NPs. In the intermediate region, i.e., ![[small gamma, Greek, dot above]](https://www.rsc.org/images/entities/i_char_e0a2.gif) thr <
thr < ![[small gamma, Greek, dot above]](https://www.rsc.org/images/entities/i_char_e0a2.gif) <
< ![[small gamma, Greek, dot above]](https://www.rsc.org/images/entities/i_char_e0a2.gif) c, the shear flow will direct the formation of long strings aligning along the shear direction. We found that the velocity-gradient and gradient-vorticity planes often show sliding layer (Fig. 5a) and hexagonal lattice (Fig. 5b) formations, respectively, and each layer composed of almost the same number of strings (Fig. 5c), indicating the well-defined ordering of the NPs in the system. Such a shear-induced emergence of aligned strings at moderate shear followed by a disordered state at high shear has been previously observed for sheared colloidal suspensions that consist of soft,29,58,59 hard,60 or charged61 particles. These strong similarities in the dynamic behavior are quite surprising since the investigated systems have rather different structural properties. Hence, there might be some (non-trivial) physical connection between these systems, which would be an interesting point requires to explore further.
c, the shear flow will direct the formation of long strings aligning along the shear direction. We found that the velocity-gradient and gradient-vorticity planes often show sliding layer (Fig. 5a) and hexagonal lattice (Fig. 5b) formations, respectively, and each layer composed of almost the same number of strings (Fig. 5c), indicating the well-defined ordering of the NPs in the system. Such a shear-induced emergence of aligned strings at moderate shear followed by a disordered state at high shear has been previously observed for sheared colloidal suspensions that consist of soft,29,58,59 hard,60 or charged61 particles. These strong similarities in the dynamic behavior are quite surprising since the investigated systems have rather different structural properties. Hence, there might be some (non-trivial) physical connection between these systems, which would be an interesting point requires to explore further.
In light of the above interesting structures formed at moderate shear rates, we are curious to know whether such well-ordered structure can be observed in other similar systems. To achieve that, we should choose systems initially (in the quiescent state) with spontaneously formed NP strings. In our past study,18 we have showed that the configuration of NP assemblies in quiescent system is determined by dF/ϕNP. When dF/ϕNP is ranged from 0.72 to 1.56, the NPs would organize into string-like assemblies. Therefore, in the current study, three other systems with dF = 0.06 and ϕNP = 0.08, dF = 0.09 and ϕNP = 0.12, and dF = 0.15 and ϕNP = 0.18, were selected. All the results are illustrated in Fig. 6, where the result for the previous system with dF = 0.12 and ϕNP = 0.15 is also included for comparison. Since dF/ϕNP for these systems is ranged from 0.75 to 0.83, the string-like assemblies of the NPs can indeed be observed (see Fig. 6a0–d0). Upon the imposing of moderate shear (![[small gamma, Greek, dot above]](https://www.rsc.org/images/entities/i_char_e0a2.gif) = 2 × 10⁻³τ−1), the NPs were finally reorganized into 1D strings aligning along the flow direction (Fig. 6a1–d1), which would become much more ordered with increasing the NP concentration due to sliding effect between the layers (Fig. 6c1 and d1).
= 2 × 10⁻³τ−1), the NPs were finally reorganized into 1D strings aligning along the flow direction (Fig. 6a1–d1), which would become much more ordered with increasing the NP concentration due to sliding effect between the layers (Fig. 6c1 and d1).
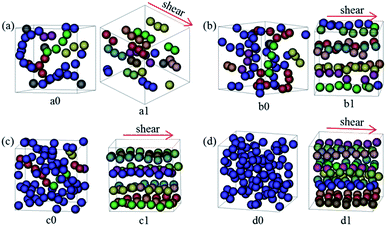 | ||
Fig. 6 NP morphologies (a0–d0) before and (a1–d1) after applying shear for the systems with (a) dF = 0.06 and ϕNP = 0.08, (b) dF = 0.09 and ϕNP = 0.12, (c) dF = 0.12 and ϕNP = 0.15, and (d) dF = 0.15 and ϕNP = 0.18, where the shear rate ![[small gamma, Greek, dot above]](https://www.rsc.org/images/entities/i_char_e0a2.gif) = 2 × 10⁻³τ−1. The meaning of spheres in various colors is same as Fig. 2. = 2 × 10⁻³τ−1. The meaning of spheres in various colors is same as Fig. 2. | ||
3.2. Structural formation mechanism
To understand the mechanism of forming the ordered NP structures under steady shear, we turn to analyze the structural, dynamic, and rheological properties of the equilibrated and sheared PNCs in the following. The discussions are only focused on the system with dF = 0.12 and ϕNP = 0.15, if there are no specific instructions.We first monitored the detailed evolution process of NP morphologies during shear. Some typical results are shown in Fig. 7. We found that even at the lowest shear rate tested (![[small gamma, Greek, dot above]](https://www.rsc.org/images/entities/i_char_e0a2.gif) = 10−5τ−1), the initial interconnected NP-string network can be broken up, as illustrated in Fig. 7a. At moderate shear rate (i.e.,
= 10−5τ−1), the initial interconnected NP-string network can be broken up, as illustrated in Fig. 7a. At moderate shear rate (i.e., ![[small gamma, Greek, dot above]](https://www.rsc.org/images/entities/i_char_e0a2.gif) = 2 × 10⁻³τ−1), the initial network was broken into much smaller strings or individual NPs in a time t < 2 × 10⁴τ (Fig. 7a, b, and c1). Then, the shear flow induced the ordering of these small strings along the flow direction, and at the same time led to inter-string connections (Fig. 7a, b, and c2). The breaking and recombining of NP strings would occur for many times until a steady-state structure was obtained for which the individual NP strings highly aligned along the shear direction were formed (Fig. 7a, b, c4 and c5). At high shear rate (i.e.,
= 2 × 10⁻³τ−1), the initial network was broken into much smaller strings or individual NPs in a time t < 2 × 10⁴τ (Fig. 7a, b, and c1). Then, the shear flow induced the ordering of these small strings along the flow direction, and at the same time led to inter-string connections (Fig. 7a, b, and c2). The breaking and recombining of NP strings would occur for many times until a steady-state structure was obtained for which the individual NP strings highly aligned along the shear direction were formed (Fig. 7a, b, c4 and c5). At high shear rate (i.e., ![[small gamma, Greek, dot above]](https://www.rsc.org/images/entities/i_char_e0a2.gif) = 2 × 10⁻²τ−1), the interconnected NP-string network would also be broken into small strings or individual NPs in the initial short time (t < 2 × 10⁴τ). However, these small strings or individual NPs are unable to coarsen into larger strings again (Fig. 7a and b) due to the extremely high shear force. For the above processes, the effect of shear on the NP morphologies can be quantitatively discussed by using the Péclet number, Pe = dNP2
= 2 × 10⁻²τ−1), the interconnected NP-string network would also be broken into small strings or individual NPs in the initial short time (t < 2 × 10⁴τ). However, these small strings or individual NPs are unable to coarsen into larger strings again (Fig. 7a and b) due to the extremely high shear force. For the above processes, the effect of shear on the NP morphologies can be quantitatively discussed by using the Péclet number, Pe = dNP2![[small gamma, Greek, dot above]](https://www.rsc.org/images/entities/i_char_e0a2.gif) /4DNP, where DNP is the NP diffusion coefficient obtained through 6DNPt = Δr2(t), and Δr2(t) is the mean-squared displacement of NPs. For
/4DNP, where DNP is the NP diffusion coefficient obtained through 6DNPt = Δr2(t), and Δr2(t) is the mean-squared displacement of NPs. For ![[small gamma, Greek, dot above]](https://www.rsc.org/images/entities/i_char_e0a2.gif) = 10−5τ−1, we got Pe = 7.81 > 1. The result indicates that the shear-induced drag force on a NP is higher than the random force (due to the thermal fluctuations) on it. Therefore, the flow can alter the NP dispersion state even at the lowest shear rate tested (
= 10−5τ−1, we got Pe = 7.81 > 1. The result indicates that the shear-induced drag force on a NP is higher than the random force (due to the thermal fluctuations) on it. Therefore, the flow can alter the NP dispersion state even at the lowest shear rate tested (![[small gamma, Greek, dot above]](https://www.rsc.org/images/entities/i_char_e0a2.gif) = 10−5τ−1).
= 10−5τ−1).
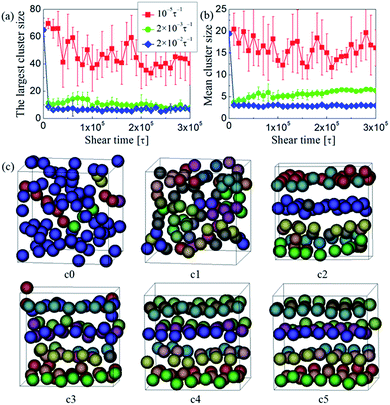 | ||
Fig. 7 (a) The largest and (b) mean cluster sizes as a function of time t at three typical shear rates ![[small gamma, Greek, dot above]](https://www.rsc.org/images/entities/i_char_e0a2.gif) . (c) Typical snapshots of NP strings sheared at . (c) Typical snapshots of NP strings sheared at ![[small gamma, Greek, dot above]](https://www.rsc.org/images/entities/i_char_e0a2.gif) = 2 × 10⁻³τ−1 for different time: (c0) t = 0, (c1) 2 × 10⁴, (c2) 8 × 10⁴, (c3) 1.5 × 10⁵, (c4) 2.5 × 10⁵, and (c5) 3 × 10⁵τ. The meaning of spheres in various colors is same as Fig. 2. = 2 × 10⁻³τ−1 for different time: (c0) t = 0, (c1) 2 × 10⁴, (c2) 8 × 10⁴, (c3) 1.5 × 10⁵, (c4) 2.5 × 10⁵, and (c5) 3 × 10⁵τ. The meaning of spheres in various colors is same as Fig. 2. | ||
It should be noted that the NP strings in the systems were also bridged through the functionalized polymer. Therefore, the changes of polymer structures and dynamics should also play an important role in the alignment of the NP strings. On this basis, we then began to investigate the structures and dynamics of the polymer under shear. Fig. 8 shows the diagonal components of the gyration tensor Rαα as a function of shear rate. We found that the polymer chains were almost fully isotropic at rest (not shown). However, as shear was applied, the chains would elongate along the flow (x) direction, and at the same time, slightly contract along the gradient (y) and vorticity (z) direction with Ryy < Rzz throughout. It is clear that the shear in these systems, even at the lowest rate studied (![[small gamma, Greek, dot above]](https://www.rsc.org/images/entities/i_char_e0a2.gif) = 10−5τ−1), is substantial enough that the polymer chains became deformed from their equilibrium configurations. Such tendencies can be described by the dimensionless Weissenberg number, Wi =
= 10−5τ−1), is substantial enough that the polymer chains became deformed from their equilibrium configurations. Such tendencies can be described by the dimensionless Weissenberg number, Wi = ![[small gamma, Greek, dot above]](https://www.rsc.org/images/entities/i_char_e0a2.gif) τ1, where τ1 is the longest relaxation time of polymer. Theoretical considerations based on the Rouse model predict that τ1 follows the relation τ1 = 2Rg,02/π2Dpoly,62 where Rg,0 is the radius of gyration of polymer at equilibrium and Dpoly is the polymer diffusion coefficient. For the simulations performed, we found τ1 = 1.74 × 10⁻⁵τ which yields values for Wi between 1.74–3840 for the entire shear rate range investigated. Clearly, since the polymer chains deform much more rapidly than relax, the polymer can be elongated along the flow direction.
τ1, where τ1 is the longest relaxation time of polymer. Theoretical considerations based on the Rouse model predict that τ1 follows the relation τ1 = 2Rg,02/π2Dpoly,62 where Rg,0 is the radius of gyration of polymer at equilibrium and Dpoly is the polymer diffusion coefficient. For the simulations performed, we found τ1 = 1.74 × 10⁻⁵τ which yields values for Wi between 1.74–3840 for the entire shear rate range investigated. Clearly, since the polymer chains deform much more rapidly than relax, the polymer can be elongated along the flow direction.
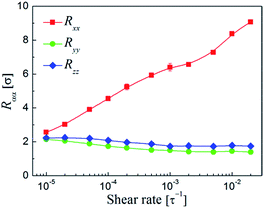 | ||
Fig. 8 Diagonal components of the gyration tensor Rαα of the functionalized polymer along the flow (x), gradient (y), and vorticity (z) directions of the shear flow as a function of shear rate ![[small gamma, Greek, dot above]](https://www.rsc.org/images/entities/i_char_e0a2.gif) . . | ||
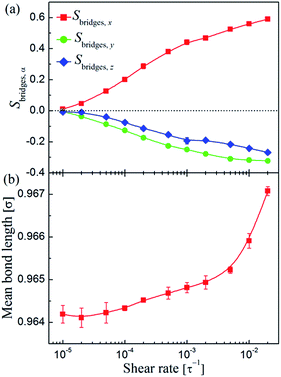
The elongation of the polymer chains will lead to the fact that the network structures of the PNCs become distorted or broken. To better understand the effect of shear on the polymer-bridged NP-string network, we quantified the alignment of the chain bridges between two neighboring adsorbing (functional) sites via the second Legendre polynomial Sbridges,α:
 | (6) |
![[small gamma, Greek, dot above]](https://www.rsc.org/images/entities/i_char_e0a2.gif) < 10−4τ−1), the bond length maintained at equilibrium value (l0 ≈ 0.9642σ) indicating the absence of chain stretching. While at high shear, especially when
< 10−4τ−1), the bond length maintained at equilibrium value (l0 ≈ 0.9642σ) indicating the absence of chain stretching. While at high shear, especially when ![[small gamma, Greek, dot above]](https://www.rsc.org/images/entities/i_char_e0a2.gif) > 3 × 10⁻³τ−1, chain stretching indeed can be observed. It should be noted that the bond stretching was below 0.5% for the highest flow strengths applied, indicating that our simulations did not include any unphysical simulation artifacts.63
> 3 × 10⁻³τ−1, chain stretching indeed can be observed. It should be noted that the bond stretching was below 0.5% for the highest flow strengths applied, indicating that our simulations did not include any unphysical simulation artifacts.63
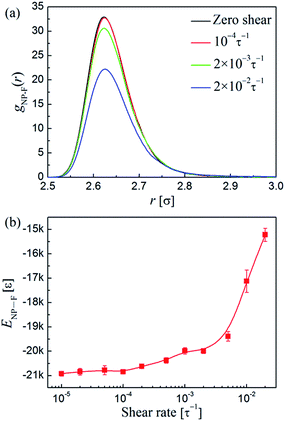
The stretching of the polymer bridges may lead to the debonding of the functionalized beads on the NPs, and thus result in the breaking of the polymer-bridged NP network. To gain more details about this issue, we then calculated the density profile of the functionalized beads around the NPs (the pair distribution function gNP–F(r)) and the total attraction energy between the NPs and functional sites (ENP–F). The corresponding results are presented in Fig. 10a and b, respectively. We find that the peaks of the gNP–F(r) are located at r = 2.62σ (Fig. 10a), which indicates the tight adsorption of functionalized beads on the NPs. When ![[small gamma, Greek, dot above]](https://www.rsc.org/images/entities/i_char_e0a2.gif) below 10−4τ−1, the variations of both the gNP–F(r) and ENP–F are negligible. At moderate shear rates (i.e., 10−4τ−1 <
below 10−4τ−1, the variations of both the gNP–F(r) and ENP–F are negligible. At moderate shear rates (i.e., 10−4τ−1 < ![[small gamma, Greek, dot above]](https://www.rsc.org/images/entities/i_char_e0a2.gif) < 3 × 10⁻³τ−1), the peaks of the gNP–F(r) slightly decrease, and accordingly the absolute value of the ENP–F also shows a slight decrease, indicating the debonding of a small amount of functionalized beads from the NPs. Therefore, we anticipated that the threshold shear rate
< 3 × 10⁻³τ−1), the peaks of the gNP–F(r) slightly decrease, and accordingly the absolute value of the ENP–F also shows a slight decrease, indicating the debonding of a small amount of functionalized beads from the NPs. Therefore, we anticipated that the threshold shear rate ![[small gamma, Greek, dot above]](https://www.rsc.org/images/entities/i_char_e0a2.gif) thr for the formation of 1D NP-strings is also the shear rate at which the functionalized beads around the NPs begin be dragged by shear since they relax slower than shear. As the functionalized beads adsorbed on the NPs were dragged by the shear, the polymer bridges between the NPs should exhibit slight chain stretching (Fig. 9b). While after
thr for the formation of 1D NP-strings is also the shear rate at which the functionalized beads around the NPs begin be dragged by shear since they relax slower than shear. As the functionalized beads adsorbed on the NPs were dragged by the shear, the polymer bridges between the NPs should exhibit slight chain stretching (Fig. 9b). While after ![[small gamma, Greek, dot above]](https://www.rsc.org/images/entities/i_char_e0a2.gif) exceeds 3 × 10⁻³τ−1, the polymer-bridged NP-string network became broken because the interfacial attractions between the NPs and functionalized beads cannot resist the retraction of polymer bridges between the NPs as they were significantly stretched at such high shear strength. Therefore, in this region, a large number of functionalized beads were dramatically breaking away from the NPs.
exceeds 3 × 10⁻³τ−1, the polymer-bridged NP-string network became broken because the interfacial attractions between the NPs and functionalized beads cannot resist the retraction of polymer bridges between the NPs as they were significantly stretched at such high shear strength. Therefore, in this region, a large number of functionalized beads were dramatically breaking away from the NPs.
Finally, we investigated the rheological properties of the sheared PNC systems to better understand the shear-induced behavior. Fig. 11a shows the first and second normal stress differences, N1 = σxx − σyy and N2 = σyy − σzz, respectively, as a function of shear rate. Apparently, the N1 profile looks similar in shape to those of Fig. 9b and 10b. The values of N1 are positive, therefore, the microstructure of the PNCs can be elongated along the flow direction (σxx > σyy). While the N2 values are slightly negative; since σyy < σzz, the PNC structures would be compressed in the gradient (y) direction, and thus Ryy < Rzz (Fig. 8) and Sbridges,y < Sbridges,z (Fig. 9a). Fig. 11b shows the temporal evolution of shear stress σxy during the startup of shear. It is apparent that when ![[small gamma, Greek, dot above]](https://www.rsc.org/images/entities/i_char_e0a2.gif) < 10−4τ−1, the computed σxy slowly increases as the shear is turned on until it converges to its steady state value. After
< 10−4τ−1, the computed σxy slowly increases as the shear is turned on until it converges to its steady state value. After ![[small gamma, Greek, dot above]](https://www.rsc.org/images/entities/i_char_e0a2.gif) exceeds 10−4τ−1, the temporal development of σxy shows an initial stress overshoot and then gradually drops to a well-defined steady state value. This overshoot is closely related to the yielding and/or breaking of the polymer-bridged NP network. In Fig. 11c, we plot the steady-state shear stress σxy as a function of shear rate
exceeds 10−4τ−1, the temporal development of σxy shows an initial stress overshoot and then gradually drops to a well-defined steady state value. This overshoot is closely related to the yielding and/or breaking of the polymer-bridged NP network. In Fig. 11c, we plot the steady-state shear stress σxy as a function of shear rate ![[small gamma, Greek, dot above]](https://www.rsc.org/images/entities/i_char_e0a2.gif) . We find that our data can be well fitted by Ostwald–de Wale64 power-law equation:
. We find that our data can be well fitted by Ostwald–de Wale64 power-law equation:
σxy = K![[small gamma, Greek, dot above]](https://www.rsc.org/images/entities/i_char_e0a2.gif) n n
| (7) |
 | (8) |
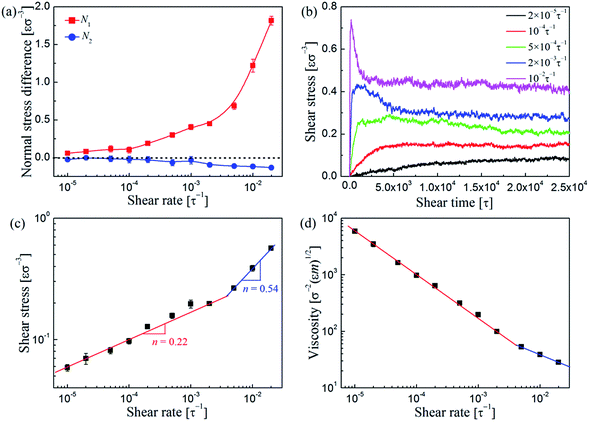 | ||
Fig. 11 (a) The first and second normal stress differences, N1 and N2, respectively, as a function of shear rate ![[small gamma, Greek, dot above]](https://www.rsc.org/images/entities/i_char_e0a2.gif) . (b) Shear stress σxy vs. time t during startup shear for the PNC system at various shear rates . (b) Shear stress σxy vs. time t during startup shear for the PNC system at various shear rates ![[small gamma, Greek, dot above]](https://www.rsc.org/images/entities/i_char_e0a2.gif) . (c) Shear stress σxy and (d) viscosity η as a function of shear rate . (c) Shear stress σxy and (d) viscosity η as a function of shear rate ![[small gamma, Greek, dot above]](https://www.rsc.org/images/entities/i_char_e0a2.gif) . The symbols show the simulation results, while the lines depict the prediction of eqn (7) for (c) and eqn (8) for (d). . The symbols show the simulation results, while the lines depict the prediction of eqn (7) for (c) and eqn (8) for (d). | ||
The results are presented in Fig. 11d. When ![[small gamma, Greek, dot above]](https://www.rsc.org/images/entities/i_char_e0a2.gif) <3 × 10⁻³τ−1, we determined the exponent n in eqn (7) and (8) to be 0.22. This pseudoplastic response is due to the strong shear-thinning behavior of the system, which is directly related to the gradual alignment of the individual NP strings and polymer chains. While when
<3 × 10⁻³τ−1, we determined the exponent n in eqn (7) and (8) to be 0.22. This pseudoplastic response is due to the strong shear-thinning behavior of the system, which is directly related to the gradual alignment of the individual NP strings and polymer chains. While when ![[small gamma, Greek, dot above]](https://www.rsc.org/images/entities/i_char_e0a2.gif) beyond 3 × 10⁻³τ−1, n is increased to 0.54, indicating that the shear-thinning was reduced to some extent because in this region the NP structures are not so well-defined as those in the previous regions.
beyond 3 × 10⁻³τ−1, n is increased to 0.54, indicating that the shear-thinning was reduced to some extent because in this region the NP structures are not so well-defined as those in the previous regions.
On the basis of the above analyses, the mechanism for forming the shear-induced ordered structures of the NPs can be generalized as follows. At low shear rate (![[small gamma, Greek, dot above]](https://www.rsc.org/images/entities/i_char_e0a2.gif) <
< ![[small gamma, Greek, dot above]](https://www.rsc.org/images/entities/i_char_e0a2.gif) thr ≈ 10−4τ−1), when Pe > 1, the shear can alter the NP dispersion state, and when Wi > 1, the shear can deform the polymer chains. Since the functionalized beads relax faster than shear at such low shear rate, the shear affects the NP morphology and polymer configuration independently. When at moderate shear rate (i.e.,
thr ≈ 10−4τ−1), when Pe > 1, the shear can alter the NP dispersion state, and when Wi > 1, the shear can deform the polymer chains. Since the functionalized beads relax faster than shear at such low shear rate, the shear affects the NP morphology and polymer configuration independently. When at moderate shear rate (i.e., ![[small gamma, Greek, dot above]](https://www.rsc.org/images/entities/i_char_e0a2.gif) thr <
thr < ![[small gamma, Greek, dot above]](https://www.rsc.org/images/entities/i_char_e0a2.gif) <
< ![[small gamma, Greek, dot above]](https://www.rsc.org/images/entities/i_char_e0a2.gif) c ≈ 3 × 10⁻³τ−1), the shear becomes faster than the functionalized bead relaxation rate. In this situation, the linkage of the NPs and functionalized polymer makes the NPs and polymer chains move integrally during shear. Therefore, the polymer-bridged NP-string network should resist the imposed shear integrally by deforming, yielding, and subsequently breaking its interblock bonds. The resulting small assemblies should still be stretched and then oriented along the flow direction. During such process, parts of the assemblies should become combined together again. The breaking and coarsening of the polymer-bridged NP strings should occur for many times until the final steady-state structure is obtained where the NP strings in the assemblies are highly aligned along the flow direction. However, after shear rate exceeds a critical value (
c ≈ 3 × 10⁻³τ−1), the shear becomes faster than the functionalized bead relaxation rate. In this situation, the linkage of the NPs and functionalized polymer makes the NPs and polymer chains move integrally during shear. Therefore, the polymer-bridged NP-string network should resist the imposed shear integrally by deforming, yielding, and subsequently breaking its interblock bonds. The resulting small assemblies should still be stretched and then oriented along the flow direction. During such process, parts of the assemblies should become combined together again. The breaking and coarsening of the polymer-bridged NP strings should occur for many times until the final steady-state structure is obtained where the NP strings in the assemblies are highly aligned along the flow direction. However, after shear rate exceeds a critical value (![[small gamma, Greek, dot above]](https://www.rsc.org/images/entities/i_char_e0a2.gif) >
> ![[small gamma, Greek, dot above]](https://www.rsc.org/images/entities/i_char_e0a2.gif) c), the polymer bridges between the NPs would be dragged away from the NPs, and as a consequence, the initial polymer-bridged NP-string network would be broken up into very small structures, i.e., very short strings or individual NPs, and cannot coarsen into larger structures again at such high shear rate.
c), the polymer bridges between the NPs would be dragged away from the NPs, and as a consequence, the initial polymer-bridged NP-string network would be broken up into very small structures, i.e., very short strings or individual NPs, and cannot coarsen into larger structures again at such high shear rate.
3.3. The stability of the aligned strings after ceasing shear
To explore the stability of the shear-induced aligned NP strings, the imposed shear flow is ceased and thereby the relaxing process of the nanocomposites can be investigated. Fig. 12a presents the morphologies of the sheared structures at different relaxing time for the system with dF = 0.12 and ϕNP = 0.15. It is interesting to find that the emerging structures remain stable after the cessation of shear. Fig. 12b also shows that only a very small decrease of SNP,x can be identified in the relaxing stage, even when the relaxing time reaches to 2 × 10⁵τ at which the polymer chains are almost recovering to isotropic configurations (Fig. 12c). The reason may be due to the fact that the motion of the NPs is strongly constrained by the surrounding matrix while the polymer chains still can relax to form new equilibrium structure, and as a result, the aligned NP strings can be maintained. This interesting finding suggests that stabilized 1D alignment of NP strings in polymer matrix can be achieved when applying an appropriate steady shear to specific functionalized polymer/NP systems, and the emerging structures can remain stable after the cessation of shear which ensures the applicability of shear-induced alignment.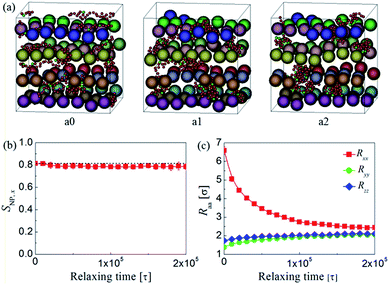 | ||
| Fig. 12 (a) Typical snapshots of NP morphologies after ceasing the shear for different time: (a0) t = 0, (a1) 105, and (a2) 2 × 10⁵τ. The meaning of spheres in various colors is same as Fig. 2. Here, we also plotted five chains, which are denoted by small spheres in red (backbone beads) and green (functionalized beads) colors, to illustrate the relaxation of polymer chains. (b) The second Legendre polynomial SNP,x of NP strings and (c) diagonal components of the gyration tensor Rαα of the functionalized polymer along the flow (x), gradient (y), and vorticity (z) directions of the shear flow as a function of relaxing time. | ||
4. Conclusions
In this work, we performed CGMD simulations to investigate the response of functionalized polymer/NP composites under steady shear. The uniqueness of the present modeling systems is that the functionalized polymers can induce the isotropically interacting spherical NPs spontaneously self-assemble into string-like superstructures, where the backbones of the functionalized chains inherently dislike the NPs but the periodically spaced functional groups on the chains are designed to show specific affinity for the NPs. The application of steady shear can lead to the breaking and rearrangement of these anisotropic NP assemblies. When shear rate below the threshold rate![[small gamma, Greek, dot above]](https://www.rsc.org/images/entities/i_char_e0a2.gif) thr, the NP dispersion state can be altered if Pe > 1, but the NP strings do not flow align since functionalized beads adsorbed on the NPs relax faster than shear. In the intermediate shear-rate range (
thr, the NP dispersion state can be altered if Pe > 1, but the NP strings do not flow align since functionalized beads adsorbed on the NPs relax faster than shear. In the intermediate shear-rate range (![[small gamma, Greek, dot above]](https://www.rsc.org/images/entities/i_char_e0a2.gif) thr <
thr < ![[small gamma, Greek, dot above]](https://www.rsc.org/images/entities/i_char_e0a2.gif) <
< ![[small gamma, Greek, dot above]](https://www.rsc.org/images/entities/i_char_e0a2.gif) c), the shear can induce 1D alignment to the NP strings, and the emerging structures can remain stable after ceasing the shear, which is required for many applications such as the fabrication of nanomaterial arrays. The formation of such well-defined structures reflects a balance among the NP mobility (Pe), polymer relaxation rate (Wi), NP-functional group interaction (εNP–F), and external shear effect (
c), the shear can induce 1D alignment to the NP strings, and the emerging structures can remain stable after ceasing the shear, which is required for many applications such as the fabrication of nanomaterial arrays. The formation of such well-defined structures reflects a balance among the NP mobility (Pe), polymer relaxation rate (Wi), NP-functional group interaction (εNP–F), and external shear effect (![[small gamma, Greek, dot above]](https://www.rsc.org/images/entities/i_char_e0a2.gif) ). While when shear rate exceeds a critical value
). While when shear rate exceeds a critical value ![[small gamma, Greek, dot above]](https://www.rsc.org/images/entities/i_char_e0a2.gif) c, the long NP strings would be broken into very short strings or even separated NPs because the functionalized polymers begin to lose their ability to direct NP assembly since they were seriously dragged away from the NPs at such high shear rate. It may be expected that the information derived in the present study provides a useful foundation for guiding the design and preparation of tailored PNCs.
c, the long NP strings would be broken into very short strings or even separated NPs because the functionalized polymers begin to lose their ability to direct NP assembly since they were seriously dragged away from the NPs at such high shear rate. It may be expected that the information derived in the present study provides a useful foundation for guiding the design and preparation of tailored PNCs.
Acknowledgements
This work was supported by the National Basic Research Program of China (2015CB654700 (2015CB674705)), Project of Department of Education of Zhejiang Province of China (GZ16551250002) and National Supercomputer Center in Guangzhou.References
- R. A. Vaia and J. F. Maguire, Chem. Mater., 2007, 19, 2736–2751 CrossRef CAS.
- S. K. Kumar and R. Krishnamoorti, Annu. Rev. Chem. Biomol. Eng., 2010, 1, 37–58 CrossRef CAS PubMed.
- M. E. Mackay, A. Tuteja, P. M. Duxbury, C. J. Hawker, B. Van Horn, Z. Guan, G. Chen and R. S. Krishnan, Science, 2006, 311, 1740–1743 CrossRef CAS PubMed.
- J. F. Moll, P. Akcora, A. Rungta, S. Gong, R. H. Colby, B. C. Benicewicz and S. K. Kumar, Macromolecules, 2011, 44, 7473–7477 CrossRef CAS.
- H. Deng, L. Lin, M. Ji, S. Zhang, M. Yang and Q. Fu, Prog. Polym. Sci., 2014, 39, 627–655 CrossRef CAS.
- N. Yousefi, X. Sun, X. Lin, X. Shen, J. Jia, B. Zhang, B. Tang, M. Chan and J. K. Kim, Adv. Mater., 2014, 26, 5480–5487 CrossRef CAS PubMed.
- M. Liu, Y. Du, Y.-E. Miao, Q. Ding, S. He, W. W. Tjiu, J. Pan and T. Liu, Nanoscale, 2015, 7, 1037–1046 RSC.
- S. C. Glotzer and M. J. Solomon, Nat. Mater., 2007, 6, 557–562 CrossRef PubMed.
- Z. Nie, A. Petukhova and E. Kumacheva, Nat. Nanotechnol., 2010, 5, 15–25 CrossRef CAS PubMed.
- M. Grzelczak, J. Vermant, E. M. Furst and L. M. Liz-Marzán, ACS Nano, 2010, 4, 3591–3605 CrossRef CAS PubMed.
- J. Du and R. K. O'Reilly, Chem. Soc. Rev., 2011, 40, 2402–2416 RSC.
- A. Walther and A. H. Müller, Chem. Rev., 2013, 113, 5194–5261 CrossRef CAS PubMed.
- P. Akcora, H. Liu, S. K. Kumar, J. Moll, Y. Li, B. C. Benicewicz, L. S. Schadler, D. Acehan, A. Z. Panagiotopoulos, V. Pryamitsyn, V. Ganesan, J. Ilavsky, P. Thiyagarajan, R. H. Colby and J. K. Douglas, Nat. Mater., 2009, 8, 354–359 CrossRef CAS PubMed.
- T. Nakano, D. Kawaguchi and Y. Matsushita, J. Am. Chem. Soc., 2013, 135, 6798–6801 CrossRef CAS PubMed.
- R. Shenhar, T. B. Norsten and V. M. Rotello, Adv. Mater., 2005, 17, 657–669 CrossRef CAS.
- T. Curk, F. J. Martinez-Veracoechea, D. Frenkel and J. Dobnikar, Nano Lett., 2014, 14, 2617–2622 CrossRef CAS PubMed.
- R. Klajn, M. A. Olson, P. J. Wesson, L. Fang, A. Coskun, A. Trabolsi, S. Soh, F. Stoddart and B. A. Grzybowski, Nat. Chem., 2009, 1, 733–738 CrossRef CAS PubMed.
- L. Liu, C. Sun, Z. Li, Y. Chen, X. Qian, S. Wen and L. Zhang, Soft Matter, 2016, 12, 1964–1968 RSC.
- V. Pryamtisyn, V. Ganesan, A. Z. Panagiotopoulos, H. Liu and S. K. Kumar, J. Chem. Phys., 2009, 131, 221102 CrossRef PubMed.
- S. K. Kumar, N. Jouault, B. C. Benicewicz and T. Neely, Macromolecules, 2013, 46, 3199–3214 CrossRef CAS.
- B. Bozorgui, D. Meng, S. K. Kumar, C. Chakravarty and A. Cacciuto, Nano Lett., 2013, 13, 2732–2737 CrossRef CAS PubMed.
- D. Zhao, M. Di Nicola, M. M. Khani, J. Jestin, B. C. Benicewicz and S. K. Kumar, ACS Macro Lett., 2016, 5, 790–795 CrossRef CAS.
- A. Hirao, M. Hayashi, S. Loykulnant, K. Sugiyama, S. W. Ryu, N. Haraguchi, A. Matsuo and T. Higashihara, Prog. Polym. Sci., 2005, 30, 111–182 CrossRef CAS.
- L. Wu, Y. Wang, Y. Wang, K. Shen and Y. Li, Polymer, 2013, 54, 2958–2965 CrossRef CAS.
- J. F. Lutz, M. Ouchi, D. R. Liu and M. Sawamoto, Science, 2013, 341, 1238149 CrossRef PubMed.
- F. S. Bates and G. H. Fredrickson, Phys. Today, 1999, 52, 32–38 CrossRef CAS.
- V. Pelletier, K. Asakawa, M. Wu, D. H. Adamson, R. A. Register and P. M. Chaikin, Appl. Phys. Lett., 2006, 88, 211114 CrossRef.
- J. M. Papalia, D. H. Adamson, P. M. Chaikin and R. A. Register, J. Appl. Phys., 2010, 107, 084305 CrossRef.
- R. Scirocco, J. Vermant and J. Mewis, J. Non-Newtonian Fluid Mech., 2004, 117, 183–192 CrossRef CAS.
- J. Moll, S. K. Kumar, F. Snijkers, D. Vlassopoulos, A. Rungta, B. C. Benicewicz, E. Gomez, J. Ilavsky and R. H. Colby, ACS Macro Lett., 2013, 2, 1051–1055 CrossRef CAS.
- G. Allegra, G. Raos and M. Vacatello, Prog. Polym. Sci., 2008, 33, 683–731 CrossRef CAS.
- J. Liu, L. Zhang, D. Cao and W. Wang, Phys. Chem. Chem. Phys., 2009, 11, 11365–11384 RSC.
- L. T. Yan and X. M. Xie, Prog. Polym. Sci., 2013, 38, 369–405 CrossRef CAS.
- H. Eslami, M. Rahimi and F. Müller-Plathe, Macromolecules, 2013, 46, 8680–8692 CrossRef CAS.
- C. M. Hadden, D. R. Klimek-McDonald, E. J. Pineda, J. A. King, A. M. Reichanadter, I. Miskioglu, S. Gowtham and G. M. Odegard, Carbon, 2015, 95, 100–112 CrossRef CAS.
- A. S. Pavlov and P. G. Khalatur, Soft Matter, 2016, 12, 5402–5419 RSC.
- W. Li, B. Dong and L. T. Yan, Macromolecules, 2013, 46, 7465–7476 CrossRef CAS.
- M. Surve, V. Pryamitsyn and V. Ganesan, Langmuir, 2006, 22, 969–981 CrossRef CAS PubMed.
- P. S. Stephanou, V. G. Mavrantzas and G. C. Georgiou, Macromolecules, 2014, 47, 4493–4513 CrossRef CAS.
- G. Raos, M. Moreno and S. Elli, Macromolecules, 2006, 39, 6744–6751 CrossRef CAS.
- V. Pryamitsyn and V. Ganesan, J. Rheol., 2006, 50, 655–683 CrossRef CAS.
- J. D. Thomin, P. Keblinski and S. K. Kumar, Macromolecules, 2008, 16, 5988–5991 CrossRef.
- V. Kalra, F. Escobedo and Y. L. Joo, J. Chem. Phys., 2010, 132, 024901 CrossRef PubMed.
- E. Jaber, H. Luo, W. Li and D. Gersappe, Soft Matter, 2011, 7, 3852–3860 RSC.
- Z. Pan, L. He, L. Zhang and H. Liang, Polymer, 2011, 52, 2711–2721 CrossRef CAS.
- J. T. Kalathi, G. S. Grest and S. K. Kumar, Phys. Rev. Lett., 2012, 109, 198301 CrossRef PubMed.
- Y. Chen, L. Liu, Q. Yang, S. Wen, L. Zhang and C. Zhong, Langmuir, 2013, 29, 13932–13942 CrossRef CAS PubMed.
- Y. Chen, Z. Li, S. Wen, Q. Yang, L. Zhang, C. Zhong and L. Liu, J. Chem. Phys., 2014, 141, 104901 CrossRef PubMed.
- F. Zhang, Y. Chen, C. Sun, S. Wen and L. Liu, RSC Adv., 2014, 4, 26706–26713 RSC.
- S. Mortezapour, H. Eslami and E. N. Oskoee, J. Chem. Phys., 2015, 143, 034901 CrossRef PubMed.
- L. Wang, Z. Zheng, T. Davris, F. Li, J. Liu, Y. Wu, L. Zhang and A. V. Lyulin, Langmuir, 2016, 32, 8473–8483 CrossRef CAS PubMed.
- Z. Zheng, J. Shen, J. Liu, Y. Wu, L. Zhang and W. Wang, RSC Adv., 2016, 6, 28666–28678 RSC.
- K. Kremer and G. S. Grest, J. Chem. Phys., 1990, 92, 5057–5086 CrossRef CAS.
- J. D. Weeks, D. Chandler and H. C. Anderson, J. Chem. Phys., 1971, 54, 5237–5247 CrossRef CAS.
- A. Schröder, M. Klüppel and R. H. Schuster, Macromol. Mater. Eng., 2007, 292, 885–916 CrossRef.
- S. Plimpton, J. Comput. Phys., 1995, 117, 1–19 CrossRef CAS.
- A. W. Lees and S. F. Edwards, J. Phys. C: Solid State Phys., 1972, 5, 1921–1929 CrossRef.
- A. Nikoubashman, G. Kahl and C. N. Likos, Phys. Rev. Lett., 2011, 107, 068302 CrossRef PubMed.
- A. Nikoubashman, G. Kahl and C. N. Likos, Soft Matter, 2012, 8, 4121–4131 RSC.
- J. Michele, R. Pätzold and R. Donis, Rheol. Acta, 1977, 16, 317–321 CrossRef CAS.
- S. R. Rastogi, N. J. Wagner and S. R. Lustig, J. Chem. Phys., 1996, 104, 9234–9248 CrossRef CAS.
- M. Doi and S. F. Edwards, in The Theory of Polymer Dynamics, Clarendon, New York, 1986 Search PubMed.
- A. Nikoubashman, R. L. Davis, B. T. Michal, P. M. Chaikin, R. A. Register and A. Z. Panagiotopoulos, ACS Nano, 2014, 8, 8015–8026 CrossRef CAS PubMed.
- J. D. Neves, M. V. da Silva, M. P. Gonçalves, M. H. Amaral and M. F. Bahia, Curr. Drug Delivery, 2009, 6, 83–92 CrossRef.
| This journal is © The Royal Society of Chemistry 2017 |


