 Open Access Article
Creative Commons Attribution 3.0 Unported Licence
Retracted Article: Self-limited growth of Pr3+-doped LaF3 nanocrystals in oxyfluoride glass and glass-ceramics
Amit Mallika,
Anil K. Barikb and
Biswajit Pal *b
*b
aDepartment of Chemistry, Siliguri College, Siliguri, Darjeeling 734 001, India
bDepartment of Chemistry, St. Paul's Cathedral Mission College, 33/1, Raja Rammohan Roy Sarani, Kolkata 700009, India. E-mail: palbiswajit@yahoo.com
First published on 6th March 2017
Abstract
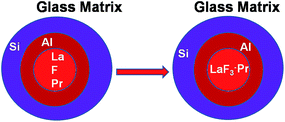
Transparent oxyfluoride glass-ceramics of heavy metals doped with rare earth metal ions are important materials in optoelectronics. In the present study, we report the preparation of a glass and a glass-ceramic with composition 16.52Al2O3·1.5 AlF3·12.65LaF3·4.33Na2O·64.85 SiO2 (mol%), where both the materials were doped with 1 mol% Pr2O3. All four species were structurally characterized by Transmission Electron Microscopy (TEM). Pr2O3 affected the phase separation in the glass and deferred crystallization compared to the undoped glass. The crystallization mechanism and the location of various components in the glass/glass-ceramics were ascertained through advanced STEM/EDX techniques. The phase separated regions in the mother glass were mostly populated by F and La and also by Pr, Al and Si. The phase separated droplets, after annealing, turned into 10–20 nm LaF3 nanocrystals, which were found to partly include the doping Pr3+ ions in the crystals themselves. The interphase crystal/glassy matrix was thoroughly characterized by EDX. The results suggest that the inner LaF3 crystal core is engulfed by an Al enriched layer that follows a Si enriched surrounding shell as the outer core. This finding also indicates that the crystal surface is too viscous to further enhance the crystal growth, and therefore the overall crystal formation is limited to the nanosize.
1. Introduction
The largest share of the most important class of modern advanced materials for application in the high tech realm, particularly in optoelectronics, is contributed by transition metals as well as rare earth (RE) doped heavy metal oxyfluoride glasses.1–6 These glasses are excellent precursors for the preparation of transparent glass-ceramics that cannot be achieved without vast experience coupled with a sound knowledge of fabrication and characterization techniques. Wang and Ohwaki7 proposed the formation of a PbF2–CdF2 mixed crystal that easily incorporated Yb3+ and Er3+ as dopants in its composition of 30% SiO2, 15% AlO1.5, 24% PbF2, 20% CdF2, 10% YbF3, 1% ErF3. Qiu et al.8–10 reported transparent glass-ceramics, free from toxic CdF2, with the composition of 50% SiO2, 30–50% PbF2, 0–10% ZnF2, 0–10% EuF3, where the insertion of the rare earth ions into the β-PbF2 microcrystal was not so impressive. The up-conversion properties originating from Tm3+ and/or Yb3+ center(s) within a host of glass-ceramics of similar compositions as mentioned above, doped or codoped with the rare earth metal ion(s), are reflected in a number of publications.11–15Some earlier reports16–20 have demonstrated the fabrication of a new class of transparent glass-ceramics that consist of LaF3 crystals dispersed in an aluminosilicate or aluminoborate glass. The crystals have the advantage of good rare earth solubility.
Russel,21 from his study on a glass system of composition (100 − x) (9.9Na2O·8.8K2O·12.1CaO·6.6Al2O3·62SiO2)·xCaF2, where the CaF2 crystal formation was ascertained within its nanosize limit, suggested a mechanism where the formation of a highly viscous layer enriched in SiO2 during crystallization acts as a diffusion barrier hindering further crystal growth.
A glass with the composition SiO2·Al2O3·Na2O·LaF3 doped with Yb3+, in which the RE cation acts as a nucleating agent for a diffusion-controlled crystallization mechanism has already been explored.22 Hu et al.23 studied the nucleating effect of Er3+ ions in the same glass but with a higher quantity of Er3+ ions than that used earlier to arrive at the conclusion that after heat treatment, LaF3 crystallites are smaller in size compared to those in the undoped composition. Barros et al.24 reported that the addition of Er3+ and Sm3+ in the SiO2·Al2O3·NaO2·BaF2 system, in which the crystallization of cubic BaF2 occurs, favors phase separation, which is not observed in the undoped material. The BaF2 crystals are formed within the phase-separated droplets, which may hinder diffusion and affect the overall crystallization process. However, there was no experimental support for the location of Er3+ and Sm3+ in the crystalline phase.
A. de Pablos-Martín et al.25 studied the crystallization kinetics of 20 nm sized LaF3 nanocrystals within a glass of composition 55SiO2·20Al2O3·15Na2O·10LaF3 (mol%), in which around 7.3 wt% of LaF3 crystallized after an uninterrupted 40 h of thermal treatment at 620 °C. From TEM and EDX analysis, they proposed that the parent glass possessed nano-sized phase-separated regions, containing not only La and F but also silicon and oxygen in addition to traces of Al.
Amongst the rare earth ions, only a few have transitions that are promising for optical amplification within the telecommunications window. One such ion is Pr3+ in doped glasses, which have been proven to be excellent for several applications in optical devices such as up-converters,26 solid state lasers27,28 and optical fibers.29–31 The prime reason behind the use of Pr3+ as an amplifier is that it is not held back by ESA or parasitic emission. The non-radiative decay directs Pr3+ to search for a host material with low phonon energy. Silicate glass owing to its high phonon energy is not targeted, compared to the fluoride glasses that serve the purpose by virtue of their high phonon energy. Thus, the glass-ceramics offer the fluoride environment to the Pr3+ sites with low phonon energy, compared to the precursor materials. It also has been established that after the ceramming process is over, a part of the Pr3+ ions is incorporated into the crystalline phase that eventually allows the Pr3+ doped fluoride glass to be used as a single mode fiber optical amplifier.32 The absorption and fluorescence spectral properties of Pr3+ ions in different host glasses have been extensively addressed by various researchers.33–35
To the best of our knowledge, there has been no previous report concerning a study on the distribution of the Pr3+ ion, particularly in oxyfluoride glass-ceramics, accomplished by employing TEM techniques. However, the possibility of performing the elemental distribution mappings of the rare earth element within the glass matrix would allow us to directly localize Pr3+ ions in the glass and glass-ceramics. The present study may also open up a new vista for ascertaining the compositional gradients in nanocrystals and the corresponding nanosized phase separation droplets that are acclaimed and established to grow during the preparation of rare earth doped glasses and glass ceramics.
2. Experimental
2.1. Parent glass synthesis
High purity raw materials, SiO2 (99.8%, E. Merck), AlF3 (99.9%, Aldrich), LaF3 (99.99% Aldrich), Na2CO3 (99.5%, E. Merck) and Al2O3 (98%, Sigma-Aldrich) and Pr2O3 (99.9%, Aldrich) were melted in a platinum crucible at 1400 °C for 1 h using an electrically heated furnace for the preparation of a glass of composition 16.52Al2O3·1.5AlF3·12.65LaF3·4.33Na2O·64.85SiO2 (mol%), and doped with 1 mol% Pr2O3. The molten mass was immediately transferred into a cast iron template (50 mm × 25 mm × 10 mm). The cast samples so obtained were annealed at 450 °C for 1 h, followed by controlled cooling to room temperature in order to release the internal stress. The glass samples were cut into pieces of about 1–2 mm in size with the help of a precision low speed cutting machine (Buehler). The corresponding glass samples were heat treated at constant temperature (600 °C), but with a heat treatment schedule varying from 10 to 80 h, to prepare the undoped and the doped glass-ceramics. Thus, the four prepared samples, including two glass samples (doped and undoped) and two corresponding glass ceramic samples (doped and undoped), were characterized using the following techniques.2.2. Characterization techniques
For the sample analysis, the scanning transmission electron microscopy (STEM) imaging modes claim certain benefits, compared to the TEM (i.e. illumination of the sample with a parallel electron beam, rather than with a fine-focused probe). The main advantage is the collection of the information about the sample using a high-angle annular dark-field (HAADF) detector, where the registered images have different levels of contrast related to the chemical composition of the sample. Another advantage of its use in the analysis of glass-ceramic samples is that the electron dose is lower in STEM,34 which is vital for electron-sensitive samples. In combination with HAADF-STEM imaging with the new irregularity alteration, the STEM technique ushers a direct method towards imaging the atomistic structure and composition of nanostructures with a sub-angstrom resolution.
The intensities of line scans and elemental mapping were obtained by evaluating the peak intensities, which are the areas under either the Kα- (O, F, Na, Al, Si) or Lα- (La, Pr) edges of the respective elements, with an automatic routine provided by the commercially available software Esprit 1.8 (Bruker Company). From the change in intensity of the Pr signal between the crystal and glass matrix, the Pr content can be qualitatively determined. In the glass sample, the line scan appeared at an acquisition time of 3 min by avoiding the damage of the EDX spectrum, while in the glass-ceramic sample, the same occurred at the extended acquisition time of 10 min, which proved to be more stable with respect to electron beam-induced sample damage. The experiments were carried out at room temperature using a conventional double-tilt TEM sample holder (FEI Company). However, one experiment was performed using a special cryo-transfer holder (Model 915 Gatan Company), in which the sample was kept at liquid-nitrogen temperature to minimize the radiation damage due to the mobility of highly diffusive ions like Na+.
3. Results and discussion
3.1. Differential thermal analysis (DTA)
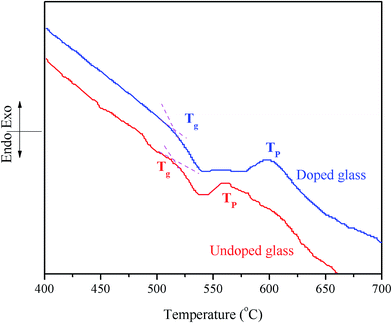
The DTA curves of the undoped glass and the 1 mol% Pr2O3-doped glass at 10 °C min−1 are shown in Fig. 1. The Pr2O3 doped glass exhibits a glass transition temperature (Tg) of 520 °C, which is 10 °C higher than that of the undoped glass (510 °C). The same curves also demonstrate that the exothermic crystallization peak temperature (TP) for the parent glass is 560 °C, which scales up to 605 °C for the RE-doped glass. This clearly indicates that the addition of RE cations affects the phase separation.3.2. X-ray diffraction (XRD)
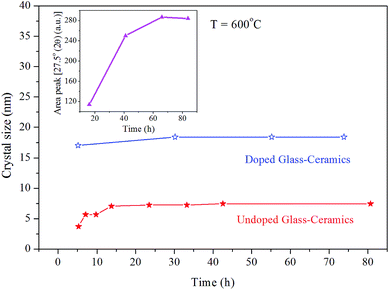
The XRD patterns of the 1 mol% Pr2O3-doped glass-ceramic obtained after heat treatment at 600 °C from 10 to 80 h, in general, correspond to the formation of hexagonal LaF3 crystals (JCPDS 32-0483) (Fig. 2). With an increase in the heat treatment time, the corresponding diffraction peak appears sharper and more intense than the signals corresponding to a rise in crystalline fraction. XRD patterns were fitted with the Gaussian profile. The sizes of the LaF3 crystals were calculated using the data corresponding to the peak (111) at 2θ = 27.5° using the Scherrer eqn (1):
D = Gλ/B![[thin space (1/6-em)]](https://www.rsc.org/images/entities/char_2009.gif) cos cos![[thin space (1/6-em)]](https://www.rsc.org/images/entities/char_2009.gif) θ θ
| (1) |
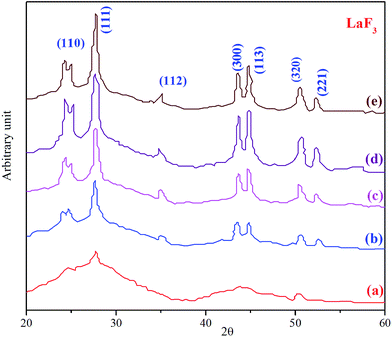 | ||
| Fig. 2 XRD patterns of Pr2O3-doped glass ceramic samples; all were prepared at 600 °C, with different heat treatment time periods: (a) 10 h, (b) 20 h, (c) 40 h, (d) 60 h and (e) 80 h. | ||
The inset of (Fig. 3) shows the graph where the area under the diffraction peak at 2θ = 27.5° is plotted against the function of time, where the peak area increases rapidly from 20 to 40 h. It is further stated that for longer heat treatment times, the area increases more slowly before its stabilization. The quantity of crystals increases rather than their size. Thus, the nucleation takes place in the glass-ceramic regions, in which the chemical composition presents Tg values below the heat treatment temperature. The nucleation process goes on until the Tg values of the glass-ceramics are close to the heat treatment temperature, after which further nucleation and crystallization are hindered.21 This result thus supports the hypothesis of the formation of a diffusional barrier, which inhibits the crystal growth.
3.3. Transmission electron microscopy (TEM) and scanning transmission electron microscopy (STEM)
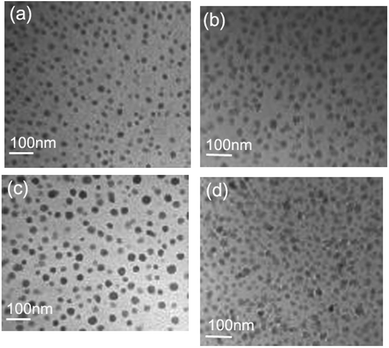
Transmission electron micrographs of undoped glass and the corresponding glass-ceramic obtained at 600 °C for 20 h are presented in Fig. 4a and b, respectively, while those of both the doped parent and the corresponding glass ceramics are shown in Fig. 4c and d, respectively. A comparison of the micrographs in Fig. 4a and c highlights the fact that the parent glass is phase separated and contains amorphous La enriched droplets of size 10–25 nm, in contrast to the doped glass where the same droplets seem to be somewhat larger. The rise in Tg may partly be attributable to this enhancement of the phase separation in the doped glass. Thus, the phase separation is affected to some extent by the addition of RE cations,32 despite there being no clear reason. Fig. 4b and d indicate the uniform dispersion of LaF3 nanocrystals in the corresponding glass-ceramic. The onset of more extended phase separation in the doped glass-ceramic (Fig. 4d) than in the undoped material (Fig. 4b) can be observed from the comparison of the micrographs.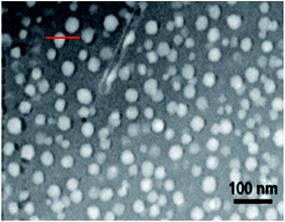 | ||
| Fig. 5 The STEM image of Pr3+-doped glass; the red line indicates a phase-separation droplet, across which the EDX line scan was conducted to ascertain the compositional profile. | ||
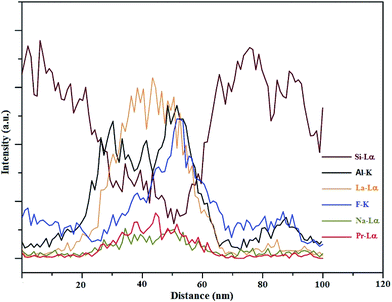 | ||
| Fig. 6 EDX line scan along the trace of the red line, as mentioned in Fig. 5. | ||
The earlier report made by Ahn et al.37 indicated the radiation damage in Na-containing micas under the TEM electron beam; however, the distribution of Na observed in this study cannot be claimed with certainty. As far as the concentration gradient of Pr is concerned, the EDX line scan confirms that the doped metal is mostly populated in the phase separation droplet.
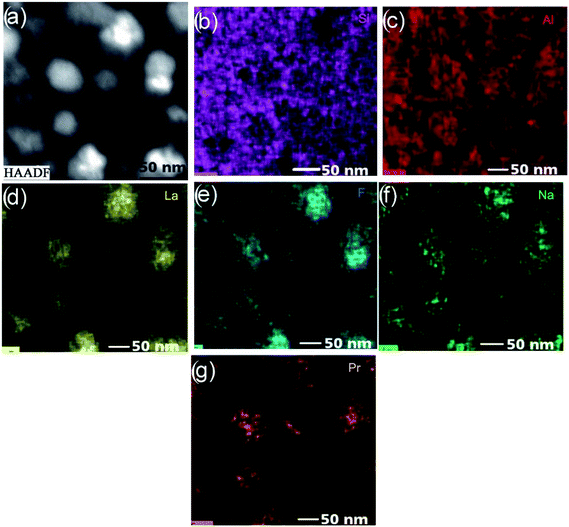
The micrographs of HAADF-STEM and the consequent EDX analyses shown as lateral elemental distribution maps are presented in (Fig. 7). The comparison between the images of HAADF-STEM (Fig. 7a) and the corresponding elemental maps (Fig. 7b–g) disclose some characteristic features. The perusal of the elemental mapping indicates that the entire glassy matrix is uniformly dispersed with Si (Fig. 7b) and Al (Fig. 7c) but with a slight decrease in their concentrations at the center of the droplets. This is also commensurable with the EDX line scans (Fig. 6).
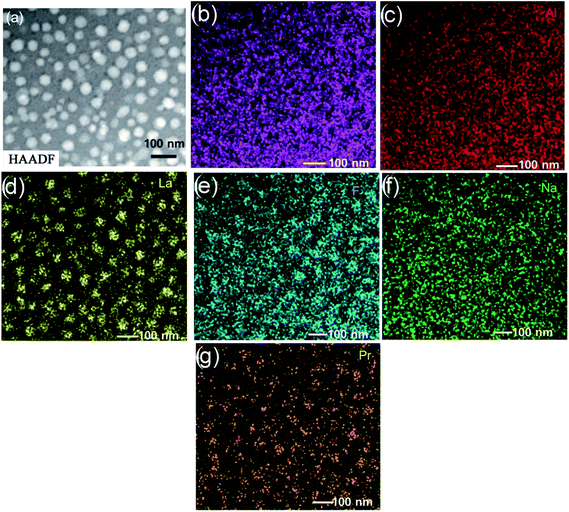 | ||
| Fig. 7 (a) HAADF-STEM micrographs of the doped glass. Related EDX mappings of (b) Si, (c) Al, (d) La, (e) F, (f) Na and (g) Pr. | ||
The phase separation droplets, as in the earlier study,1 are no doubt enriched by La and F, which is in accordance with the results (Fig. 7d and e). High concentrations of La occur in the phase separation droplets, although the rest of the glassy matrix has the element in low concentrations; however, fluorine is noticed to abound in both the phase separation droplets and glass matrix. This observation is in good agreement with the 19F NMR data reported for an earlier glass38 that which indicate the distribution of fluorine between La–F and Al–F–Na bonds. Since the extreme diffusion rate of the Na+ ion under the electron beam limits its accurate measurement, the quality of the resulting Na map of the glass (Fig. 7f) is not at all satisfactory. From the analysis of the elemental map of Pr (Fig. 7g), it is quite certain that Pr is integrated and enhanced in the amorphous phase-separation droplets. There is a major concentration of this element in the amorphous phase separation droplets, although a smaller but significant concentration is there in the glassy matrix. The similarities in radii among lanthanides benefit the identification of Pr with La in the phase separation droplets.
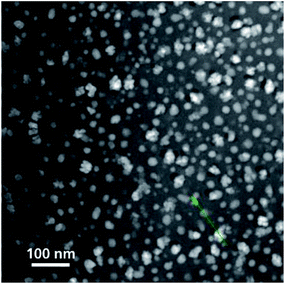 | ||
| Fig. 8 STEM image of Pr3+-doped glass-ceramics. The green line indicates a phase-separation droplet, across which the EDX line scan was done to ascertain the compositional profile. | ||
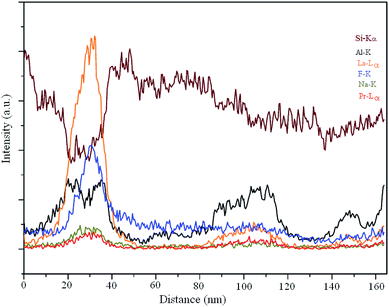 | ||
| Fig. 9 EDX line scan along the trace of the green line, as mentioned in Fig. 8. | ||
The significant increase in the Pr concentration in the line scan firmly establishes the incorporation of these optically active ions within the LaF3 structure. This fact certainly plays the key role in the enhancement of the up-conversion emission of the glass-ceramic.33 With a view to keep the Na-mobility as low as possible, which might otherwise be elusive in the interpretation of the elemental distribution, STEM experiments were carried out at liquid N2 temperature, employing a special cryo-TEM holder. Fig. 10 shows the first STEM micrograph, which exhibits a dense patch in the center to suggest a structural change in this region. The Na element distribution map is shown in Fig. 11. Sodium (Na) is found to migrate from the center of the scanned area towards the boundary, which displays its improvement. Just like for the glass, EDX elemental mappings were also attempted for the glass-ceramic (Fig. 12a). The evidence obtained from elemental mappings indicates that Si (Fig. 12b) is uniformly spread over the entire glassy matrix. With respect to the crystals, the same element is found to be enhanced towards the periphery, while being less concentrated at the center (Fig. 7b). In the first crystal, Al is distributed across the whole area (Fig. 12c), but a perceptible enhancement of this element can be noticed at its periphery. The presence of La and F as the integral elements, also in the crystal, is evidenced from (Fig. 12d and e). The elemental mapping of Na is shown in (Fig. 12f). Its detailed distribution in the glass-ceramics has been obscured due to the radiation damage (Fig. 10 and 11). From (Fig. 12g), it is quite obvious that LaF3 crystal is quite enriched with praseodymium, while in the glassy matrix this element is not abundant.
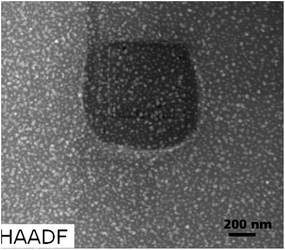 | ||
| Fig. 10 HAADF-STEM micrographs of doped glass-ceramics obtained after heat treatment at 600 °C for 20 h. | ||
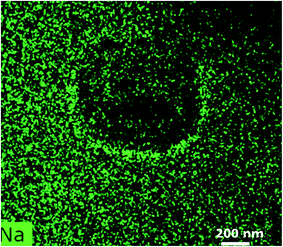 | ||
| Fig. 11 EDX of Na-mapping as mentioned in Fig. 10. | ||
 | ||
| Fig. 12 (a) HAADF-STEM micrographs of the doped glass-ceramics; related EDX mappings of (b) Si, (c) Al, (d) La, (e) F, (f) Na and (g) Pr. | ||
The integration of the above experimental results indicates that the mother glass, although composed primarily of La and F enriched phase separation droplets, also contains Si, Al, O elements. The doped Pr3+ ion partially diffused into the phase separation regions. Al in the form of Al2O3 constitutes a thin shell that surrounds the droplets. The annealing of the glass facilitates the augmentation of the LaF3–Pr crystallites within the phase separation droplets (Fig. 13).
4. Conclusion
The microstructures of both the doped and undoped parent glass reveal phase separation involving amorphous La-enriched droplets of 10–20 nm in size. Both the glass matrix and the phase separation droplets are impregnated with doped Pr3+ ion. The exterior part of the droplet is augmented in Al and Si, while the central part is concentrated in La, F and Pr. The heat treatment temperature of the mother glass allows the droplet to grow as a LaF3 nanocrystal, which acts as a host for Pr3+ ions. The advanced STEM/EDX analysis suggests that a thin Al rich shell encompasses the core crystal. The overall agglomerate is further swallowed by the exterior Si-enriched shell. This increases the viscosity of the overall crystal surface that puts a rider on the crystal so that it cannot grow beyond the nanosized limit during its formation. Moreover, the EDX elemental mappings that establish that the doped Pr3+ ions are incorporated into the LaF3 nanocrystals may be, in general, considered as an up-to-the-minute and advanced instrumental tool to determine the ins and outs of the rare-earth doped glass-ceramics. This could be a welcome approach in applied research on optical devices.Acknowledgements
TEM, STEM/EDX and XRD facilities have been availed from IIT Delhi and IISC Bangalore, India, which is gratefully acknowledged. Prof. A. Basumajumdar, University of Calcutta, India and Dr P. Kundu, CGCRI, Kolkata, India deserves special thanks for their helpful suggestions and perusing this study.References
- A. de Pablos-Martín, D. Ristic, S. Bhattacharyya, T. Hoche, G. C. Mather, S. Ramirez, M. O. Soria, M. Ferrari, G. C. Righini, L. E. Bausa, A. Duran and M. J. Pascual, J. Am. Ceram. Soc., 2013, 96, 447 Search PubMed.
- A. de Pablos-Martín, M. O. Ramírez, A. Durán, L. E. Bausá and M. J. Pascual, Opt. Mater., 2010, 33, 180 CrossRef.
- G. Dominiak-Dzik, R. Lisiecki, W. Ryba-Romanowski and L. Krajczyk, J. Alloys Compd., 2012, 511, 189 CrossRef CAS.
- A. de Pablos-Martin, A. Duran and M. J. Pascual, Int. Mater. Rev., 2012, 57, 165 CrossRef CAS.
- C. Lin, L. Li, S. Dai, C. Liu, Z. Zhao, C. Bocker and C. Russel, J. Phys. Chem. C, 2016, 120, 4556 CAS.
- S. L. Gai, C. X. Li, P. P. Yang and J. Lin, Chem. Rev., 2014, 114, 2343 CrossRef CAS PubMed.
- Y. Wang and J. Ohawki, Appl. Phys. Lett., 1993, 63, 3268 CrossRef CAS.
- J. Qiu, N. Sugimoto and K. Hirao, J. Mater. Sci. Lett., 1996, 15, 1641 CAS.
- J. Qiu, R. Kamo, Y. Kawamoto, Y. Nado and K. Kurashima, J. Mater. Sci. Lett., 1998, 17, 653 CrossRef CAS.
- Y. Kawamoto, R. Kano and J. Qiu, J. Mater. Sci., 1998, 33, 63 CrossRef CAS.
- D. Chen, S. Liu, Z. Wan and Z. Ji, J. Eur. Ceram. Soc., 2016, 36, 1841 CrossRef CAS.
- D. Chen, Y. Zhou, Z. Wan, P. H. Hua Yu, H. Lu and Z. Ji, J. Eur. Ceram. Soc., 2015, 35, 2129 CrossRef CAS.
- Z. Wan, D. Chen, Y. Zhou, P. Huang, J. Zhong, M. Ding, H. Yu and Z. Ji, J. Eur. Ceram. Soc., 2015, 35, 3673 CrossRef CAS.
- X. Wu, J. P. Denis, G. Ozen, A. Keramaoui, F. Pelle and B. Balanzat, J. Appl. Phys., 1994, 75, 4180 CrossRef.
- X. Wu, J. P. Denis, G. Ozen, A. Keramaoui and F. Pelle, Phys. Status Solidi, 1994, 141, 445 CrossRef CAS.
- J. Zhao, R. Ma, X. Chen, B. Kang, X. Qiao, J. Du, X. Fan, U. Ross, C. Roiland, A. Lotnyk, L. Kienle and X. H. Zhang, J. Phys. Chem. C, 2016, 120, 17726 CAS.
- P. P. Fedorov, A. A. Luginina and A. I. Popov, J. Fluorine Chem., 2015, 172, 22 CrossRef CAS.
- C. Lin, C. Bocker and C. Russel, Nano Lett., 2015, 15, 6764 CrossRef CAS PubMed.
- R. M. Mac Farlane and M. J. Dejeneka, Opt. Lett., 2001, 26, 429 CrossRef CAS.
- M. J. Dejneka, MRS Bull., 1998, 23, 57 CrossRef CAS.
- C. Russel, Chem. Mater., 2005, 17, 5843 CrossRef.
- D. Chen, Y. Wang, Y. Yu and E. Ma, Mater. Chem. Phys., 2007, 101, 464 CrossRef CAS.
- Z. Hu, Y. Wang, F. Bao and W. Luo, J. Non-Cryst. Solids, 2005, 351, 722–728 CrossRef CAS.
- J. R. Barros, C. Bocker and C. Russel, Solid State Sci., 2010, 12, 2086 CrossRef CAS.
- A. de Pablos-Martín, N. Hémono, G. C. Mather, S. Bhattacharyya, T. Höche, H. Bornhoft, J. Deubener, F. Muñoz, A. Durán and M. J. Pascual, J. Am. Ceram. Soc., 2011, 94, 2420 CrossRef.
- K. Wei, D. P. Machewiz, J. Wenzel, E. Snitzer and G. H. Singel, J. Non-Cryst. Solids, 1995, 182, 257 CrossRef.
- P. Urquhart, IEEE J. Quantum Electron., 1992, 28, 1962 CrossRef CAS.
- G. Gao and L. Wondraczek, Opt. Mater. Express, 2013, 3, 633 CrossRef CAS.
- G. D. Dzik, J. Nanosci. Nanotechnol., 2009, 9, 2525 CrossRef.
- E. V. Karaksina, V. S. Shiryaev, T. V. Kotereva and M. F. Churbanov, J. Lumin., 2016, 170, 37 CrossRef CAS.
- E. V. Karaksina, V. S. Shiryaev, T. V. Kotereva, A. P. Velmuzhov, L. A. Ketkova and G. E. Snopatin, J. Lumin., 2016, 177, 275 CrossRef CAS.
- A. Jha, M. Naftaly, S. Jordery, B. N. Samson, E. R. Taylor, D. Hewak, D. N. Payne, M. Poulain and G. Zhang, J. Eur. Opt. Soc., Part A, 1995, 4, 417 CrossRef CAS.
- X. J. Wang, H. R. Zheng, D. Jia, S. H. Huang, R. J. Meltzer, M. J. Dejneka and W. M. Yen, Microelectron. J., 2003, 34, 549 CrossRef CAS.
- W. A. Plsarski, J. Optoelectron. Adv. Mater., 2006, 8, 1206 Search PubMed.
- G. D. Dzik, B. Klimesz and W. Ryba-Romanowski, Opt. Appl., 2010, XL, 375 Search PubMed.
- S. Bhattacharyya, C. Bocker, T. Heil, J. R. Jinschek, T. Höche, C. Rüssel and H. Kohl, Nano Lett., 2009, 9, 2493 CrossRef CAS PubMed.
- J. H. Ahn, D. R. Peacor and E. J. Essene, Ultramicroscopy, 1986, 19, 375 CrossRef CAS.
- F. Munoz, A. de Pablos-martin, N. Hemono, M. J. Pascual, A. Duran, L. Delevoye and L. Montagne, J. Non-Cryst. Solids, 2011, 357, 1463 CrossRef CAS.
- S. Bhattacharyya, T. Höche, K. Hahn, J. R. Jinschek, I. Avramov, R. Wurth, M. Muller and C. Rüssel, Cryst. Growth Des., 2010, 10, 379 CAS.
| This journal is © The Royal Society of Chemistry 2017 |

