 Open Access Article
Creative Commons Attribution 3.0 Unported Licence
Si-centered capped trigonal prism ordering in liquid Pd82Si18 alloy study by first-principles calculations
F. Dong a,
G. Q. Yueab,
Y. R. Guoa,
C. Qiaoa,
Z. Y. Wanga,
Y. X. Zhenga,
R. J. Zhanga,
Y. Sunb,
W. S. Sucd,
M. J. Kramerb,
S. Y. Wang*abe,
C. Z. Wang*b,
K. M. Hob and
L. Y. Chena
aShanghai Ultra-Precision Optical Manufacturing Engineering Center, Department of Optical Science and Engineering, Fudan University, Shanghai, 200433, China. E-mail: songyouwang@fudan.edu.cn
bAmes Laboratory, U. S. Department of Energy and Department of Physics and Astronomy, Iowa State University, Ames, Iowa 50011, USA. E-mail: wangcz@ameslab.gov
cExperimentation Division, National Taiwan Science Education Center, Taipei 11165, Taiwan
dDepartment of Electro-Optical Engineering, National Taipei University of Technology, Taipei 10608, Taiwan
eKey Laboratory for Information Science of Electromagnetic Waves (MoE), Shanghai 200433, China
First published on 24th March 2017
Abstract
First-principles molecular dynamic (MD) simulation and X-ray diffraction were employed to study the local structures of Pd–Si liquid at the eutectic composition (Pd82Si18). A strong repulsion is found between Si atoms, and Si atoms prefer to be evenly distributed in the liquid. The dominate local structures around Si atoms are found to be with of a trigonal prism capped by three half-octahedra and an archimedean anti-prism. The populations of these clusters increase significantly upon cooling, and may play an important role in the formation of Pd82Si18 alloy glass.
1. Introduction
In recent years, amorphous alloys have received much attention due to their excellent properties such as high strength, high corrosion resistance and low elastic modulus. However, their small size and high cooling rate required for glasses formation greatly limit their applications. Recently, the study by Inoue et al. shows that the more constituent elements the better glass forming ability.1–3 Such an observation opened a door to design new bulk metallic glasses (MGs).4,5 Many kinds of multicomponent bulk MGs were developed.3,6,7 However, multi-components systems greatly complicate the investigation on the mechanisms of glass formation by experiments and computer simulations. As an important first step toward full understanding of the glass formation mechanisms, detail studies of the temperature dependence of the structures of binary glass forming liquids are necessary.During rapidly quenching process, the structure in the liquid state, especially in the undercooled liquid, would have a remarkable influence on the glass formation. However, it has been a long-standing challenge on how to quantify and describe the structures of undercooled metallic liquids.8–10 Pd-Based bulk metallic glasses (BMGs) can be readily prepared at the composition around Pd81Si19, and it's an ideal model system to understand the interplay between local order and glass-forming ability. In Pd–Si alloy, two types of trigonal prism structures, of which one is a trigonal prism capped with three half-octahedra (9 Pd atoms around a Si atom, abbreviated as Si–9Pd) and the other is a trigonal prism (6 Pd atoms around a Si atom), are proposed to be the structure units.11–13 Furthermore, Saida14 has suggested that the formation of trigonal prism clusters provides good stability for glass structure in metallic glassy alloys. Thus, the fraction of trigonal prism clusters should increase as the liquid is cooled toward the glass transition temperature. However, the development of trigonal prism clusters in Pd–Si liquid as the function of temperature has not been well characterized despite of intensive experimental15–18 and computational investigations.19–21
In this paper, using first-principles molecular dynamics (MD) simulations and various structure analysis methods, including a recently developed atomic cluster-alignment (ACA) method,22 we will study the variation of short-range order (SRO) in liquid and undercooled liquid Pd82Si18 as the function of temperature to characterize the development of significant local structure. The paper is organized as follows. In Sec. 2, we present the technical details of experimental method and first-principles molecular dynamics (MD) simulations. In Sec. 3, the comparison between experimental findings and simulation results are presented and discussed, while Conclusions are made in Sec. 4.
2. Methods
2.1 Experiments
Pd82Si18 alloys were prepared by arc melting the mixtures of pure Pd (99.99%) and Si (99.99%) in an ultra-high-purity argon atmosphere. The sample were sealed into a thin walled quartz capillary backfilled to ∼500 Torr high purity Ar, then, the samples were uniformly heated using a cylindrical Pt–Rh wound resistance furnace with a very low temperature gradient. The high energy X-ray diffraction were performed at four temperatures 1216, 1189, 1175, and 1132 K, respectively. These temperatures are all above the melting temperature of the system. The diffraction data were collected at the Advanced Photon Source (APS) of the Argonne National Laboratory (DuPage County, IL), using an energy of 99.55 keV, which corresponds to a wavelength (λ) of 0.0124(7) nm at beamline 6-ID-D. Silicon double-crystal monochromator was employed to select the wavelength. The HEXRD was captured in a time-resolved manner using a charge-coupled device (CCD, MAR Research, Evanston, IL) detector in an off-beam-axis mode, in which only a 60-deg arc of the Debye cones intersected the CCD. The sample-to-detector distance was calibrated using a National Institute of Standards and Technology (NIST) Si (640C) standard. Then the intensity data were converted to the total structure factor S(q) using PDFGetX2 with appropriate container and background subtractions and the reduced correlation function g(r) by Fourier transform.where r is a distance in real space and ρ is the atomic number density of the system.
2.2 Simulations
The first-principles MD simulations were performed using the Vienna ab initio simulation package (VASP) code based on the density functional theory.23,24 The projector-augmented wave method25,26 for core–valence–electron interactions and the Perdew–Burke–Ernzerhof form of exchange–correlation energy functional in general gradient approximation27 are adopted. A cubic supercell containing 200 atoms (164 Pd and 36 Si atoms) and periodic boundary condition is utilized in the simulation. Single Γ point is applied to sample the Brillouin zone of the supercell and the NVT ensemble (constant number of particles, constant volume, and constant temperature) with Nosé–Hoover thermostat is simulated.28,29 A time step of 3 fs is used. These atoms were randomly distributed initially, and then the system was sufficiently equilibrated at 2000 K to eliminate the effect of initial configuration. Then the sample was cooled down with a rate of 3.3 × 10¹³ K s−1 to the temperatures of interest, which are 1216 K, 1132 K, 1000 K and 900 K, respectively. At each temperature, after the system is thermally equilibrated and the pressure is turned to be essentially zero through the adjustment of the size of the simulation cell (it takes about 3000 MD steps), an additional 4000 MD steps (12 ps) are used for statistical sampling.3. Results and discussion
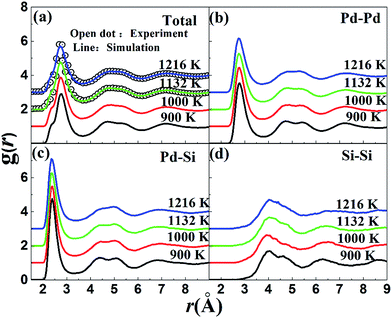
The pair correlation function (PCF), g(r), as a basic description of the structures of liquid, gives the possibility to find a particle at a distance r from each central atom normalized by the average density. The calculated total and partial PCFs of Pd82Si18 alloy for liquid and undercooled liquid are plotted in Fig. 1, along with HEXRD values at 1216 K and 1132 K. From Fig. 1(a), it can be seen that the simulated PCFs are well consistent with the experimental data. The excellent agreement between the simulation and the experiment suggests that the MD simulations can provide a reasonable description for the atomic structure of liquid Pd82Si18. The total PCF becomes sharper from 1216 K to 900 K, indicating an increase in SROs. And there is a pre-peak at ∼2.35 Å which is developed with decreasing temperature. Comparison of the total and partial PCFs reveals that the pre-peak of the total PCF mainly derives from the first peak of gPd–Si(r). Since the radius of the Pd atom is larger than that of Si atom, the location of the first peak of gPd–Pd(r) is obviously larger than that of gPd–Si(r), as can be seen from Fig. 1(b) and (c). The location of the first peak of gSi–Si(r) is at about 4 Å, which is significantly larger than the covalent bond of Si–Si bond. This finding demonstrates that there is no strong interaction between silicon atoms within the first coordination shell in the liquid state.Using the PCF described above, the coordination number (CN) can be calculated. The first minimum of the PCFs is chosen as the cutoff, which is 3.710 and 3.318 angstrom for Pd–Pd and Pd–Si respectively. It is worth mentioning that since the location of the first peak of gSi–Si(r) (∼4 Å) is already much larger than the typical Si–Si covalent bond length of ∼2.35 Å, the cutoff for calculating the Si–Si CN is not the first minimum in gSi–Si(r), but 3 Å. The total average and partial CNs of the liquid Pd82Si18 are given in Fig. 2. The CN of Si–Si is almost zero, indicating there is no strong interaction of Si–Si atoms. The other total and partial CNs exhibit a slight increase with decreasing temperature, which is reasonable as the system becomes denser when the liquid is cooled down. Besides, all the coordinated atoms around Si are Pd atoms and the number of Pd atoms is about 9. The coordination number of Pd atoms is about 13, of which there are 11 Pd atoms and 2 Si atoms.
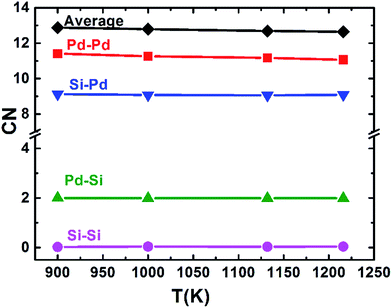 | ||
| Fig. 2 The average and partial CNs of liquid Pd82Si18 alloy at different temperatures (label A–B indicates the average number of atoms of element B in the first-neighbor shell of element A). | ||
To obtain more details information about the structures, the statistics of the nearest neighbor CN and their chemical identities around the Pd and Si centered atoms respectively at 900 K are analyzed. The same cutoff distances as used for CN calculation discussed above are used and the results are shown in Table 1. The upper part in Table 1 is Pd centered coordination number, and the bottom part is Si centered. In each part PdxSiy means that there are xPd atoms and ySi atoms around the centered atom. It is obvious that Si atoms are mainly 9 and 10 coordinated and their neighbor atoms are all Pd atoms. It should also be mentioned that the most populated of Si centered clusters are Pd9Si0, which is in good agreement with the CNs of the trigonal prism capped with three half-octahedra structure in ref. 12, suggesting the presence of the Si–9Pd structure. The Pd centered atoms are mainly 13 and 14 coordinated and the most abound clusters are Pd11Si2, Pd12Si2, Pd12Si1, revealing that Pd clusters tend to be the structure with high coordination numbers.
| CN | 7 | 8 | 9 | 10 | 11 | 12 | 13 | 14 | 15 | 16 |
|---|---|---|---|---|---|---|---|---|---|---|
| Pd | <1.0 | 2.2 | 16.0 | 35.9 | 31.6 | 12.1 | <2.0 | |||
| Pd11Si1: 8.2 | Pd12Si1: 10.1 | Pd12Si2: 18.1 | Pd13Si2: 5.4 | |||||||
| Pd10Si2: 6.7 | Pd11Si2: 19.8 | Pd11Si3: 8.6 | Pd12Si3: 5.2 | |||||||
| Pd10Si3: 5.8 | ||||||||||
| Si | <1.0 | 16.2 | 54.4 | 25.7 | 2.8 | <1.0 | ||||
| Pd8Si0: 16.2 | Pd9Si0: 54.0 | Pd10Si0: 24.7 |
For liquid binary alloy, chemical SRO (CSRO) is responsible for the temperature dependence of thermodynamic and structural properties, commonly characterized by the Warren-Cowley CSRO parameter αij.30 Which, αij can be calculated by:
| αij = 1 − Nij/cjNtotal, | (1) |
| T (K) | Pd–Pd | Si–Si | Pd–Si |
|---|---|---|---|
| 900 | −0.080 | 0.991 | 0.137 |
| 1000 | −0.074 | 0.983 | 0.135 |
| 1132 | −0.073 | 0.987 | 0.130 |
| 1216 | −0.067 | 0.982 | 0.125 |
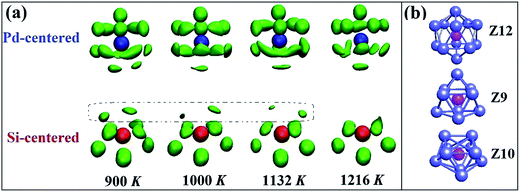
We further explore the SRO in liquid Pd82Si18 alloy by means of a recently developed atomic cluster alignment (ACA) method, which gives a direct visualization of the average local structure order.22 In the collective cluster alignment, two sets of Pd-centered and Si-centered clusters, respectively, each containing 2000 clusters, are randomly chosen from the first-principles MD simulation trajectories. The clusters in each set are then aligned by rigid rotation and translation with respect to each other. After the alignment, a Gaussian smearing scheme is performed on the result of collective-alignment to smooth the three-dimensional (3D) atomic distribution so that a 3D spatial-resolved distribution function can be obtained as plotted in Fig. 3(a). It shows the probability of the nearest-neighbor locations results of both Pd- and Si-centered clusters, respectively. Pd centered clusters have obvious five-fold symmetry and change little as temperature drops. However, their bottom parts are more disordered than the common icosahedron (Z12 in Fig. 3(b)), which is due to that Pd centered atoms prefer to higher coordinated clusters. In contrast, Si centered clusters are more sensitive to the temperature, as there are obvious differences in the upper part (marked by dot frame). However, the other part structures are almost the same with decreasing temperature, which are just similar to some part of the standard trigonal prism capped with three half-octahedra (also named Z9 Kasper polyhedral) and archimedean anti-prism (Z10). It can be inferred that Si-centered short range order is a combination of Z9 and Z10 clusters and the appearance and enhancement of the upper part of Si centered clusters with the temperature decrease may be related to the increase of Z9 clusters.
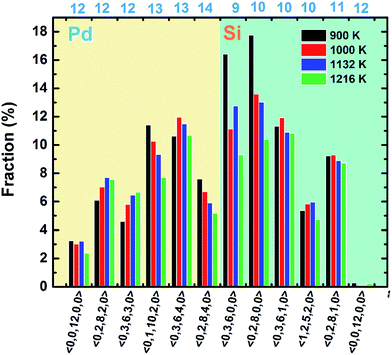
Then the VT method is used to analyze the polyhedral order quantitatively.31 In this method, all the mid-perpendicular plane between a central atom and its neighbors form the Voronoi polyhedron (VP) about the central atom, which is denoted by Voronoi index 〈n3, n4, n5, …, ni, …〉, where ni is the number of i-sided polygon of the VP. The total number of the faces of the VP equals to the CN of the central atom. The fraction of the respective top 5 most frequent Voronoi indices and icosahedrons (〈0, 0, 12, 0, 0〉) are depicted in Fig. 4. It is found that at 900 K the most abundant are 〈0, 3, 6, 0, 0〉, 〈0, 2, 8, 0, 0〉, 〈0, 3, 6, 1, 0〉, corresponding to the Z9, Z10 and distorted Z10 cluster. And the population of 〈0, 3, 6, 0, 0〉 and 〈0, 2, 8, 0, 0〉 increase shapely when temperature dropped from 1216 to 900 K, which is just associated with the appearance of dotted part in the result of collective-alignment in Fig. 3. As for Pd atoms, the main structures are 〈0, 1, 10, 2, 0〉, 〈0, 3, 6, 4, 0〉 and 〈0, 2, 8, 4, 0〉, showing that Pd atoms prefer high coordinations. Interestingly, the fraction of icosahedron 〈0, 0, 12, 0〉 increases and distorted icosahedrons decrease with temperature dropping to 900 K, implying the disordered icosahedrons may transform into the ideal ones.
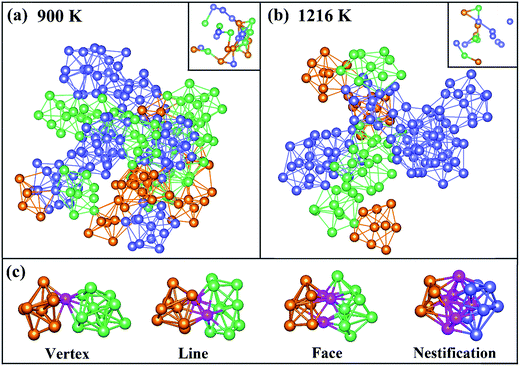
To directly observe the distribution of Z9, Z10 and icosahedron clusters, these clusters are picked out from the result of 〈0, 3, 6, 0, 0〉 (orange clusters), 〈0, 2, 8, 0, 0〉 (green ones) and 〈0, 0, 12, 0, 0〉 (blue ones) in VT method at 900 and 1216 K as shown in Fig. 5(a) and (b), respectively. The central atom of these clusters are also plotted in the top right corner, in which only atoms-sharing clusters are bonded. A chain of trigonal prisms capped with three half-octahedra and archimedean anti-prism was found in a realistic structural model of liquid Pd82Si18 alloy. It is of interest to be found that the neighbor atoms of centered Si atoms in Z9 and Z10 clusters are all Pd atoms, instead of Si atoms, which is consistent with previous result of the PCFs and CN. At 1216 K, there are only a small quantity of Z9 and Z10 clusters, which are connected to icosahedrons to form a chain-like structure. With temperature decreased to 900 K, that the Z9 and Z10 clusters increase sharply, leading to a larger chain, just as the connection way of icosahedron in Zr–Cu–Al system32 which implies that Z9 and Z10 cluster may play similar roles in the process of glass formation to icosahedrons. What's more, Z9 and Z10 cluster connect with each other in the way of vertex, line and face sharing. However, the connection types of Z9 (or Z10) and icosahedron are not only previous three sharing way, but also the nestification as shown in Fig. 5(c)
4. Conclusions
The local structure of the liquid Pd82Si18 alloy has been studied using first-principles MD simulations and validated using X-ray diffraction. The calculated pair-correlation functions compared well with the experimental results. The analysis of partial PCFs and CSRO indicate that there is a strong repulsion between Si atoms and Si atoms preferred to be evenly distributed in the liquid. ACA and Voronoi tessellation are carried out to describe the detailed 3D orders of the local atomic structures in the liquid. Trigonal prism capped with three half-octahedra and archimedean anti-prism dominants the local structure of Si centered clusters in the liquid Pd82Si18 alloy. These clusters connect to each other to form chains and networks with the connection of vertex, edge and face sharing. The results from our simulation and analysis provide useful insight into the structure evolution of Pd-based materials. The knowledge gained from the present study is also very useful for understanding the phase competition and glass formability in Pd–Si systems.Acknowledgements
Work at Fudan University was supported by the NSF of China (Grant No. 11374055 and 61427815), and National Basic Research Program of China (No. 2012CB934303 and 2010CB933703). W. S. Su is supported by the Ministry of Science and Technology of Taiwan (Grant No. MOST-104-2112-M-492-001). Support from the National Centers for Theoretical Sciences and High-performance Computing of Taiwan in providing huge computing resources to facilitate this research are also gratefully acknowledged. Work at Ames Laboratory was supported by the US Department of Energy, Basic Energy Sciences, and Division of Materials Science and Engineering, including a grant of computer time at the National Energy Research Supercomputing Centre (NERSC) in Berkeley, CA under Contract No. DE-AC02-07CH11358. Use of the Advanced Photon Source was supported under Contract No. DE-AC02-06CH11357.References
- A. Inoue, Mater. Trans., JIM, 1995, 36, 866–875 CrossRef CAS.
- A. Inoue, Acta Mater., 2000, 48, 279–306 CrossRef CAS.
- Y. Q. Zeng, S. C. Yang, H. Xiang, X. Z. Dong, L. Y. Chen, M. W. Chen, A. Inoue, X. H. Zhang and J. Q. Jiang, Intermetallics, 2015, 61, 66–71 CrossRef CAS.
- J. Schroers, Adv. Mater., 2010, 22, 1566–1597 CrossRef CAS PubMed.
- M. Chen, NPG Asia Mater., 2011, 3, 82–90 CrossRef.
- W. L. Johnson, MRS Bull., 1999, 24, 42–56 CrossRef CAS.
- W. H. Wang, C. Dong and C. H. Shek, Mater. Sci. Eng., R, 2004, 44, 45–89 CrossRef.
- P. H. Gaskell, Nature, 1978, 276, 484–485 CrossRef CAS.
- D. B. Miracle, Nat. Mater., 2004, 3, 697–702 CrossRef CAS PubMed.
- S. Y. Wang, C. Z. Wang, M. Z. Li, L. Huang, R. T. Ott, M. J. Kramer, D. J. Sordelet and K. M. Ho, Phys. Rev. B: Condens. Matter Mater. Phys., 2008, 78, 184204 CrossRef.
- P. H. Gaskell, J. Non-Cryst. Solids, 1979, 32, 207–224 CrossRef CAS.
- T. Fukunaga and K. Suzuki, Sci. Rep. Res. Inst., Tohoku Univ., Ser. A, 1980, 29, 153–175 Search PubMed.
- S. Kajita, S. Kohara, Y. Onodera, T. Fukunaga and E. Matsubara, Mater. Trans., 2011, 52, 1349–1355 CrossRef CAS.
- S. Saida, in New Functional Materials, Fundamentals of Metallic Glasses and their Applications to Industry, TECHNOSYSTEM, Japan, 2009, p. 33 Search PubMed.
- D. Gupta, K. N. Tu and K. W. Asai, Phys. Rev. Lett., 1975, 35, 796–799 CrossRef CAS.
- M. Müller, H. Beck and H. J. Güntherodt, Phys. Rev. Lett., 1978, 41, 983–987 CrossRef.
- K. Tanaka, T. Saito, K. Suzuki and R. Hasegawa, Phys. Rev. B: Condens. Matter Mater. Phys., 1985, 32, 6853–6860 CrossRef CAS.
- D. V. Louzguine-Luzgin, K. Georgarakis, V. Zadorozhnyy, N. Chen, K. Nakayama, G. Vaughan, A. R. Yavari and A. Inoue, Intermetallics, 2012, 20, 135–140 CrossRef CAS.
- T. Ohkubo and Y. Hirotsu, Mater. Sci. Eng., A, 1996, 217–218, 388–391 CrossRef.
- M. Durandurdu, Comput. Mater. Sci., 2012, 65, 44–47 CrossRef CAS.
- H. B. Lou, L. H. Xiong, A. S. Ahmad, A. G. Li, K. Yang, K. Glazyrin, H. P. Liermann, H. Franz, X. D. Wang, Q. P. Cao, D. X. Zhang and J. Z. Jiang, Acta Mater., 2014, 81, 420–427 CrossRef CAS.
- X. W. Fang, C. Z. Wang, Y. X. Yao, Z. J. Ding and K. M. Ho, Phys. Rev. B: Condens. Matter Mater. Phys., 2010, 82, 184204 CrossRef.
- G. Kresse and J. Hafner, Phys. Rev. B: Condens. Matter Mater. Phys., 1993, 47, 558–561 CrossRef CAS.
- G. Kresse and J. Furthmuller, Comput. Mater. Sci., 1996, 6, 15–50 CrossRef CAS.
- P. E. Blochl, Phys. Rev. B: Condens. Matter Mater. Phys., 1994, 50, 17953–17979 CrossRef.
- G. Kresse and D. Joubert, Phys. Rev. B: Condens. Matter Mater. Phys., 1999, 59, 1758–1775 CrossRef CAS.
- J. P. Perdew, K. Burke and M. Ernzerhof, Phys. Rev. Lett., 1996, 77, 3865–3868 CrossRef CAS PubMed.
- S. Nose, J. Chem. Phys., 1984, 81, 511–519 CrossRef CAS.
- W. G. Hoover, Phys. Rev. A, 1985, 31, 1695–1697 CrossRef.
- B. E. Warren, B. L. Averbach and B. W. Roberts, J. Appl. Phys., 1951, 22, 1493–1496 CrossRef CAS.
- J. L. Finney, Nature, 1977, 266, 309–314 CrossRef CAS.
- Y. Q. Cheng, E. Ma and H. W. Sheng, Phys. Rev. Lett., 2009, 102, 245501 CrossRef CAS PubMed.
| This journal is © The Royal Society of Chemistry 2017 |


