 Open Access Article
Colorimetric detection of HVA by self-assembly of Au nanorods with DNA double helices to give side-by-side and end-to-end structures†
Lin Chang‡
,
Younas Khan‡,
Lidong Li *,
Nan Yang,
Penggang Yin
 and
Lin Guo
Key Laboratory of Bio-Inspired Smart Interfacial Science and Technology of Ministry of Education, School of Chemistry and Environment, Beihang University, Beijing, 100191, P. R. China. E-mail: lilidong@buaa.edu.cn
First published on 1st March 2017
Abstract
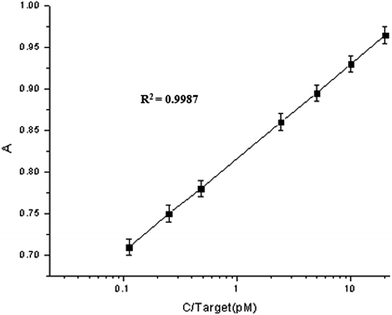
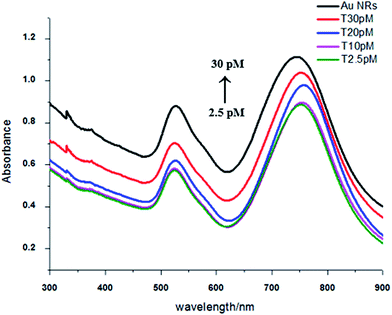
In this article we present the self-assembly of gold nanorods with DNA double helices into side-by-side and end-to-end structures by the addition of HVA (hepatitis A virus Vall7 polyprotein gene). Between every two gold nanorods, there is a distance of 10.2 nm which agrees with the length of DNA. By observing the change in color with the naked eye or UV-Vis spectral absorbance, HVA concentration can be quantitatively measured. The colorimetric detection has a linear relationship between the UV-Vis spectral absorbance and the concentration, with a detectable range of 0.05 pM to 35 pM. The standard deviation “R2” value was found to be >0.99. This method is simple, time economic and highly sensitive, and a lower limit of detection up to 0.05 pM HVA can be achieved with great selectivity.
1. Introduction
Self-assembly promotes many good properties in nanoparticles such as unique optical, magnetic and electric properties and so on, which leads many scientists to pay close attention to self-assembly in nanoscale particles.1–5 Gold nanorods (Au NRs) have attracted wide interest due to their good optical properties, which result from the localized surface plasmon resonance, relative to the local dielectric environment.6–9 Self-assembled Au NRs have many potential applications in biology and science.10 A number of methods, for example using nano-templates,11 crystallization,12 bio-molecules,13 and small molecules14 have been reported to transform dispersed nanoparticles into desirable assembled structures. Many substances such as DNA,15 organic molecules,17–19 polymers,20 biotin-stre-pavidin connectors,21 and those in the antibody–antigen reaction16 can bring Au NRs together into ideal patterns through base pairing or physical and chemical affinities. Among these, DNA is a similar size to nanoscale particles and has a strong affinity for forming inter-connected structures22 based on oligonucleotide–gold nanorod conjugates (DNA–Au NR) by base sequence matching.Due to their size and distance dependent optical properties and chemical stability, oligonucleotide–gold nanoparticle conjugates are found to be promising colorimetric probes. Until now, DNA–AuNP conjugates have been widely applied in the detection field, monitoring certain specific metal ions, organic molecules and some large molecules.23–27 Nam J. M.28 has used DNA–AuNPs to detect cancer biomarker proteins (PSA) with good sensitivity up to 3 attomolar. Jae-Seung Lee29 has applied DNA-functionalized gold nanoparticles to the detection of Hg2+. Moreover, Min Su Han30 reported a simple detection method for an organic molecule using DNA-functionalized gold nanoparticles.
Hepatitis A is an acute infectious disease of the liver caused by the hepatitis A virus (HAV).31 Many cases have little to no symptoms especially in the young. The time between infection and symptoms is two to six weeks. When symptoms occur, they usually last eight weeks, with a fever, jaundice, diarrhea and abdominal pain. It usually spreads through close contact such as by drinking contaminated water or eating contaminated food with an infectious person.32 The hepatitis A virus Vall7 polyprotein gene (HVA) is the kind of polyprotein that exists in HAV, and can be used as a biomarker for HAV to identify infected people so that we can prevent the virus spreading. A number of methods have been used for the detection of HVA such as magnetic fluorescence33 with a detection limit up to 0.1 pM, Raman spectroscopy34 with a detection limit up to 1 pM, antibodies based on enzyme immunoassays (EIAs) and radio-immuno assays (RIAs)35 with detection limits up to 1 pM and an SPR based colorimetric method with a detection limit up to 10 pM.36 But all these methods are quite complicated while some have limitations regarding sensitivity for detecting very small concentrations of HVA, so we need to develop an easy, sensitive and highly reliable method for early HVA detection.
In this work, we demonstrate the synthesis of Au NRs and the controllable self-assembly of Au NRs into novel structures including side-by-side and end-to-end structures through base pairing with DNA. Based on programmed assembly, we developed a colorimetric method observing a change in solution color from purple to light pink and used it in the early detection of the hepatitis A virus Vall7 polyprotein gene (HVA). Our method has some obvious advantages over the prevalent methods, firstly it is simple, easy and less time consuming. Secondly, it was found to be very sensitive for HVA. Finally, it is the first time that we have combined self-assembly and colorimetry to detect HAV and with a good result.
2. Experimental section
2.1 Chemicals
All the DNA and real blood serum samples were bought from Sangon Biotech (Shanghai) Co., Ltd. The sequences are listed in Table 1. HAuCl4·4H2O was bought from Shenyang Jinke reagent company. Hexadecyltrimethylammonium bromide (CTAB), hexadecyltrimethylammonium chloride (CTAC), sodium oleate (NaOL), silver nitrate (AgNO3), sodium borohydride (NaBH4), hydrochloric acid (HCl, 12.1 M), ascorbic acid (AA), tris(2-carbonylethyl) phosphorus hydrochloride (TCEP), tris(hydroxyethyl)methyl amino methane (C4H11NO3), magnesium chloride (MgCl2), and sodium dodecyl sulfate (SDS) were brought from Beijing Chemical Works. All the reagents were analytical grade.| DNA name | Sequence (5′ → 3′) |
|---|---|
| Helper | AAA AAA AAA AAA C(6)-SH |
| Target DNA | TTAGAGTTGCATGGATTAACTCCTCTTTCT |
| Capture DNA 2 | HS-C(6) AGAAAGAGGA |
| Control DNA 1 | TAAAAGTTGCAGGGATTAACCCCCCTTTCT |
| Control DNA 2 | TTTGATTTGCAGGGTTTAAATCCTCTTTCT |
2.2 Instruments
Scanning electron microscope (SEM) images were obtained using a Hitachi S-4800. SEM samples were prepared by dropping the test solution onto a silicon chip and leaving it at room temperature until the solvent evaporated. Transmission electron microscopic (TEM) information was obtained using a JEM-2010F operating under a 200 kV acceleration voltage. By dropping the sample solution onto a copper grid with 300 mesh, the test samples were prepared. UV-Vis spectra were obtained using an Alpha-1860C. The samples were prepared by dropping the solution into Ultra-Micro Cells with a thickness of 1 cm and the data was processed and acquired using Origin Lab software.2.3 Preparation of Au NRs
The seed solution was synthesized as follows. Typically, 5 mL of 0.5 mM HAuCl4 and 5 mL of 0.2 M CTAB solutions were mixed in a 20 mL transparent vial. Then 1 mL of 0.006 M fresh NaBH4 solution was added into the vial abovementioned under stirring at a speed of 1200 rpm for 2 min. The color of the solution transformed from yellow to brownish yellow. Then the vials were placed at room temperature for aging for up to 30 min. Next, we prepared the growth solution as follows: 1.234 g of NaOL and 6.15 g of CTAC were dissolved in 250 mL of water at 50 °C, and were then transferred into a flask. When the temperature had cooled down to 30 °C, 18 mL of 4 mM AgNO3 solution and 250 mL of 1 mM HAuCl4 solution were added. Then the mixture was left at 30 °C for 15 min, followed by stirring at 7000 rpm for 150 min. Subsequently, 5.0 mL of 12.1 M HCl was employed to adjust the solution to the proper pH which was followed by slow stirring at 400 rpm. Before strong stirring for 30 s, 1.25 mL of 0.064 M AA was introduced. Finally, 0.8 mL of seed solution was dropped into the growth solution and afterwards the mixture was stirred for 30 s, then it was kept still which was helpful for the NR’s growth. The produced Au NRs were purified by centrifugation of the products for 25 min at 6000 rpm which was repeated 3 times.372.4 Pretreatment of DNA
Before using DNA as an interconnector, we added a certain amount of TCEP into the DNA solution (DNA was dissolved in 0.001 M Tris–HCl buffer which included 20 mM MgCl2 and 0.01% SDS), then the DNA was heated to 90 °C for 5 min to make it more flexible for the following base pairing. TCEP could reduce the disulfide bonds into individual –SH groups which were intended to react on the gold surface.382.5 Self-assembly of Au NRs
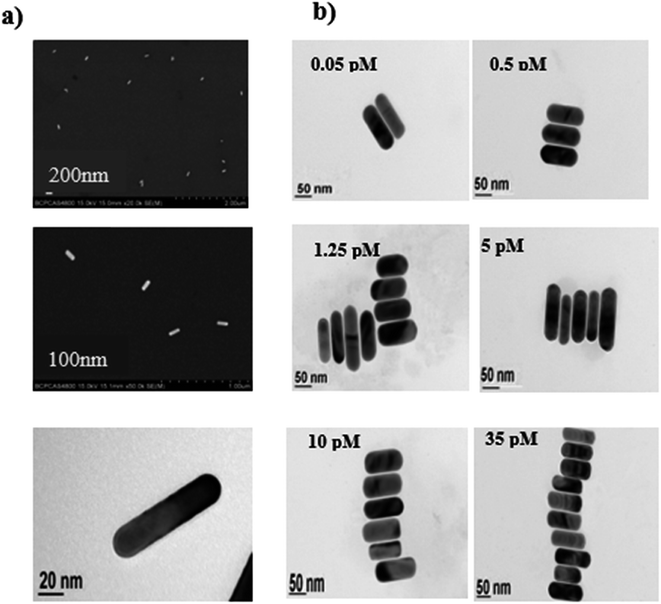
Freshly synthesized Au NRs were observed under the SEM (Fig. 1a) and have a length of 90 ± 5 nm and a width of 25 ± 5 nm and were well dispersed. To obtain side-by-side structures, two vials were needed. Helper DNA was added into two vials of Au NRs and incubated for 12 h at room temperature. Before incubating for another 12 h, capture DNA 1 and capture DNA 2 in the same quantities were injected into each vial respectively. Then the two vials were mixed together in a big vial and target DNA was introduced into the big vial. The vial was then heated to 95 °C for 5 min and then the vial was allowed to cool down to room temperature. The helper DNA does not match any other DNA during the process of self-assembly. It is just a kind of DNA to be used as a barrier to control the regioselectivity of the self-assembly, so that we can obtain side-by-side structures. Capture DNA 1 and capture DNA 2 are employed in both the side-by-side structure and end-to-end structure to match with part of the complementary target DNA simultaneously at the ends. The target DNA is like a person with two hands, on the left it joins one of its hands with capture DNA 1 while on the right it joins the other hand with capture DNA 2. To obtain end-to-end structures, the process was similar to the process for side-by-side assembly but in the absence of the helper DNA. Capture DNA 1 and capture DNA 2 were injected into two separate vials and incubated for 12 h. Then the two vials were mixed together in a big vial and target DNA was introduced into the big vial. The vial was then heated to 95 °C for 5 min and then the vial was allowed to cool down to room temperature.3. Results and discussion
3.1 Preparation of NR assemblies into regiospecific geometries
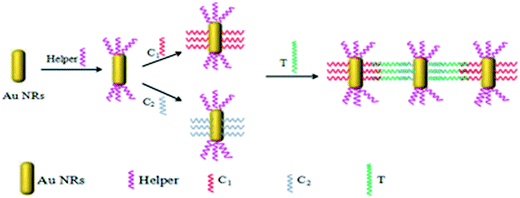
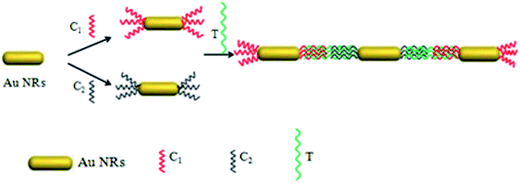
Regular NRs (length: 90 nm; width: 25 nm) were synthesized by a classical seed-mediated growth method. Then their surfaces were modified by single-stranded DNA (ssDNA) at the ends (see Schemes 1 and 2).During the process of the synthesis, there was still cetyltrimethylammonium bromide (CTAB) which remained coated on the surface of the Au NRs. CTAB preferred to bind to the {100} facet which was the longitudinal side of the Au NRs, and left the {110} facet ends of the Au NRs with a thinner coating39,40 than on their sides. So when in a low concentration of thiolated DNA, it will only attach at the ends and control the geometry.
In this work, two self-assembly methods of Au NRs are presented, side-by-side and end-to-end. These two distinct structures were obtained using different thiolated DNA samples with some specific sequences in an appropriate concentration. As such, we denoted a 10 base thiolated DNA sample with a sequence of GCAACTCTAA C(6)-SH as capture DNA 1 (C1: red in Scheme 1) and another 10 base thiolated DNA sample with a sequence of HS-C(6) AGAAAGAGGA as capture DNA 2 (C2: blue in Scheme 1). These two DNA samples had the same function, base pairing with a 30 base target DNA sample (T: green in Scheme 1) at each of the ends which had a sequence of TTA, GAG, TTG, CAT, GGA, TTA, ACT, CCT, CTT, or TCT. An assistant thiolated DNA sample was also employed named helper DNA (H: purple in Scheme 1) with a 15 base simple sequence of AAA AAA AAA AAA C(6)-SH. The helper DNA is helpful to control the regioselectivity in the self-assembly process, especially during the side-by-side process, but does not match with any other oligomers.
3.2 Side-by-side self-assembly
Because the ends have less CTAB on their surface and the ends of Au NRs are more active than the sides of Au NRs,41 when the helper DNA at an appropriate concentration was added it had a preference to be absorbed at the ends (Scheme 1), which meant that the Au NRs’ ends were occupied and that the sides were relatively more active. Then the Au NRs were modified with C1 (capture DNA 1) or C2 (capture DNA 2) on their sides, and once a concentration of target DNA between 0.05 pM and 40 pM was injected, there was an effective side-by-side self-assembly (TEM; Fig. 1b) which increased with the increase in target DNA concentration. After self-assembly, the optical properties were similar to nanowires (NWs), which was demonstrated using UV-Vis spectroscopy (Fig. 2).42,43 With the increase in concentration of the target DNA in the range of 0.05–40 pM, the “nanowires” became fat, which was confirmed by a peak shift. The transverse peaks were inclining to blue shift (shorter wavelength) from 525 nm to 521 nm and decrease in amplitude while the longitudinal surface plasmon peaks red shifted (longer wavelength) from 742 nm to 751 nm and decreased in amplitude compared to the Au NRs’ peaks. When the concentration of target DNA was lower than 0.05 pM, side-by-side self-assembly was not observed. When the concentration of target DNA was higher than 35 pM, the Au NRs aggregated. Under these two situations, we did not see the behavior of self-assembly, so in our work a target DNA concentration of 0.05–35 pM was found to be optimum under our experimental conditions.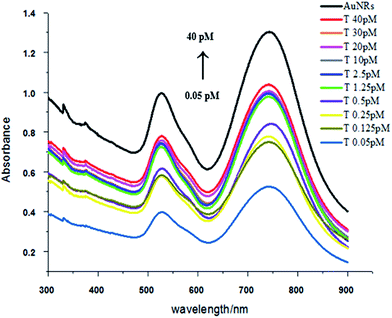 | ||
| Fig. 2 UV-Vis spectrum of side-by-side assembly with a target DNA concentration range of 0.05–35 pM (the concentration of C1 and C2 was 33 pM, and helper was 10 pM). | ||
3.3 End-to-end self-assembly
Compared with the side-by-side structures, the procedure is easier to get end-to-end assembly structures. As show in Scheme 2, end-to-end assembly can be obtained without the addition of helper DNA. Because the ends of the Au nanorod are more active than the sides, adding an appropriate amount of C1 and C2 DNA will firstly attach to the ends of the Au nanorod, and later addition of HVA will result in end-to-end assembly structures (TEM; Fig. 4). Similarly, with the concentration increase of target DNA, the nanowires became longer which was confirmed by peak shifting in the UV-Vis spectra compared to Au NRs’ peaks. The transverse peaks remained unchanged in amplitude and wavelength while the longitudinal surface plasmon peaks red shifted (longer wavelength) from 745 nm to 749 nm and decreased in amplitude compared with Au NRs’, as shown in Fig. 5. However, there is not a good calibration curve for the end-to-end structures (Fig. S1†).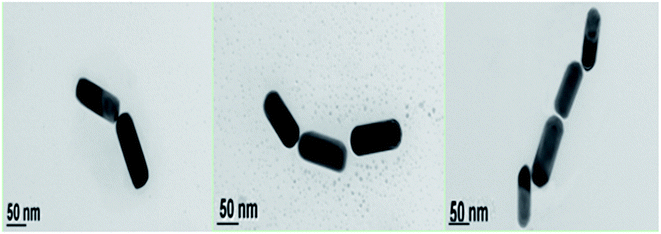 | ||
| Fig. 4 TEM images of Au NRs assembled into end-to-end structures (the concentration of C1 and C2 was 33 pM), the scale bar is 50 nm. | ||
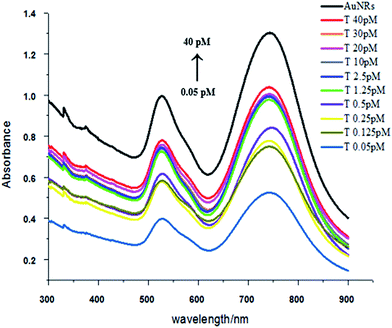 | ||
| Fig. 5 UV-Vis spectra of end-to-end assembly with a target DNA concentration range of 0.05–40 pM (the concentration of C1 and C2 was 33 pM). | ||
3.4 The selectivity of the colorimetric method
Another vital factor for a colorimetric method is its selectivity which was tested here using a control experiment. Simultaneously, equal concentrations of 1.0 μL double deionized water, 1.0 μL HVA, 1.0 μL control DNA 1 and 1.0 μL control DNA 2 were added into two solutions, one containing capture DNA 1 at 33 pM and one containing capture DNA 2 at 33 pM, which were both incubated at room temperature for 12 h and then mixed together. Observed from the colors of the solutions, only the vial where we added the target DNA had faded a little while the colors of the competitors stayed the same color as with the Au NRs. The results show that this method has good selectivity as shown in Fig. S3† and 6.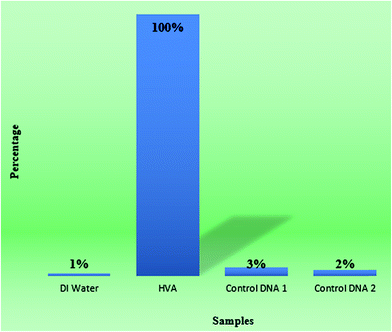 | ||
| Fig. 6 The bar graph between second deionized water, 1 microlitre HVA, 1 microlitre control DNA 1 and 1 microlitre control DNA 2 shows the selectivity of the method, quantitatively. | ||
3.5 Real sample analysis
Many interruptions may occur when a real blood serum sample is employed in this analysis owing to the complexity of a real blood serum sample which can introduce some unknown bonding to the bulk sample. So we needed do some investigations to ensure whether the method was applicable to a real blood serum sample. Firstly, we diluted the blood serum fifty-times, aiming to decrease the background noise in the real sample analysis application. Then under different concentrations of HVA with diluted serum, artificial physiological matrix and spiked serum samples were tested. The experimental data suggests that the method is applicable since the absorbance of the real blood serum samples was only decreased by 0.02 compared to the HVA in double deionized water sample, which was used as the background. So the dilution of a real blood serum sample to a large extent is good to diminish the background noise.Then we applied the method to the real blood serum sample (Fig. 7) to test whether HVA gave similar results as in the previous experiment, and simultaneously we calculated the recovery of HVA as shown in Table 2. Recovery of HVA was calculated as the ratio between the concentration of added HVA and the detected concentration of HVA. In the table, we obtained very good recoveries between 90% and 94%, which suggests the method has a promising future for use in biological samples.
| (Target) C0/pM | A | (Target) C/pM | Recovery (%) |
|---|---|---|---|
| 0.125 | 0.6998 | 0.1125 | 90 |
| 0.25 | 0.7366 | 0.23 | 92 |
| 0.5 | 0.7812 | 0.475 | 95 |
| 1.25 | 0.8452 | 1.1625 | 93 |
| 2.5 | 0.8801 | 2.30 | 94 |
| 10 | 0.9485 | 9.4 | 94 |
| 20 | 0.9934 | 18.6 | 93 |
| 30 | 1.025 | 28.2 | 94 |
4. Conclusions
Self-assembled oligonucleotide gold nanoparticle conjugates (DNA–AuNP) are found to be promising probes in bio-detection. We described the self-assembly of Au NRs synthesized by a seed-mediated growth method into novel structures: side-by-side and end-to-end. An assay based on the side-by-side structures was developed to detect HVA, a polyprotein in hepatitis A virus. We found our method to be very sensitive with a lower limit of detection up to 0.05 pM. We achieved a linear relationship between the absorbance and the concentration in the range of 0.05 pM to 35 pM with a standard deviation “R2” value >0.99. The novel side-by-side structure was attractive because it was convenient and rapid to synthesize and could be promising in detecting a variety of bio-molecules.Acknowledgements
This work was financially supported by the National Natural Science Foundation of China (no. 21273001, 20973019, 20903008, and 50725208), with Key Project Funding by the NSFC (50831001 and 20973019), the NSFC for Outstanding Young Talents (507252008 and 10825419) and the National Basic Research Program of China (2014CB931802, 2010CB934700, and 2009CB623700).References
- R. D. Robinson, B. Sadtler, D. O. Demchenko, C. K. Erdonmez, L. W. Wang and A. P. Alivisatos, Spontaneous superlattice formation in nanorods through partial cation exchange, Science, 2007, 317(5836), 355–358 CrossRef CAS PubMed.
- S. J. Hurst, E. K. Payne, L. Qin and C. A. Mirkin, Multisegmented one-dimensional nanorods prepared by hard-template synthetic methods, ChemInform, 2006, 37(30), 2672–2692 CrossRef.
- W. L. Shi, H. Zeng, Y. Sahoo, T. Ohulchanskyy, Z. L. Wang, M. SwiharAt and P. N. Prasad, A general approach to binary and ternary hybrid nanocrystals, Nano Lett., 2006, 6, 875–881 CrossRef CAS PubMed.
- Y. J. Min, M. Akbulut, G. Y. KristiansenK and K. Israelachvili, The role of interparticle and external forces in nanoparticle assembly, Nat. Mater., 2008, 7(7), 527–538 CrossRef CAS PubMed.
- N. Zhao, K. Liu, J. Greener, Z. Nie and E. Kumacheva, Close-packed superlattices of side-by-side assembled Au–CdSe nanorods, Nano Lett., 2009, 9(8), 3077–3081 CrossRef CAS PubMed.
- M. A. El-Sayed, Some interesting properties of metals confined in time and nanometer space of different shapes, ChemInform, 2001, 34, 257–264 CAS.
- C. T. Murphy, T. K. Sau, A. M. Gole, C. J. Orendorff, J. Gao, L. Gou, S. E. Hunyadi and T. J. Li, Anisotropic metal nanoparticles: synthesis assembly, and optical applications, J. Phys. Chem. B, 2005, 109, 13857–13870 CrossRef CAS PubMed.
- S. Link, M. B. Mohamed and M. A. El-Sayed, Simulation of the optical absorption spectra of gold nanorods as a function of their aspect ratio and the effect of the medium dielectric constant, J. Phys. Chem. B, 1999, 109(20), 3073–3077 CrossRef.
- D. P. Sprunken, H. Omi, K. Furukawa, H. Nakashima, I. Sychugov, Y. Kobayashi and K. Torimitsu, Influence of the local environment on determining aspect-ratio distributions of gold nanorods in solution using Gans theory, J. Phys. Chem. C, 2007, 111(39), 14299–14306 Search PubMed.
- H. Nakashima, K. Furukawa and Y. Kashimura, et al., Self-assembly of gold nanorods induced by intermolecular interactions of surface-anchored lipids, Langmuir, 2008, 24(11), 5654–5658 CrossRef CAS PubMed.
- S. M. Marinakos, L. C. Brousseau, A. Jones and D. L. Feldheim, Template synthesis of one-dimensional Au, Au–poly(pyrrole), and poly(pyrrole) nanoparticle arrays, Chem. Mater., 1998, 10(5), 1214–1219 CrossRef CAS.
- S. A. Harfenist, Z. L. Wang, R. L. Whetten, I. Vezmar and M. M. Alvarez, Three-dimensional hexagonal close-packed superlattice of passivated Ag nanocrystals, Adv. Mater., 1997, 9(10), 817–822 CrossRef CAS.
- C. J. Loweth, C. W. Brett and X. Peng, et al., DNA-based assembly of gold nanocrystals, Angew. Chem., Int. Ed., 1999, 38(12), 1808–1812 CrossRef CAS.
- X. Peng, T. E. Wilson, A. P. Alivisatos and P. G. Schultz, Synthesis and isolatin of a homodimer of cadmium selenide nanocrystals, Angew. Chem., Int. Ed., 1997, 36(1–2), 145–147 CrossRef CAS.
- E. Dujardin, L. B. Hsin, C. R. C. Wang and S. Mann, DNA-driven self-assembly of gold nanorods, Chem. Commun., 2001,(14), 1264–1265 RSC.
- J. Y. Chang, H. M. Wu, H. Chen, Y. C. Ling and W. H. Tan, Oriented assembly of Au nanorods using biorecognition system, Chem. Commun., 2005,(8), 1092–1094 RSC.
- M. M. Kathryn, S. Y. Lee, H. W. Liao, B. C. Rostro, A. Fuentes, P. T. Scully, C. L. Nehl and J. H. A. Hafner, Label-free immunoassay based upon localized surface plasmon resonance of gold nanorods, ACS Nano, 2008, 2(4), 687–692 CrossRef PubMed.
- C. X. Yu and J. Irudayara, Multiplex biosensor using gold nanorods, Anal. Chem., 2007, 79, 572–579 CrossRef CAS PubMed.
- W. He, C. Z. Huang, Y. F. Li, J. P. Xie, R. G. Yang, P. F. Zhou and J. Wang, One-step label-free optical genosensing system for sequence-specific DNA related to the human immunodeficiency virus based on the measurements of light scattering signals of gold nanorods, Anal. Chem., 2008, 80(22), 8424–8430 CrossRef CAS PubMed.
- R. B. Grubbs, Nanoparticle assembly: solvent-tuned structures, Nat. Mater., 2007, 6(8), 553–555 CrossRef CAS PubMed.
- H. Park, A. Agarwal, N. A. Kotov and O. D. Lavrentovich, Controllable side-by-side and end-to-end assembly of Au nanorods by lyotropic chromonic materials, Langmuir, 2008, 24(24), 13833–13837 CrossRef CAS PubMed.
- C. J. Loweth, C. W. Brett and X. Peng, et al., DNA-based assembly of gold nanocrystals, Angew. Chem., Int. Ed., 1999, 38(12), 1808–1812 CrossRef CAS.
- I. Stoeva Savka, J.-S. Lee and T. C. Shad, et al., Multiplexed DNA detection with biobarcoded nanoparticle probes, Angew. Chem., Int. Ed., 2006, 45(20), 3303–3306 CrossRef CAS PubMed.
- C. M. Niemeyer and U. Simon, DNA-based assembly of metal nanoparticles, Eur. J. Inorg. Chem., 2005, 18, 3641–3655 CrossRef.
- D. J. Maxwell, J. R. Taylor and S. Nie, Self-assembled nanoparticle probes for recognition and detection of biomolecules, J. Am. Chem. Soc., 2002, 124(32), 9606–9612 CrossRef CAS PubMed.
- M. G. Cerruti, M. Sauthier, D. Leonard, D. Liu, G. Duscher, D. L. Feldheim and S. Franzen, Gold and silica-coated gold nanoparticles as thermographic labels for DNA detection, Anal. Chem., 2006, 78(10), 3282–3288 CrossRef CAS PubMed.
- L. He, M. D. Musick, S. R. Nicewarner, F. G. Salinas, S. J. Benkovic, M. J. Natan and C. D. Keating, Colloidal Au-enhanced surface plasmon resonance for ultrasensitive detection of DNA hybridization, J. Am. Chem. Soc., 2000, 122(122), 9071–9077 CrossRef CAS.
- J. M. Nam, C. S. Thaxton and C. A. Mirkin, Nanoparticle-based bio-barcodes for the ultrasensitive detection of proteins, Science, 2003, 301(5641), 1884–1886 CrossRef CAS PubMed.
- J. S. Lee, M. S. Han and C. A. Mirkin, Colorimetric detection of mercuric ion (Hg2+) in aqueous media using DNA-functionalized gold nanoparticles, Angew. Chem., Int. Ed., 2007, 46, 4093–4096 CrossRef CAS PubMed.
- M. S. Han, A. K. R. Lytton-Jean and C. A. Mirkin, A gold nanoparticle based approach for screening triplex DNA binders, J. Am. Chem. Soc., 2006, 128(15), 4954–4955 CrossRef CAS PubMed.
- K. J. Ryan and C. G. Ray, Sherris Medical Microbiology, McGrawHill, 4th edn, 2004, pp. 541–544, ISBN 0-8385-8529-9 Search PubMed.
- S. C. Matheny, J. E. Kingery and A. Hepatitis, Am. Fam. Physician, 2012, 86(11), 1027–1034 Search PubMed.
- Y. Liu, X. Zhang, E. Yifeng and F. Fang, et al., Sandwich Immunoassays of Multicomponent Subtrace Pathogenic DNA Based on Magnetic Fluorescent Encoded Nanoparticles, BioMed Res. Int., 2015, 2016, 1–9 Search PubMed.
- J. Irudayaraj, Biomedical Nanosensors, Pan standford, 2012, vol. 3, pp. 104–106, ISBN (978-9-81430-304) Search PubMed.
- D. Liu, Molecular detection of human viral pathogens, CRC press united states, 2011, vol. 13, pp. 28–30, ISBN(978-1-4398-1237-2) Search PubMed.
- Y. Liu and W. Fang, et al., A one-tube multiplexed colorimetric strategy based on plasmonic nanoparticles combined with non-negative matrix factorization, Talanta, 2014, 128, 305–310 CrossRef CAS PubMed.
- M. S. Han, A. K. R. Lytton-Jean and C. A. Mirkin, A gold nanoparticle based approach for screening triplex DNA binders, J. Am. Chem. Soc., 2006, 128(15), 4954–4955 CrossRef CAS PubMed.
- X. Ye, Y. Gao and J. Chen, et al., Seeded growth of monodisperse gold nanorods using bromide-free surfactant mixtures, Nano Lett., 2013, 13(5), 2163–2171 CrossRef CAS PubMed.
- L. D. Li, H. T. Zhao and Z. B. Chen, et al., Aptamer biosensor for label-free impedance spectroscopy detection of thrombin based on gold nanoparticles, Sens. Actuators, B, 2011, 157(1), 189–194 CrossRef CAS.
- L. B. Wang, Y. Y. Zhu, L. G. Xu, W. Chen, H. Kuang, L. Q. Liu, A. Agarwal, C. L. Xu and N. A. Kotov, Angew. Chem., Int. Ed., 2010, 49, 5472 CrossRef CAS PubMed.
- Z. H. Nie, D. Fava, M. Rubinstein and E. Kumacheva, “Supramolecular” assembly of gold nanorods end-terminated with polymer “pom-poms”: effect of pom-pom structure on the association modes, J. Am. Chem. Soc., 2008, 130, 3683 CrossRef CAS PubMed.
- L. Xu, H. Kuang and C. Xu, et al., Regiospecific plasmonic assemblies for in situ Raman spectroscopy in live cells, J. Am. Chem. Soc., 2012, 134(3), 1699–1709 CrossRef CAS PubMed.
- J. M. Humphrey, J. B. Aggen and A. R. Chamberlin, Total synthesis of the serine-threonine phosphatase inhibitor microcystin, J. Am. Chem. Soc., 1996, 118, 11759–11770 CrossRef CAS.
Footnotes |
| † Electronic supplementary information (ESI) available. See DOI: 10.1039/c6ra28408f |
| ‡ Both authors contributed equally to this work. |
| This journal is © The Royal Society of Chemistry 2017 |

