 Open Access Article
Natural phosphorus-doped honeycomb carbon materials as oxygen reduction catalysts derived from Pulsatilla chinensis (Bunge) Regel
Lei Zhao *ab
*ab
aDepartment of Chemistry, Tsinghua University, Haidian District, Beijing 100084, China. E-mail: leizhao_qinghua@sina.com; Tel: +86-755-26036729
bGraduate School at Shenzhen, Tsinghua University, University Town, Nanshan District, Shenzhen 518055, China
First published on 1st March 2017
Abstract
Facile phosphorus (P)-doped carbon materials based on Pulsatilla chinensis (Bunge) Regel (PCR) were directly used in oxygen reduction reaction (ORR). The half-peak potential of PCR carbonized at 1000 °C (PCR-1000) was 30 mV lower than that of the commercial Pt/C (20%) catalysts. The PCR-1000 showed 87.0% of the initial current density after 20![[thin space (1/6-em)]](https://www.rsc.org/images/entities/char_2009.gif) 000 s stable testing at the rotation of 1600 rpm in O2-saturated 0.1 M KOH. This study provides a method for the preparation of P-doped ORR catalysts derived from biomass. In addition, the honeycomb structure carbon materials can also provide a carrier for other applications including composite catalysts in fuel cells and electrode materials in supercapacitors.
000 s stable testing at the rotation of 1600 rpm in O2-saturated 0.1 M KOH. This study provides a method for the preparation of P-doped ORR catalysts derived from biomass. In addition, the honeycomb structure carbon materials can also provide a carrier for other applications including composite catalysts in fuel cells and electrode materials in supercapacitors.
Introduction
Fuel cells are considered as a renewable energy technology and have been widely researched in recent years for their merits of high energy density and zero emission.1 However, the progress of fuel cells is limited due to the sluggishness of the ORR in the cathode.2,3 At present, platinum and its alloys are the most effective ORR catalysts. However, their applications are restricted because of their high-cost. Therefore, the development of inexpensive and alternative cathodic catalysts is desirable in the area of fuel cells. Based on these conditions, many researchers developed many metal-free catalysts. Nitrogen-doped carbon materials were extensively used for their high ORR activity in ORR since the first report of high ORR activity of vertically aligned N-doped carbon nanotubes by Dai and co-workers in 2009.4 Phosphorus has the same number of valence electron as nitrogen; in addition, the larger atomic size and lower electronegativity of P can introduce a defect-induced active surface and local charge density through its lone pair electrons in the 3p orbital, which should be facilitated by O2 adsorption in the ORR.1,5 However, the development of P-doped carbon materials in ORR is sluggish compared with the quick development of nitrogen-doping. Recently, some phosphorus sources such as phosphate,6 triphenylphosphine,7–9 phosphoric acids,10–12 and ionic liquid13 were used for P-doped carbon materials. P-doped graphite layers and P-doped graphitic carbon nanospheres all exhibited high electrocatalytic activity. However, their tedious synthesis process and low P-doped content restricted their industrial applications. Although different chemical methods were used for the preparation of P-doped catalysts, the results were unsatisfactory for difficult doping and not retaining the P element at high temperature. Apart from this point, Strelko et al. researched the mechanism of the influence of P doping in a carbon matrix and, from a theoretical study of the band gap energy, found that the dopant content was related to the catalytic activity.14 We found that the content with better ORR catalytic effects in P-doped carbon materials was not larger than 3 at% in many previous reports. Based on these two reasons, we considered to realize P-doping from biomass.5–13,15 Biomass has many nutrients including different elements, especially P that is very important for biomass growth. P in the biomass is contained in various structures, which may contribute to increasing the diversity of P-doping. We considered that the natural P-doping in biomass may obtain the uniform structures and different phosphorus groups. At present, there are few reports on the P-doped catalysts from biomass including yeast cells5 and coconut shells15 as precursors.Herein, we reported facile P-doped carbon materials used in ORR for the first time. The PCRs in this study were obtained from Xiao Hinggan Mountains in the northeast of China, which were distributed in hills, slopes or fields. The carbonization of the PCR biomass material is a low-cost, simple, and readily scalable approach for the synthesis of P-doped honeycomb carbon materials. In this study, the larger phosphorus content in the carbonization of the PCR biomass was 1.46 at%, which was compared with the contents obtained from chemical P-doping methods. Moreover, the carbonized PCR exhibited superior properties in the ORR. The half-peak potential of PCR-1000 was 30 mV lower than that of the commercial Pt/C (20%) catalyst, and 87.0% of the initial current density was maintained after 20![[thin space (1/6-em)]](https://www.rsc.org/images/entities/char_2009.gif) 000 s of stable testing at the rotation of 1600 rpm in O2-saturated 0.1 M KOH. These results demonstrated that the method derived from the P-doped biomass materials not only demonstrated superior properties in ORR but also showed the implementation of a novel idea for the difficult preparation of P-doped catalysts in fuel cells.
000 s of stable testing at the rotation of 1600 rpm in O2-saturated 0.1 M KOH. These results demonstrated that the method derived from the P-doped biomass materials not only demonstrated superior properties in ORR but also showed the implementation of a novel idea for the difficult preparation of P-doped catalysts in fuel cells.
Experimental
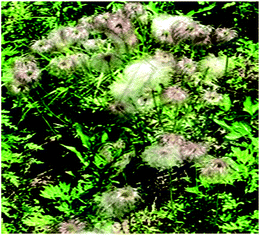
PCR was obtained from Xiao Hinggan Mountains in the northeast of China (Fig. 1). The PCR biomass was dried at 100 °C for 12 h before heat treatment. The dried PCR was put in a tube furnace and then heated at 400 °C for 1 h. Subsequently, the obtained carbon materials were directly carbonized from 700 to 1000 °C for 1 h at the heating rate of 10 °C min−1 in N2 atmosphere with the flow rate of 100 ml min−1. After carbonization, the samples were washed several times with distilled water and dried at 60 °C. PCRs carbonized at 700, 800, 900, and 1000 °C were denoted as PCR-700, PCR-800, PCR-900, and PCR-1000, respectively.Scanning electron microscopy (SEM, HITACHI S-4800), Transmission electron microscope (TEM, JEM-2100HR), and X-ray diffraction (XRD, Rigaku D/Max 2500/PC) were used to characterize the structure and morphology. X-ray photo electron spectroscopy (XPS, ESCALAB 250) was used to determine the composition. The electrochemical evaluation was carried out using an electrochemical workstation (RST5200F, Zhengzhou shiruisi Instrument Technology Co., Ltd. China). Cyclic voltammogram (CV) and rotating-disk electrode (RDE) polarization curves were obtained using a conventional three-electrode electrochemical system. Platinum wire (CHI115) and Ag/AgCl (sat.) (CHI111) electrodes were used as the counter and reference electrodes, respectively. A disk (4 mm in diameter, 0.1256 cm2, Jiangsu Jiangfen Electroanalytical Instrument Co., Ltd.) was used as the working electrode to test the CV and RDE curves. Before measurements, the glassy carbon (GC) electrode was polished with gamma alumina powders (0.05 mm) until a mirror-like surface was obtained, and then washed twice with distilled water and dried in a vacuum. PCR catalysts (12.5 mg) were put in an ethanol solution (1 ml) and were treated by ultrasonication for 20 minutes. Then, 2 μl solution was placed on the surface of the GC electrode to achieve a content of 200 μg cm−2. Finally, a drop of Nafion solution (5 wt%, DuPont) was placed onto the abovementioned surface for improving the adhesion of active materials and the GC electrode surface. The RDE polarization curves were measured by the reference electrode of Ag/AgCl (sat.) in a 0.1 M KOH solution at the scan rate of 10 mV s−1 and rotation rates from 400 to 3600 rpm. CV curves were measured in the same range. O2 was bubbled into the cell for 30 min to obtain O2-saturated solutions before the measurements. To eliminate the influence of the background current, the CV and RDE curves were also tested in N2-saturated solution. The current–time (i–t) curves were measured at the constant potential of −0.40 V in 0.1 M KOH solution for 20![[thin space (1/6-em)]](https://www.rsc.org/images/entities/char_2009.gif) 000 s under continuous O2 bubbling with a flow rate of 20 ml min−1 at the fixed rotation rate of 1600 rpm.
000 s under continuous O2 bubbling with a flow rate of 20 ml min−1 at the fixed rotation rate of 1600 rpm.
Results and discussion
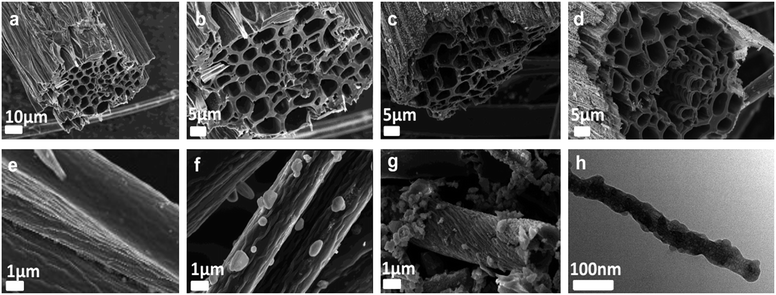
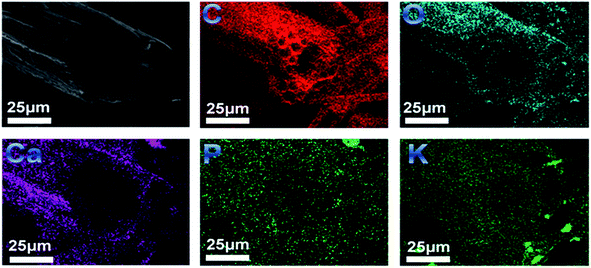
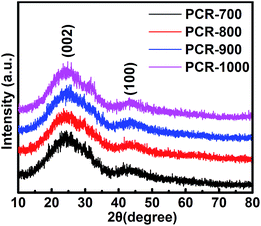
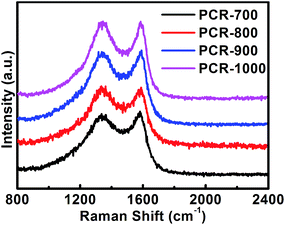
Two different structures were shown in Fig. 2. Honeycomb structures of PCR-700, PCR-800, and PCR-1000 carbon materials were shown in Fig. 2a and b, and Fig. 2c and d, respectively. Fig. 2b was the enlargement of Fig. 2a, showing the honeycomb structure. With the increasing temperature, the surface of the honeycomb structures showed more particles, which can be reflected from the mapping images shown in Fig. 3, indicating some metal elements. Apart from the honeycomb structures, fiber structures were also observed (Fig. 2e–h), and the diameter of PCR carbon materials gradually decreased with the increasing carbonized temperature. As compared to the fibers of PCR-700 and PCR-800, PCR-900 showed more flexural folds and particles at the surface of the fibers (Fig. 2g). The diameter of honeycomb pores and the wall thicknesses are from 1 nm to 10 μm and from 500 nm to 2 μm, respectively (Fig. 2b–d). Apart from this, more particles on the PCR-1000 surface, as shown in Fig. 2h, were present in the TEM image, which can be seen clearly from its illustration corresponding to the position of the elemental mapping images of PCR-1000. Fig. 3 revealed the corresponding elemental compositions including C, O, P, Ca, and K, in which P and O are distributed in the interior of PCR-1000. As shown in Fig. 4, two obvious peaks of PCR carbon materials corresponded to the (002) and (100) reflections. Distance spaces of PCR-700, PCR-800, PCR-900, and PCR-1000 are 0.357, 0.362, 0.362, and 0.364 nm, respectively. With the increasing temperature, the degree of crystallinity of PCR carbon materials gradually decreased. The large peak width and absence of the peaks related to the interlayer order were due to the presence of defects.16 Usually, with the increasing temperature, the degree of crystallinity of carbon materials increased, but the PCR series carbon materials presented the opposite results, which can be understood by the high percentage of the edge orientation. Otherwise, the P content had a great influence on the structure of the PCR-1000, which adopted a more disordered structure corresponding to the results of XPS. Compared with other samples, PCR-1000 exhibited more defects, which facilitated the improvement of the conductivity and increased the catalytic sites. Raman spectra of PCR-700, PCR-800, PCR-900, and PCR-1000 are shown in Fig. 5. All spectra exhibited the well-known D-band and G-band peaks associated with the disordered and graphitized structures, respectively.17,18 The ratios of the D-band and G-band in terms of intensity (ID/IG) for PCR-700, PCR-800, PCR-900, and PCR-1000 are 3.05, 3.11, 2.94, and 3.28, respectively. Generally, the ID/IG ratio decreased with the increasing carbonized temperature, suggesting the improvement of the crystallinity. The ID/IG gradually decreased until PCR-900, but PCR-1000 ID/IG reached the largest value in the Raman spectrum, suggesting more disorder structures, which was agreement with the XRD results.The XPS survey revealed the presence of C, O, P, N, Ca, and K on the surface of PCR carbon materials in Fig. 6a. Table 1 summarizes the atomic surface concentrations of different catalysts. The contents of O, P, and Ca all increased with the carbonized temperature, whereas those of C and N gradually decreased. Note that significant amount of phosphorus (from 0.34 to 1.46 at%) remained on the surface of the three catalysts. The thermal treatment increased the oxygen content from 8.95 to 14.45 at%.
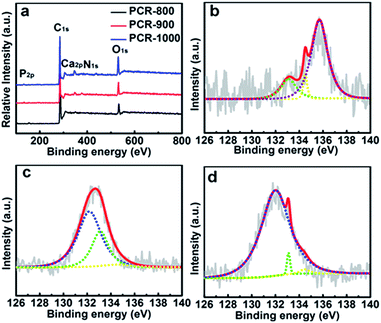 | ||
| Fig. 6 (a) XPS survey of PCR-800, PCR-900, and PCR-1000. P2p spectra of PCR-800 (b), PCR-900 (c), and PCR-1000 (d). Fitted lines, blue: C3PO, green: C–PO3, yellow: C–O–PO3, and pink: P–O. | ||
| Catalyst | Relative intensities of different elements (at%) | |||||
|---|---|---|---|---|---|---|
| C | O | P | N | Ca | K | |
| PCR-800 | 88.45 | 8.95 | 0.34 | 0.32 | 1.58 | 0.36 |
| PCR-900 | 80.70 | 13.64 | 1.46 | 0.31 | 2.17 | 1.12 |
| PCR-1000 | 79.95 | 14.45 | 1.26 | 0.27 | 3.48 | 0.59 |
The P2p spectrum of phosphorus for PCR biomass carbon had been reported as C3PO, C–PO3, C–O–PO3, and P–O groups at the binding energy regions of 132.1, 133.1, 133.7–134.6, and 135.7 eV, respectively.19–21 A peak at the value around 134.2 eV was assigned to P groups bonded to a carbon site through an O atom (C–O–PO3 and/or (C–O)3PO).19,22–24 A second peak that appeared at the binding energy of about 133.1 eV indicated the existence of C–P bonding as in C–PO3.22–24 A small peak at around 132.1 eV was ascribed to C3PO groups and the peak at 135.7 eV was related to P–O groups.19,22–24 Similar peaks have been obtained for phosphoric acid-activated carbons from kraft lignin.17,19 As shown in Table 2, the carbonization process caused a decomposition of the less stable P–O groups and C–O–PO3 groups, increasing the amount of C–PO3 and C3PO groups. Phosphorus directly bonded to the edge carbon atoms in graphite via a C–P–O bond.25 The results of P2p spectra were in agreement with the defects analysis of XRD and Raman.
| Catalyst | Relative intensities of different peaks (at%) | |||
|---|---|---|---|---|
| C3PO | C–PO3 | C–O–PO3 | P–O | |
| PCR-800 | 0 | 18.43 | 5.65 | 75.92 |
| PCR-900 | 65.87 | 30.34 | 3.79 | 0 |
| PCR-1000 | 96.12 | 2.39 | 1.49 | 0 |
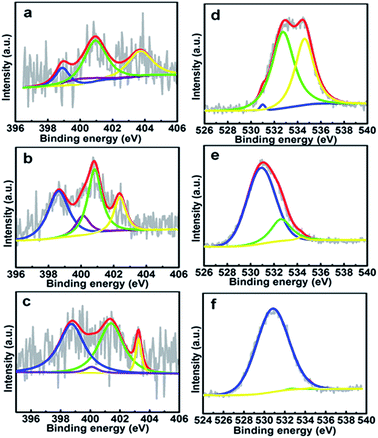
The XPS N1s spectra of the three catalysts were divided into four groups. Fig. 7a–c correspond to PCR-800, PCR-900, and PCR-1000, respectively. The peaks were attributed to pyridinic-N at 398.7 ± 0.3 eV, pyrrolic-N at 400.3 ± 0.3 eV, quaternary-N at 401.4 ± 0.5 eV, and pyridinie-N–O at 402–405 eV.26 In Table 3, the variety of the four types is pyridinic-N and the proportion gradually increased from 12.31% to 46.42%, which takes more active sites in the ORR.
| Catalyst | Relative intensities of different peaks (at%) | |||
|---|---|---|---|---|
| Pyridinic-N | Pyrrolic-N | Quaternary-N | Pyridinie-N–O | |
| PCR-800 | 12.31 | 8.70 | 47.81 | 31.18 |
| PCR-900 | 37.80 | 10.44 | 36.54 | 15.22 |
| PCR-1000 | 46.42 | 2.58 | 43.82 | 7.18 |
The XPS O1s spectra of the three catalysts were divided into three groups. The peak at 530.6–530.9 eV was attributed to an oxygen doubly bonded to carbon (C![[double bond, length as m-dash]](https://www.rsc.org/images/entities/char_e001.gif) O) and non-bridging oxygen in the phosphate group (P
O) and non-bridging oxygen in the phosphate group (P![[double bond, length as m-dash]](https://www.rsc.org/images/entities/char_e001.gif) O).27,28 The peak at 532.5–532.9 eV was assigned to the combined effects of singly bonded oxygen (–O–) in C–O and in C–O–P groups. The peak at 535.0–535.9 eV was ascribed to the chemisorbed oxygen and water. With the increasing temperature, the
O).27,28 The peak at 532.5–532.9 eV was assigned to the combined effects of singly bonded oxygen (–O–) in C–O and in C–O–P groups. The peak at 535.0–535.9 eV was ascribed to the chemisorbed oxygen and water. With the increasing temperature, the ![[double bond, length as m-dash]](https://www.rsc.org/images/entities/char_e001.gif) O group in the carbonyl and the –O– group and chemisorbed O groups decreased (Table 4), which was in accordance with the analysis results of the P2p spectrum.27,28
O group in the carbonyl and the –O– group and chemisorbed O groups decreased (Table 4), which was in accordance with the analysis results of the P2p spectrum.27,28
| Catalyst | Relative intensities of different peaks (at%) | ||
|---|---|---|---|
![[double bond, length as m-dash]](https://www.rsc.org/images/entities/char_e001.gif) O in carbonyl and carboxyl O in carbonyl and carboxyl |
–O– | Chemisorbed O and H2O | |
| PCR-800 | 0.85 | 57.18 | 41.97 |
| PCR-900 | 80.89 | 18.10 | 1.01 |
| PCR-1000 | 99.60 | 0.22 | 0.18 |
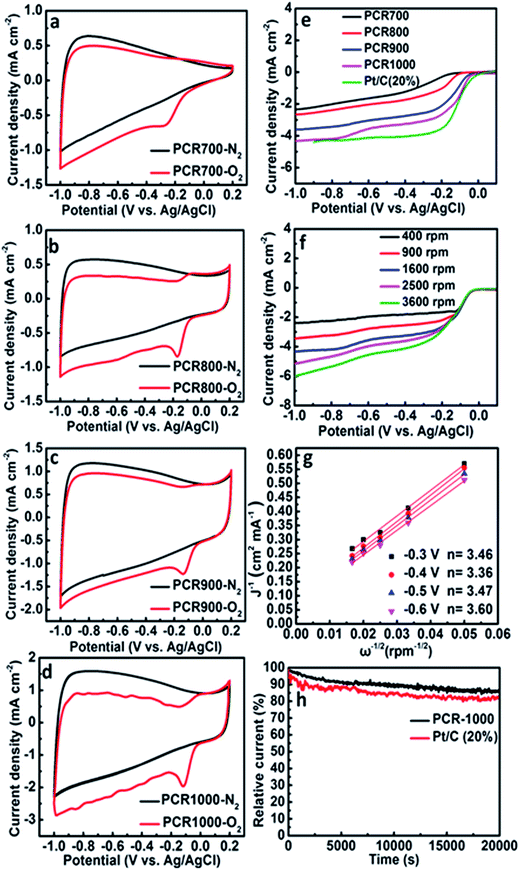
Compared to PCR-700, PCR-800, and PCR-900, the CV curve of PCR-1000 exhibited the largest ORR potential (−0.120 V vs. Ag/AgCl) (Fig. 8d) in an O2-saturated 0.1 M KOH solution. On comparing the RDE curves of different catalysts obtained at the scan rate of 10 mV s−1 and at the rotation speed of 1600 rpm, as shown in Fig. 8e, it was observed that PCR-700, PCR-800, and PCR-900 catalysts showed relatively low ORR activity. On the contrary, PCR-1000 showed better electrocatalytic activity with the half-peak potential of −0.137 V vs. Ag/AgCl, which is 30 mV lower than that of a commercial Pt/C (20%) catalyst, showing excellent potential in numerous P-doped carbon materials. The half-peak current density was 2.18 mA cm−2, and the limited current densities were 4.36 mA cm−2 (Fig. 8e). RDE voltammograms of PCR-1000 catalyst at the rotation speeds from 400 to 3600 rpm in an O2-saturated 0.1 M KOH solution are shown in Fig. 8f. Derived Koutecky–Levich (K–L) plots (Fig. 8g) show the good linearity and parallelism, indicating that the ORR process of PCR-1000 follows first-order kinetics in the selected potential range from −0.3 to −0.6 V.
The electron transfer numbers (n) during ORR and the kinetic limited current density (Jk) can be calculated from the following K–L equation:29
| 1/J = 1/Jk + 1/(0.62nFC0D02/3v−1/6ω1/2) | (1) |
![[thin space (1/6-em)]](https://www.rsc.org/images/entities/char_2009.gif) 500 C mol−1), C0 is the bulk concentration of O2 (mol L−1), v is the kinematic viscosity of the electrolyte, k is the electron transfer rate constant, and the values of C0, D0, and v for an O2-saturated 0.1 M KOH solution are 1.14 × 10⁻⁶ mol cm−3, 1.73 × 10⁻⁵ cm2 s−1, and 0.01 cm2 s−1, respectively. The values of the n and Jk can be estimated from the slope and intercept of the K–L plots, based on eqn (1). The values of the transferred electron number in the PCR-1000 catalyst are 3.46, 3.36, 3.47, and 3.60 e, which is involved in both a two and four electron transfer.4 The stability of PCR-1000 and Pt/C (20%) catalysts were tested at the constant potential of −0.4 V in an O2-saturated 0.1 M KOH solution at 1600 rpm (Fig. 8h). After 20
500 C mol−1), C0 is the bulk concentration of O2 (mol L−1), v is the kinematic viscosity of the electrolyte, k is the electron transfer rate constant, and the values of C0, D0, and v for an O2-saturated 0.1 M KOH solution are 1.14 × 10⁻⁶ mol cm−3, 1.73 × 10⁻⁵ cm2 s−1, and 0.01 cm2 s−1, respectively. The values of the n and Jk can be estimated from the slope and intercept of the K–L plots, based on eqn (1). The values of the transferred electron number in the PCR-1000 catalyst are 3.46, 3.36, 3.47, and 3.60 e, which is involved in both a two and four electron transfer.4 The stability of PCR-1000 and Pt/C (20%) catalysts were tested at the constant potential of −0.4 V in an O2-saturated 0.1 M KOH solution at 1600 rpm (Fig. 8h). After 20![[thin space (1/6-em)]](https://www.rsc.org/images/entities/char_2009.gif) 000 s of testing, PCR-1000 maintained 87% of its initial current value, which was higher than 82.1% of the Pt/C (20%) catalyst, indicating better stability than the Pt/C catalyst in an O2-saturated 0.1 M KOH solution.
000 s of testing, PCR-1000 maintained 87% of its initial current value, which was higher than 82.1% of the Pt/C (20%) catalyst, indicating better stability than the Pt/C catalyst in an O2-saturated 0.1 M KOH solution.
Conclusion
A facile method was used for the fabrication of phosphorus-doped honeycomb carbon materials as oxygen reduction catalysts derived from Pulsatilla chinensis (Bunge) Regel. The largest content of P in P-doped PCR biomass was 1.46 at%, which corresponds to the value obtained via other chemical method. The pyridinic-N group gradually increased from 12.31% to 46.42%, which takes more active sites in PCR-1000. PCR-1000 showed a better half-peak potential (−0.137 V vs. Ag/AgCl), which was 30 mV lower than that of the commercial Pt/C (20%) catalyst, showing excellent reactive potential in many previous P-doped carbon materials. In the PCR-1000 catalyst, the half-peak current density was 2.18 mA cm−2, and the limited current densities were 4.36 mA cm−2. The values of the transferred electron number in PCR-1000 catalyst were 3.46, 3.36, 3.47, and 3.60 e including both two and four electron transfers. A value of 87.0% of the initial current density was maintained after 20![[thin space (1/6-em)]](https://www.rsc.org/images/entities/char_2009.gif) 000 s stable testing in an O2-saturated 0.1 M KOH solution with a rotation of 1600 rpm. The electrochemical testing results demonstrated that the method of P-doped materials derived from plants containing phosphorus exhibited superior properties in oxygen reduction, which implemented a novel idea for the preparation of difficult to prepare P-doped carbon material catalysts in fuel cells.
000 s stable testing in an O2-saturated 0.1 M KOH solution with a rotation of 1600 rpm. The electrochemical testing results demonstrated that the method of P-doped materials derived from plants containing phosphorus exhibited superior properties in oxygen reduction, which implemented a novel idea for the preparation of difficult to prepare P-doped carbon material catalysts in fuel cells.
Acknowledgements
The authors acknowledge the financial support received from the National Key Basic Research Program No. 2013CB933103 funded by MOST and the Program for the Fundamental Research Supported by Shenzhen Science and Technology Innovations Council of China (Grant No. JSF201006300047A, No. JC201105201126A, and No. ZDSY20120619140933512). The authors are grateful to the China Postdoctoral Science Foundation funded project, a project funded by China Postdoctoral Science (No. 2015M5811087).Notes and references
- L. Dai, Y. Xue, L. Qu, H. J. Choi and J. B. Baek, Chem. Rev., 2015, 115, 4823–4892 CrossRef CAS PubMed.
- M. K. Debe, Nature, 2012, 486, 43–51 CrossRef CAS PubMed.
- J. Masa, W. Xia, M. Muhler and W. Schuhmann, Angew. Chem., Int. Ed., 2015, 54, 10102–10120 CrossRef CAS PubMed.
- K. Gong, F. Du, Z. Xia, M. Durstock and L. Dai, Science, 2009, 323, 760–764 CrossRef CAS PubMed.
- X. Gong, S. Liu, C. Ouyang, P. Strasser and R. Yang, ACS Catal, 2015, 5, 920–927 CrossRef CAS.
- X. Sun, J. Xu, Y. Ding, B. Zhang, Z. Feng and D. S. Su, ChemSusChem, 2015, 8, 2872–2876 CrossRef CAS PubMed.
- C. Zhang, N. Mahmood, H. Yin, F. Liu and Y. Hou, Adv. Mater., 2013, 25, 4932–4937 CrossRef CAS PubMed.
- D.-S. Yang, D. Bhattacharjya, S. Inamdar, J. Park and J.-S. Yu, J. Am. Chem. Soc., 2012, 134, 16127–16130 CrossRef CAS PubMed.
- Z.-W. Liu, F. Peng, H.-J. Wang, H. Yu, W.-X. Zheng and J. Yang, Angew. Chem., 2011, 123, 3315–3319 CrossRef.
- Z. Chen, K. Li and L. Pu, Bioresour. Technol., 2014, 170, 379–384 CrossRef CAS PubMed.
- J. Wu, Z. Yang, Q. Sun, X. Li, P. Strasser and R. Yang, Electrochim. Acta, 2014, 127, 53–60 CrossRef CAS.
- R. Li, Z. Wei, X. Gou and W. Xu, RSC Adv., 2013, 3, 9978–9984 RSC.
- Z. Chen, K. Li, P. Zhang, L. Pu, X. Zhang and Z. Fu, Chem. Eng. J., 2015, 259, 820–826 CrossRef CAS.
- V. V. Strelko, V. S. Kuts and P. A. Thrower, Carbon, 2000, 38, 1499–1503 CrossRef CAS.
- M. Borghei, N. Laocharoen, E. Kibena-Poldsepp, L.-S. Johansson, J. Campbell, E. Kauppinen, K. Tammeveski and O. J. Rojas, Appl. Catal., B, 2017, 204, 394–402 CrossRef CAS.
- L. Zhao, Y. Qiu, J. Yu, X. Deng, C. Dai and X. Bai, Nanoscale, 2013, 5, 4902–4909 RSC.
- F. Tuinstra and J. L. Koenig, J. Chem. Phys., 1970, 53, 1126–1130 CrossRef CAS.
- R. J. Nemanich and S. A. Solin, Phys. Rev. B: Condens. Matter Mater. Phys., 1979, 20, 392–401 CrossRef CAS.
- J. Bedia, J. M. Rosas, J. Rodríguez-Mirasol and T. Cordero, Appl. Catal., B, 2010, 94(l), 8–18 CrossRef CAS.
- M. Cuisinier, N. Dupré, J. F. Martin, R. Kanno and D. Guyomard, J. Power Sources, 2013, 224, 50–58 CrossRef CAS.
- X. Wu and L. R. Radovic, Carbon, 2006, 44, 141–151 CrossRef CAS.
- A. M. Puziy, O. I. Poddubnaya and A. M. Ziatdinov, Appl. Surf. Sci., 2006, 252, 8036–8038 CrossRef CAS.
- J. M. Rosas, J. Bedia, J. Rodrıguez-Mirasol and T. Cordero, Ind. Eng. Chem. Res., 2008, 47, 1288–1296 CrossRef CAS.
- Y.-J. Lee and L. R. Radovic, Carbon, 2003, 41, 1987–1997 CrossRef CAS.
- S. G. Oh and N. M. Rodriguez, J. Mater. Res., 1993, 8, 2879–2888 CrossRef CAS.
- D. Long, J. Zhang, J. Yang, Z. Hu, G. Cheng, X. Liu, R. Zhang, L. Zhan, W. Qiao and L. Ling, Carbon, 2008, 46, 1253–1269 CrossRef.
- A. G. Kannan, N. R. Choudhury and N. K. Dutta, Polymer, 2007, 48, 7078–7086 CrossRef CAS.
- P. Y. Shih, S. W. Yung and T. S. Chin, J. Non-Cryst. Solids, 1999, 244, 211–222 CrossRef CAS.
- C. Jin, F. Lu, X. Cao, Z. Yang and R. Yang, J. Mater. Chem. A, 2013, 1, 12170–12177 CAS.
| This journal is © The Royal Society of Chemistry 2017 |

