 Open Access Article
Conversion of cellulose into lactic acid using zirconium oxide catalysts†
Panya Wattanapaphawongab,
Prasert Reubroycharoenbc and
Aritomo Yamaguchi *ad
*ad
aNational Institute of Advanced Industrial Science and Technology (AIST), 4-2-1 Nigatake, Miyagino, Sendai 983-8551, Japan. E-mail: a.yamaguchi@aist.go.jp
bDepartment of Chemical Technology, Faculty of Science, Chulalongkorn University, Pathumwan, Bangkok 10330, Thailand
cCenter of Excellence on Petrochemical and Materials Technology, Chulalongkorn University Research Building, Bangkok 10330, Thailand
dJST, PRESTO, 4-2-1 Nigatake, Miyagino, Sendai 983-8551, Japan
First published on 28th March 2017
Abstract
The possibility of converting cellulose into lactic acid using stable, easily prepared solid catalysts has attracted much attention. In this study, the catalytic activities of various transition metal oxides for cellulose conversion were determined; ZrO2 showed the highest activity for lactic acid production from cellulose. Various types of ZrO2 were tested for catalytic activity. The correlation between lactic acid yields and the characteristic properties of the ZrO2 indicated that the concentrations of acid and base sites on the ZrO2 played an important role in lactic acid production. The conversion of fructose into glyceraldehyde and dihydroxyacetone by a retro-aldol reaction was probably enhanced by the combination of acid and base sites on the ZrO2. The ZrO2 catalyst was stable in high-temperature water (473 K), and almost no Zr leached out of the catalyst into solution during the reaction.
Introduction
The depletion of fossil fuel resources has stimulated the idea of using renewable sources of carbon to achieve a sustainable society; thus, conversion of biomass into fuels and chemicals has attracted much attention. Cellulose is considered a renewable carbon resource because it is a major component of inedible lignocellulosic biomass. Cellulose is a polysaccharide made up of glucose monomers joined through β-1,4-glucosidic bonds. Conversion of cellulose via glucose into chemicals has been reported for the production of chemicals such as 5-hydroxymethylfurfural, sorbitol, and lactic acid.1–3 Lactic acid is one of the promising platform chemicals produced from cellulose because it is widely used in the food, cosmetic, pharmaceutical, and chemical industries.4,5 Furthermore, lactic acid is used to produce polylactic acid6,7 and can be converted into a wide range of chemicals such as propylene glycol and acrylic acid.5,8 The demand for lactic acid has been growing continuously; it is produced commercially via a fermentation process using sugars derived from starch.4,5,9 However, the conventional fermentation process has some disadvantages: (i) the fact that the optimum pH range for production by lactic bacteria is 5–7 results in a requirement for neutralization and purification, (ii) the production rate is low, and (iii) edible carbohydrates are conventionally used as a starting material.9The catalytic production of lactic acid from inedible cellulose has been discussed as an alternative to the fermentation process. High yields of lactic acid from cellulose have been achieved with homogeneous catalysts (68% with PbCl2 (ref. 10) and 91% with ErCl3 (ref. 11)). However, use of homogeneous catalysts is compromised by difficulties associated with product separation from the catalysts and the recyclability of the catalysts. Heterogeneous catalysts are much better suited for cellulose conversion into lactic acid because they can be easily separated from the product; however, only a few such catalysts have been reported. Yang et al. obtained a 24% yield of lactic acid from cellulose using LaCoO3 perovskite metal oxide.12 Chambon et al. used AlW as a solid catalyst and obtained a 28% yield of lactic acid from cellulose,13 and Coman et al. have reported a 27% yield of lactic acid from cellulose using NbF5-AlF3 as a catalyst.14 One of the problems with these solid catalysts is that the metal species leach into solution; 2.4% and 1.5% of the Co and La, respectively, from LaCoO3 (ref. 12) and 1.5% of the W from AlW13 leached into solution. Also, the cost of preparation of these heterogeneous catalysts makes their industrial use problematic. A few simple metal oxides such as ZrO2 and TiO2 have been found to be stable solid catalysts in high-temperature water.15,16 In this study, we aim to find a new heterogeneous catalyst, which is lower in cost than the reported heterogeneous catalysts, without leaching of metal species. We report cellulose conversion into lactic acid using simple metal oxides as stable, easily prepared solid catalysts. We found that ZrO2 actively catalyzed the production of lactic acid (yield 21.2%) from cellulose and that it was very stable in high-temperature water (473 K).
Experimental
Catalysts
Zirconium oxides (ZrO2) were purchased from Hosokawa Micron Co. (ZrO2-Hos), Sigma-Aldrich Co., LLC. (Aldrich) (ZrO2-Ald), Nacalai Tesque, Inc. (Nacalai) (ZrO2-Nac), and Wako Pure Chemical Industries, Ltd. (Wako) (ZrO2-Wak); standard samples were obtained from Daiichi Kigenso Kagaku Kogyo Co., Ltd. via the Catalysis Society of Japan (ZRO-6, ZRO-7, ZRO-8, and ZRO-9). Yttria-stabilized zirconium oxide (YSZ) was purchased from Tosoh Co.; aluminum oxide (Al2O3), iron oxide (Fe3O4), and lanthanum oxide (La2O3) from Aldrich; titanium oxide with anatase phase (A-TiO2), rutile phase (R-TiO2), and cerium oxide (CeO2) from Kanto Chemical Co., Inc. (Kanto); vanadium oxide (V2O5) from Rare Metallic Co., Ltd.; cerium oxide (CeO2) (Kanto), thulium oxide (Tm2O3) and yttrium oxide (Y2O3) from Nippon Yttrium Co., Ltd. (NYC); hafnium oxide (HfO2) and gallium oxide (Ga2O3) from Wako; niobium oxide (Nb2O5) from Koso Chemical; tantalum oxide (Ta2O5) from Nacalai; and magnesium oxide (MgO) from Ube Industries, Ltd. These metal oxide catalysts were used without purification or pretreatment.ZrO2 was also prepared by a precipitation method as follows.17 We dissolved 13.07 g of zirconyl chloride (ZrOCl2·8H2O) in 500 cm3 of water. The aqueous solution of ZrOCl2·8H2O was gradually dropped into 300 cm3 of a 0.1 mol dm−3 of aqueous ammonia with stirring. More 0.1 mol dm−3 ammonia solution was added until the pH of the obtained suspension reached 10. This suspension was stirred for 1 h and then aged for 24 h. The precipitate was separated from the aqueous solution by filtration, washed several times with distilled water, and then dried at 393 K overnight. The samples were calcined at temperatures of 773, 873, 973, and 1073 K in air for 4 h. These calcined samples are denoted as ZrO2-X (X = calcination temperature).
Reaction procedure
The conversion of cellulose was carried out in a stainless steel batch reactor (OM Lab-Tech, MMJ-100) with an inner volume of 100 cm3. In a typical experiment, ball-milled cellulose (Merck Ltd., microcrystalline cellulose) (0.5 g), metal oxide catalyst (1.0 g), and water (50 g) were loaded into the reactor, and the reactor was purged with nitrogen gas (0.1 MPa). The reactor was heated to 473 K and maintained at that temperature for 6 h with screw stirring. After the reaction, a mixture of liquid and solid was recovered and filtered to separate the solid materials from the liquid fraction. The solid residue was dried overnight at 333 K, and the weight of the dry solid residue was recorded. Quantitative analyses of water-soluble chemicals such as lactic acid, levulinic acid, 5-hydroxymethylfurfural (HMF), and furfural in the liquid fraction were performed by gas chromatography (Shimadzu, GC-2014) with a flame ionization detector and an InertCap capillary column (GL Sciences Inc.); we used 1-butanol as the internal standard. Quantitative analyses of sugars such as glucose were conducted by high-performance liquid chromatography (Shimadzu, HPLC) with a refractive index detector (Shimadzu, RID-10A) and a UV-Vis detector (Shimadzu, SPD-20AV) equipped with a Rezex RPM-Monosaccharide Pb+2 column (Phenomenex). The amount of total organic carbon (TOC) in the liquid fraction was determined using a total organic carbon analyzer (Shimadzu, TOC-VCSN). The conversion and product yields were calculated based on the dry weight and moles of carbon, respectively, in the cellulose and product as follows:
 | (1) |
 | (2) |
Characterization
X-ray diffraction (XRD) patterns of the catalysts were recorded using a Rigaku SmartLab with Cu Kα radiation (λ = 0.15406 nm) under 30 mA current and 40 kV voltages in the 2θ range of 5–90° with a 2θ step size of 0.02°.Nitrogen adsorption and desorption measurements at 77 K were carried out on a Micromeritics 3FLEX 3500 chemisorption analyzer for samples degassed at 573 K for 4 h. The specific surface areas of the catalysts were determined by the Brunauer–Emmett–Teller (BET) method.
Temperature-programmed desorption of ammonia (NH3-TPD) was carried out with a TPD-1-AT instrument (Bel Japan, Inc.). The sample (ca. 0.05 g) was loaded in a quartz tube and pretreated at 773 K in flowing helium for 1 h. After cooling in flowing helium to 373 K, the sample was saturated in 5% ammonia diluted with helium (0.5 cm3 s−1) for 30 min, after which the flowing gas was switched to helium at a flow rate of 0.83 cm3 s−1 for 1 h. Finally, the sample was heated at a constant rate of 10 K min−1 to 953 K. The ammonia signal was analyzed with an online quadrupole mass spectrometer.
Temperature-programmed desorption of carbon dioxide (CO2-TPD) was carried out on a Micromeritics 3FLEX 3500 chemisorption analyzer with an online quadrupole mass spectrometer. The sample (ca. 0.2 g) was loaded into a quartz tube and pretreated at 773 K in flowing helium for 1 h. After cooling in flowing helium to 323 K, the sample was saturated in a CO2 flow (0.5 cm3 s−1) for 30 min. The flowing gas was switched to helium (0.83 cm3 s−1) for 1 h, and then the sample was heated at a constant rate of 10 K min−1 to 953 K.
The concentration of zirconium species in liquid solution was determined using an inductively coupled plasma (ICP) atomic emission spectrometer (SPS4000, SII NanoTechnology Inc.).
Results and discussion
Catalyst screening
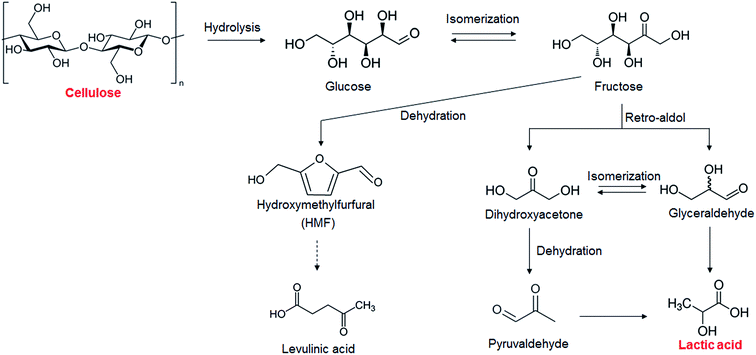
The results of the catalytic conversion of cellulose at 473 K using various transition metal oxides as solid catalysts and using hydrothermal conversion without solid catalysts as a reference are summarized in Table 1. The fact that the cellulose conversion was 86.3% without catalysts showed that cellulose hydrolysis occurred in water at 473 K. In this study, we used cellulose after the ball-milling treatment to decrease the crystallinity of cellulose and increase the cellulose hydrolysis.18,19 Without solid catalysts, however, only a 0.7% yield of lactic acid could be obtained; the yields of glucose, HMF, and levulinic acid, however, were 6.6%, 16.4%, and 4.0%, respectively. It has been reported that glucose and its isomer fructose are dehydrated into HMF in water with or without a Brønsted acid20 and that levulinic acid is obtained from HMF21 (Scheme 1). Previous studies have indicated that obtaining lactic acid requires conversion of fructose into glyceraldehyde and dihydroxyacetone by a retro-aldol reaction22,23 (Scheme 1) instead of fructose dehydration into HMF. The yield of lactic acid was increased by using the metal oxides ZrO2, CeO2, HfO2, Al2O3, and V2O5, the indication being that these catalysts enhanced the conversion of fructose into glyceraldehyde and dihydroxyacetone. The active sites associated with this step will be discussed later. ZrO2 was the most effective catalyst in converting cellulose into lactic acid, the yield of lactic acid being 21.2%. As mentioned in the Introduction section, ZrO2 is known to be a stable solid catalyst in high-temperature water.15,16 We measured how much Zr leached into liquid solution by ICP. Only 10−4% (almost zero) of the Zr leached out from ZrO2 into the water during the reaction, much smaller than the 1.5% of W that leaches from AlW.13 We therefore selected ZrO2 as the catalyst for cellulose conversion into lactic acid.| Catalyst | Conversion (%) | Yield (%) | |||||
|---|---|---|---|---|---|---|---|
| Lactic acid | Glucose | HMF | Levulinic acid | Furfural | Othersb | ||
| a Reaction conditions: 0.5 g ball-milled cellulose, 1 g catalyst (HfO2 and Ga2O3 0.5 g), 50 g water, 473 K reaction temperature, 6 h reaction time.b Others were calculated from the total amount of organic carbon in solution. | |||||||
| No catalyst | 86.3 | 0.7 | 6.6 | 16.4 | 4.0 | 5.6 | 33.0 |
| ZrO2 (ZRO-7) | 87.3 | 21.2 | 0.0 | 0.5 | 3.2 | 0.6 | 39.7 |
| Al2O3 | 87.7 | 8.7 | 0.0 | 0.9 | 12.1 | 0.3 | 32.9 |
| A-TiO2 | 100.0 | 2.8 | 0.0 | 3.8 | 7.5 | 2.0 | 43.1 |
| R-TiO2 | 88.2 | 1.6 | 0.0 | 13.3 | 5.6 | 2.0 | 45.0 |
| Fe3O4 | 75.7 | 2.9 | 1.7 | 17.6 | 0.3 | 1.6 | 33.6 |
| V2O5 | 95.6 | 6.1 | 0.0 | 0.1 | 4.1 | 2.0 | 46.5 |
| CeO2 | 97.4 | 12.9 | 0.1 | 1.6 | 0.7 | 0.5 | 46.6 |
| Tm2O3 | 94.2 | 2.6 | 0.0 | 0.7 | 0.4 | 0.3 | 50.5 |
| HfO2 | 100.0 | 12.5 | 0.0 | 5.2 | 2.4 | 1.3 | 44.6 |
| Ga2O3 | 88.3 | 2.5 | 5.7 | 1.7 | 3.4 | 2.3 | 54.1 |
| Nb2O5 | 87.9 | 0.6 | 5.4 | 12.3 | 1.9 | 2.2 | 46.2 |
| Ta2O5 | 98.2 | 0.6 | 5.3 | 14.7 | 1.4 | 3.5 | 44.7 |
| La2O3 | 53.2 | 1.1 | 0.0 | 0.0 | 0.0 | 0.2 | 49.9 |
| Y2O3 | 31.5 | 0.3 | 0.0 | 0.0 | 0.0 | 0.0 | 18.9 |
| MgO | 1.8 | 0.0 | 0.0 | 0.3 | 0.0 | 0.2 | 41.8 |
Reaction conditions
The reaction conditions such as reaction time and reaction temperature were optimized to obtain a high yield of lactic acid from cellulose. The conversion of cellulose using ZrO2 (ZRO-7) at 473 K was carried out for reaction times of 3–7.5 h (Fig. 1). The yield of lactic acid increased from 14.3% to 21.2% with increasing reaction time from 3 to 6 h. When the reaction time was increased to 7.5 h, the yield of lactic acid decreased, presumably because the prolonged reaction time led to decomposition of lactic acid. We checked the stability of lactic acid with ZrO2 under the same conditions as the reaction (473 K, 6 h). The recovery of lactic acid was 90.8%, the indication being that some of lactic acid decomposed or polymerized into other materials. This result can explain the decrease of lactic acid yield between 6 and 7.5 h.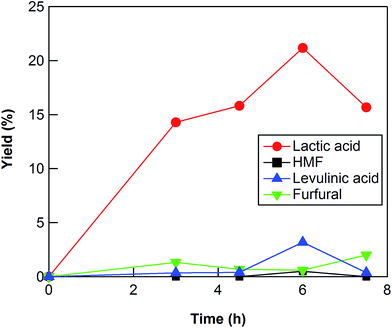 | ||
| Fig. 1 Cellulose conversion using a ZrO2 catalyst at 473 K as a function of reaction time. Reaction conditions: 0.5 g ball-milled cellulose, 1 g ZrO2 (ZRO-7), 50 g water. | ||
The conversion of cellulose using ZrO2 (ZRO-7) was carried out at temperatures in the range 453–483 K (Fig. 2). The cellulose conversion increased with increasing reaction temperature, and the yield of lactic acid also increased with increasing reaction temperature up to 473 K. The lactic acid yield, however, decreased between 473 and 483 K, probably because of the decomposition of lactic acid at the higher reaction temperature. We also checked the results at 453 and 463 K for reaction times up to 24 h (Fig. S1 and S2†). At 453 and 463 K, the yield of lactic acid increased with increasing reaction time from 3 to 18 h (maximum yield 16.8% at 463 K); however, lactic acid yield decreased slightly between 18 and 24 h (Fig. S1 and S2†). We also checked the results at 483 K for reaction times of no more than 7.5 h (Fig. S3†). The maximum yield (17.6%) at 483 K was obtained for a reaction time of 6 h. The maximum yields of lactic acid at 453, 463, and 483 K were lower than the yield at 473 K, the indication being that a reaction temperature of 473 K was the optimum temperature for cellulose conversion into lactic acid.
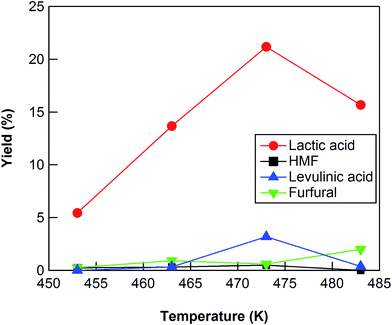 | ||
| Fig. 2 Cellulose conversion using a ZrO2 catalyst as a function of reaction temperature. Reaction conditions: 0.5 g ball-milled cellulose, 1 g ZrO2 (ZRO-7), 50 g water, 6 h reaction time. | ||
Cellulose conversion over ZrO2 catalysts
The yields of lactic acid from cellulose at 473 K using various types of ZrO2 catalysts ranged from 3.1% to 21.2% (Table 2). These results indicate that production of lactic acid requires specific active sites on the ZrO2 catalysts and that the concentration of active sites varied widely between ZrO2 catalysts. In the case of a prepared ZrO2 catalyst such as ZrO2-773, the lactic acid yield decreased with increasing calcination temperature from 773 to 1073 K.| Catalyst | Conversion (%) | Yield (%) | |||||
|---|---|---|---|---|---|---|---|
| Lactic acid | Glucose | HMF | Levulinic acid | Furfural | Others b | ||
| a Reaction conditions: 0.5 g ball-milled cellulose, 1 g ZrO2, 50 g water, 473 K reaction temperature, 6 h reaction time.b Others were calculated from the total amount of organic carbon in solution. | |||||||
| ZrO2-Hos | 69.1 | 3.1 | 1.2 | 9.4 | 0.3 | 1.3 | 29.9 |
| ZrO2-Ald | 100.0 | 8.8 | 0.5 | 3.8 | 6.4 | 1.5 | 41.9 |
| ZrO2-Nac | 92.8 | 4.9 | 2.0 | 10.6 | 5.4 | 2.8 | 37.7 |
| ZrO2-Wak | 92.0 | 6.9 | 1.0 | 9.0 | 5.0 | 2.0 | 41.3 |
| ZRO-6 | 100.0 | 18.4 | 0.0 | 0.5 | 1.9 | 0.4 | 31.2 |
| ZRO-7 | 87.3 | 21.2 | 0.0 | 0.5 | 3.2 | 0.6 | 39.7 |
| ZRO-8 | 95.4 | 10.9 | 1.4 | 4.1 | 5.1 | 1.6 | 44.4 |
| ZRO-9 | 73.9 | 20.0 | 0.0 | 0.4 | 2.3 | 0.4 | 30.4 |
| YSZ | 89.2 | 6.5 | 1.4 | 11.7 | 4.9 | 1.7 | 38.7 |
| ZrO2-773 | 96.9 | 14.0 | 0.0 | 0.0 | 0.3 | 1.0 | 53.2 |
| ZrO2-873 | 100.0 | 10.4 | 0.0 | 0.9 | 0.3 | 1.2 | 57.3 |
| ZrO2-973 | 100.0 | 8.5 | 0.8 | 3.8 | 2.4 | 1.5 | 51.6 |
| ZrO2-1073 | 98.1 | 6.5 | 0.9 | 3.2 | 1.9 | 1.6 | 56.5 |
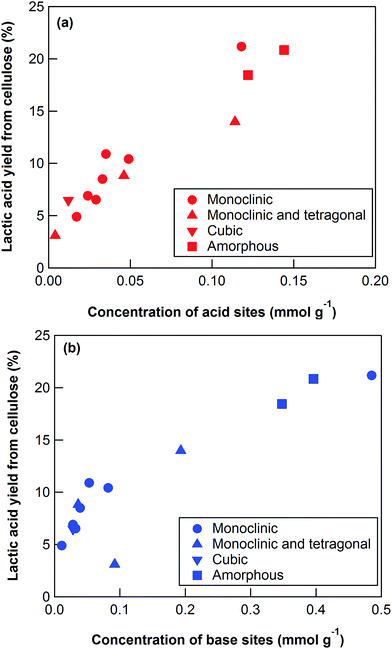
To elucidate the cause of the differences between the ZrO2 catalytic activities, we characterized the catalysts using XRD, nitrogen adsorption, NH3-TPD, and CO2-TPD (Table 3). The XRD patterns (Fig. S4†) revealed that the ZrO2 catalysts included monoclinic, monoclinic/tetragonal mixtures, and cubic (only YSZ) crystal structures as well as, and amorphous ZrO2 (Table 3). The crystal sizes of the crystalline ZrO2 ranged from 11.7 to 47.7 nm (Table 3). Nitrogen adsorption indicated that the specific surface areas ranged widely from 7.7 to 325 m2 g−1. The crystal phases, crystal sizes, and specific surface areas of the ZrO2 catalysts were poorly correlated with the yields of lactic acid from cellulose at 473 K (Table 3).
| Catalyst | Crystal phase a | Crystalline sizea (nm) | Specific surface area (m2 g−1) | Acid site amount (mmol g−1) | Base site amount (mmol g−1) | Lactic acid yieldb (%) |
|---|---|---|---|---|---|---|
| a Crystal phase and crystalline size were determined by XRD pattern.b Reaction conditions: 0.5 g ball-milled cellulose, 1 g ZrO2, 50 g water, 473 K reaction temperature, 6 h reaction time.c Data were shown by the company. | ||||||
| ZrO2-Hos | Monoclinic, tetragonal | 44.8 | 19.4 | 0.004 | 0.092 | 3.1 |
| ZrO2-Ald | Tetragonal, monoclinic | 34.1 | 34.4 | 0.046 | 0.036 | 8.8 |
| ZrO2-Nac | Monoclinic | 47.7 | 7.7 | 0.017 | 0.011 | 4.9 |
| ZrO2-Wak | Monoclinic | 41.9 | 11.7 | 0.024 | 0.028 | 6.9 |
| ZRO-6 | Amorphous | — | 279.3c | 0.122 | 0.348 | 18.4 |
| ZRO-7 | Monoclinic | 12.1 c | 100.5c | 0.118 | 0.485 | 21.2 |
| ZRO-8 | Monoclinic | 23.4 | 22.1c | 0.035 | 0.053 | 10.9 |
| ZRO-9 | Amorphous | — | 325.0c | 0.144 | 0.396 | 20.0 |
| YSZ | Cubic | 23.4 | 7.8 | 0.012 | 0.028 | 6.5 |
| ZrO2-773 | Monoclinic, tetragonal | 11.7 | 57.1 | 0.114 | 0.193 | 14.0 |
| ZrO2-873 | Monoclinic | 18.8 | 30.8 | 0.049 | 0.082 | 10.4 |
| ZrO2-973 | Monoclinic | 26.7 | 18.6 | 0.033 | 0.039 | 8.5 |
| ZrO2-1073 | Monoclinic | 25.8 | 17.4 | 0.029 | 0.032 | 6.5 |
The key step in the production of lactic acid is fructose conversion into glyceraldehyde and dihydroxyacetone by a retro-aldol reaction involving C–C bond cleavage (Scheme 1), which is reported to be enhanced by Lewis acid.24–26 The acid sites and base sites of metal oxides can be characterized by NH3-TPD and CO2-TPD, respectively.27–30 The desorption temperatures of NH3 from the ZrO2 catalysts were about 470 K (Fig. S5†), and no NH3 desorption peak was observed at a temperature above 673 K. The indication was that the acid sites on the ZrO2 catalysts were weakly acidic, presumably because they were Lewis acids.28 The desorption temperature of NH3 on a Brønsted acid has been reported to be more than 673 K.28 The concentration of acid sites was calculated from the NH3 desorption peak area around 470 K (Table 3). The desorption temperatures of CO2 from the ZrO2 catalysts were 340–450 K (Fig. S6†), indication being that the base sites on the ZrO2 catalysts were weakly basic.30 A plot of the lactic acid yields as a function of the concentration of acid and base sites on the ZrO2 catalysts (Fig. 3) revealed that the lactic acid yield did not depend on the ZrO2 crystal phase. The results showed almost a linear relationship between the lactic acid yield and the concentration of acid and base sites on the ZrO2 samples. Yang et al. have reported that a combination of Lewis acid and base sites catalyzes xylose conversion into glyceraldehyde and glycolaldehyde via a retro-aldol reaction.24 We propose (Scheme 2) that the reaction mechanism of fructose conversion into glyceraldehyde and dihydroxyacetone by a retro-aldol reaction involves a combination of acid and base sites on ZrO2. Initially, the carbonyl group of the fructose interacts with the Zr site of the Lewis acid, and at the same time the OH group at the position of the C-4 carbon adsorbs onto the O site of the week base (Scheme 2). Cleavage of the C–C bond between the C-3 and C-4 of fructose then leads to the formation of glyceraldehyde and dihydroxyacetone. To understand how ZrO2 catalyzes the conversion of intermediates into lactic acid after the retro-aldol reaction, we used dihydroxyacetone, glyceraldehyde, and pyruvaldehyde as reactants under the same conditions as those used to convert cellulose using ZrO2 (Table 4). Glyceraldehyde, one of the intermediates in the retro-aldol reaction of fructose, was converted into lactic acid whether ZrO2 was present or not, the indication being that the conversion of glyceraldehyde into lactic acid did not require a ZrO2 catalyst, and this step proceeded in high-temperature (473 K) water. Dihydroxyacetone, the other intermediate from the retro-aldol reaction of fructose, was converted into lactic acid, the yield being higher with ZrO2 (28.7%) than without ZrO2 (17.5%). Without ZrO2, dihydroxyacetone was isomerized into glyceraldehyde, and the glyceraldehyde was then converted into lactic acid. This sequence of reactions occurred because pyruvaldehyde, the other possible intermediate produced from dihydroxyacetone, requires ZrO2 as a catalyst to produce lactic acid. The conversion of pyruvaldehyde into lactic acid was reported to require Lewis acid sites workable in water such as TiO2.31–33 In the case of dihydroxyacetone conversion catalyzed by ZrO2, the ZrO2 catalytically enhanced dihydroxyacetone isomerization into glyceraldehyde or dihydroxyacetone conversion into pyruvaldehyde, and then both glyceraldehyde and pyruvaldehyde were converted into lactic acid with ZrO2 as the catalyst.
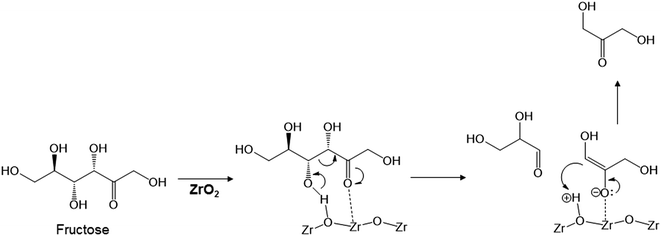 | ||
| Scheme 2 Proposed mechanism for fructose conversion into glyceraldehyde and dihydroxyacetone by a retro-aldol reaction on acid and base sites of ZrO2. | ||
| Reactant | Catalyst | Yield (%) | |||
|---|---|---|---|---|---|
| Lactic acid | HMF | Levulinic acid | Furfural | ||
| a Reaction conditions: 0.25 g reactant, 1 g ZrO2 (ZRO-7), 50 g water, 473 K reaction temperature, 6 h reaction time. | |||||
| Dihydroxyacetone | — | 17.5 | 0.0 | 0.0 | 0.0 |
| Dihydroxyacetone | ZrO2 | 28.7 | 0.0 | 0.0 | 0.0 |
| Glyceraldehyde | — | 22.5 | 0.0 | 0.0 | 0.0 |
| Glyceraldehyde | ZrO2 | 24.0 | 0.0 | 0.0 | 0.0 |
| Pyruvaldehyde | — | 1.0 | 0.0 | 0.0 | 0.0 |
| Pyruvaldehyde | ZrO2 | 22.8 | 0.0 | 0.0 | 0.0 |
Reusability of the ZrO2 catalyst
ICP analysis indicated that very little Zr was leached out (10−4%) from ZrO2 (ZRO-7) into water during the reaction. We also investigated the extent to which the ZrO2 catalyst could be reused to convert cellulose into lactic acid. After each reaction, the catalyst was separated from the liquid product by filtration, and then it was calcined at 673 K for 15 h in air to remove any carbon deposited on the surface of the catalyst. The lactic acid yield decreased slightly after the first reaction (Fig. 4), but it stabilized after the second reaction. After five uses, the ZRO-7 catalyst showed the same XRD patterns as the fresh ZRO-7 catalyst and the concentration of acid sites did not change (0.128 mmol g−1) from 0.118 mmol g−1 of the fresh ZRO-7 catalyst; however, the concentration of base sites decreased to 0.350 mmol g−1 from 0.485 mmol g−1 after five uses, the result being a slight decrease of catalytic activity.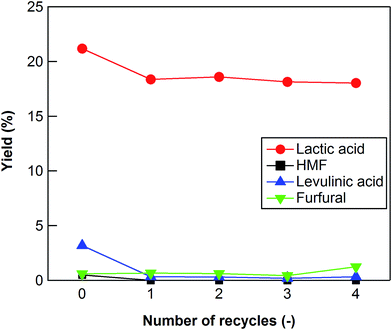 | ||
| Fig. 4 Cellulose conversion using a recycled ZrO2 catalyst. Reaction conditions: 0.5 g ball-milled cellulose, 1 g ZrO2 (ZRO-7), 50 g water, 473 K reaction temperature, 6 h reaction time. | ||
The reported heterogeneous catalysts LaCoO3,12 AlW,13 and NbF5-AlF3 (ref. 14) provided 24, 28, and 27% yield of lactic acid from cellulose, respectively. The catalysts, however, are problematic in that metal species leach from solution during the reaction. Also, the high cost of preparation of these heterogeneous catalysts makes their industrial use problematic. In this study, we showed that relatively inexpensive ZrO2 functions as a catalyst to accelerate the conversion of cellulose into lactic acid (yield 21.2%) and that only 10−4% of the Zr is leached out during the reaction.
Conclusions
Cellulose conversion into lactic acid was investigated using various transition metal oxides ZrO2, Al2O3, TiO2, Fe3O4, V2O5, CeO2, Y2O3, Tm2O3, HfO2, Ga2O3, MgO, La2O3, Nb2O5, and Ta2O5. The ZrO2 showed catalytic activity for lactic acid production from cellulose (lactic acid yield 21.2%) at 473 K for 6 h. Various types of ZrO2 were also used to convert cellulose to lactic acid. The correlation between lactic acid yields and the characteristic properties of the ZrO2 indicated that the amounts of acid and base sites on the ZrO2 played an important role in cellulose conversion into lactic acid. The combination of acid and base sites on the ZrO2 was hypothesized to enhance the key step of fructose conversion into glyceraldehyde and dihydroxyacetone by a retro-aldol reaction. The ZrO2 catalyst was stable in high-temperature water, and almost no Zr leached out of the catalyst into solution during the reaction.Acknowledgements
We acknowledge Dr Osamu Sato (AIST) for his helpful technical discussions about preparing ZrO2. This study was partially supported by the Thailand Research Fund (IRG5780001) and a NRCT-NSFC joint funding project (NRCT/2558-104).References
- X. Tong, Y. Ma and Y. Li, Appl. Catal., A, 2010, 385, 1–13 CrossRef CAS.
- H. Kobayashi, T. Komanoya, S. K. Guha, K. Hara and A. Fukuoka, Appl. Catal., A, 2011, 409–410, 13–20 CrossRef CAS.
- P. Gallezot, Chem. Soc. Rev., 2012, 41, 1538–1558 RSC.
- R. Datta and M. Henry, J. Chem. Technol. Biotechnol., 2006, 81, 1119–1129 CrossRef CAS.
- P. Mäki-Arvela, I. L. Simakova, T. Salmi and D. Y. Murzin, Chem. Rev., 2014, 114, 1909–1971 CrossRef PubMed.
- D. Garlotta, J. Polym. Environ., 2001, 9, 63–84 CrossRef CAS.
- K. M. Nampoothiri, N. R. Nair and R. P. John, Bioresour. Technol., 2010, 101, 8493–8501 CrossRef PubMed.
- S. Varadarajan and D. J. Miller, Biotechnol. Prog., 1999, 15, 845–854 CrossRef CAS PubMed.
- F. A. C. Martinez, E. M. Balciunas, J. M. Salgado, J. M. D. González, A. Converti and R. P. D. S. Oliveira, Trends Food Sci. Technol., 2013, 30, 70–83 CrossRef CAS.
- Y. Wang, W. Deng, B. Wang, Q. Zhang, X. Wan, Z. Tang, Y. Wang, C. Zhu, Z. Cao, G. Wang and H. Wan, Nat. Commun., 2013, 4, 2141 Search PubMed.
- X. Lei, F.-F. Wang, C.-L. Liu, R.-Z. Yang and W.-S. Dong, Appl. Catal., A, 2014, 482, 78–83 CrossRef CAS.
- X. Yang, L. Yang, W. Fan and H. Lin, Catal. Today, 2016, 269, 56–64 CrossRef CAS.
- F. Chambon, F. Rataboul, C. Pinel, A. Cabiac, E. Guillon and N. Essayem, Appl. Catal., B, 2011, 105, 171–181 CrossRef CAS.
- S. M. Coman, M. Verziu, A. Tirsoaga, B. Jurca, C. Teodorescu, V. Kuncser, V. I. Parvulescu, G. Scholz and E. Kemnitz, ACS Catal., 2015, 5, 3013–3026 CrossRef CAS.
- J. Yu and P. E. Savage, Appl. Catal., B, 2001, 31, 123–132 CrossRef CAS.
- M. Watanabe, H. Inomata and K. Arai, Biomass Bioenergy, 2002, 22, 405–410 CrossRef CAS.
- J. A. Wang, M. A. Valenzuela, J. Salmones, A. Vázquez, A. García-Ruiz and X. Bokhimi, Catal. Today, 2001, 68, 21–30 CrossRef CAS.
- A. Yamaguchi, N. Hiyoshi, O. Sato, K. K. Bando and M. Shirai, ChemSusChem, 2010, 3, 737–741 CrossRef CAS PubMed.
- A. Yamaguchi, O. Sato, N. Mimura, Y. Hirosaki, H. Kobayashi, A. Fukuoka and M. Shirai, Catal. Commun., 2014, 54, 22–26 CrossRef CAS.
- J. M. R. Gallo, D. M. Alonso, M. A. Mellmer and J. A. Dumesic, Green Chem., 2013, 15, 85–90 RSC.
- R. Weingarten, W. C. Conner Jr and G. W. Huber, Energy Environ. Sci., 2012, 5, 7559–7574 CAS.
- F. Jin, Z. Zhou, H. Enomoto, T. Moriya and H. Higashijima, Chem. Lett., 2004, 33, 126–127 CrossRef CAS.
- B. M. Kabyemela, T. Adschiri, R. M. Malaluan and K. Arai, Ind. Eng. Chem. Res., 1999, 38, 2888–2895 CrossRef CAS.
- L. Yang, J. Su, S. Carl, J. G. Lynam, X. Yang and H. Lin, Appl. Catal., B, 2015, 162, 149–157 CrossRef CAS.
- L. Yang, X. Yang, E. Tian and H. Lin, ChemSusChem, 2016, 9, 36–41 CrossRef CAS PubMed.
- L. Yang, X. Yang, E. Tian, V. Vattipalli, W. Fan and H. Lin, J. Catal., 2016, 333, 207–216 CrossRef CAS.
- K. Tomishige, Y. Ikeda, T. Sakaihori and K. Fujimoto, J. Catal., 2000, 192, 355–362 CrossRef CAS.
- M. E. Manríquez, T. López, R. Gómez and J. Navarrete, J. Mol. Catal. A: Chem., 2004, 220, 229–237 CrossRef.
- M. Watanabe, Y. Aizawa, T. Iida, R. Nishimura and H. Inomata, Appl. Catal., A, 2005, 295, 150–156 CrossRef CAS.
- Z.-Y. Ma, C. Yang, W. Wei, W.-H. Li and Y.-H. Sun, J. Mol. Catal. A: Chem., 2005, 227, 119–124 CrossRef CAS.
- K. Nakajima, R. Noma, M. Kitano and M. Hara, J. Phys. Chem. C, 2013, 117, 16028–16033 CAS.
- M. Hara, Bull. Chem. Soc. Jpn., 2014, 87, 931–941 CrossRef CAS.
- P. P. Pescarmona, K. P. F. Janssen, C. Delaet, C. Stroobants, K. Houthoofd, A. Philippaerts, C. De Jonghe, J. S. Paul, P. A. Jacobs and B. F. Sels, Green Chem., 2010, 12, 1083–1089 RSC.
Footnote |
| † Electronic supplementary information (ESI) available. See DOI: 10.1039/c6ra28568f |
| This journal is © The Royal Society of Chemistry 2017 |

