 Open Access Article
Creative Commons Attribution 3.0 Unported Licence
Synthesis of Li2Ni2(MoO4)3 as a high-performance positive electrode for asymmetric supercapacitors†
Dongwei Dua,
Rong Lana,
Kui Xiec,
Huanting Wang b and
Shanwen Tao
 *ab
*ab
aSchool of Engineering, University of Warwick, Coventry CV4 7AL, UK. E-mail: S.Tao.1@warwick.ac.uk
bDepartment of Chemical Engineering, Monash University, Clayton, Victoria 3800, Australia
cKey Lab of Design and Assembly of Functional Nanostructure, Fujian Institute of Research on the Structure of Matter, Chinese Academy of Sciences, Fuzhou, Fujian 350002, China
First published on 27th February 2017
Abstract
A NASICON-type compound, Li2Ni2(MoO4)3 was successfully synthesized via a combustion method. The as-synthesized Li2Ni2(MoO4)3 is fiber-like grains with an average length of 1–2 μm. As an electrode for pseudocapacitors, in 2 M LiOH, its specific capacitance reached 1137 F g−1 and 717 F g−1 at current density of 1 A g−1 and 20 A g−1 respectively, exhibiting 63% capacity retention. Moreover, in asymmetric supercapacitors with an activated carbon electrode as the negative electrode, the energy density of 36.5 W h kg−1 was obtained at the average power density of 420 W kg−1. The fabricated asymmetric supercapacitor also exhibited good electrochemical stability, specifically, the specific capacitance was retained at 68% of the initial value even after 10![[thin space (1/6-em)]](https://www.rsc.org/images/entities/char_2009.gif) 000 cycles at 2 A g−1. These observations suggest that the prepared Li2Ni2(MoO4)3 is a prospective candidate for high-performance supercapacitors.
000 cycles at 2 A g−1. These observations suggest that the prepared Li2Ni2(MoO4)3 is a prospective candidate for high-performance supercapacitors.
1. Introduction
It is believed that there are many issues related to traditional fossil fuel energy supply techniques, such as the climate changes and limited reserves, therefore considerable attention has been paid to renewable energy sources.1 As a consequence, efficient energy storage systems are in high demand to make the best use of the sources. Electrochemical energy storage systems, including batteries and supercapacitors, are some of the most promising energy storage systems with a broad range of applications. Among different types of electrochemical energy storage devices, supercapacitors have attracted great interest because of their relatively high power density, fast charge/discharge capability and exceptional cycle life.2–10 Generally, supercapacitors can be classified into two categories depending on the energy storage mechanisms: electrical double layer capacitors (EDLCs) and pseudocapacitors.11 EDLCs involve reversible adsorption of the ions at the electrode/electrolyte interface without any chemical reactions, which are commonly related to carbon-based materials with high surface area.12,13 In terms of the pseudocapacitors, fast and reversible faradaic reactions at the electrode surface are utilized to contribute the energy storage capability.14,15 Typically, the transition metal oxides,16–18 hydroxides,19,20 sulfides21,22 and conducting polymers23 such as polypyrroles,24 polyanilines25 and polythiophenes26 are applied as the active materials for pseudocapacitors. The pseudocapacitors usually present larger specific capacitance than the EDLCs, nevertheless, the lower energy density compared to batteries limit its applications.As mentioned above, the reversible ion adsorption of the pseudocapacitive materials usually takes place at the electrode surface, which may limit the energy storage capacity. It can be deduced that the energy density could be improved if the bulk ion intercalation is achieved because the extra ion adsorption into the active materials will contribute more capacitance. From this point of view, it is important to explore appropriate materials which can allow the ion intercalation/deintercalation without the structure destruction. Lukatskaya et al. demonstrated the electrochemical intercalation of cations including Li+, Na+, K+, NH4+, Mg2+ and Al3+ from aqueous solutions into the two-dimensional Ti3C2 MXene layers.27 Recently, a NASICON-type compound Li2Co2(MoO4)3 was synthesized and its electrochemical performances was investigated in different alkaline electrolyte.28 It was found that the Li2Co2(MoO4)3 electrode displayed remarkable specific capacitance as pseudocapacitive material for supercapacitors, namely, 1055 to 700 F g−1 at the current density from 1 A g−1 to 50 A g−1 in LiOH solution. Moreover, higher specific capacitance was obtained in lithium-based electrolyte than in sodium and potassium-based electrolytes, which is attributed to the easier intercalation of the small Li+ ions into the crystallographic structure of the Li2Co2(MoO4)3. As the NASICON-type compounds have a large family, the work opens up a new type of material which could present good supercapacitor performances.
Li2Ni2(MoO4)3, as a member of NASICON-type compounds, has been studied as positive electrode in lithium batteries.29–31 In this work, the Li2Ni2(MoO4)3 was synthesized via a combustion method. Its electrochemical properties were firstly evaluated in a three-electrode system in alkaline electrolytes. The specific capacitance reaches 1137 F g−1 at 1 A g−1 and 717 F g−1 at 20 A g−1 in 2 M LiOH, exhibiting 63% capacity retention. Moreover, the Li2Ni2(MoO4)3 electrode was fabricated with an activated carbon (AC) electrode forming an asymmetric supercapacitor (ASC). The ASC displays an energy density as high as 36.5 W h kg−1 at the average power density of 420 W kg−1. It also demonstrates excellent electrochemical stability, specifically, the specific capacitance still retains 68% of the initial value even after 10![[thin space (1/6-em)]](https://www.rsc.org/images/entities/char_2009.gif) 000 cycles at 2 A g−1. These results suggest that the prepared Li2Ni2(MoO4)3 is a prospective candidate for the high-performance energy storage devices.
000 cycles at 2 A g−1. These results suggest that the prepared Li2Ni2(MoO4)3 is a prospective candidate for the high-performance energy storage devices.
2. Experimental section
2.1. Synthesis of Li2Ni2(MoO4)3
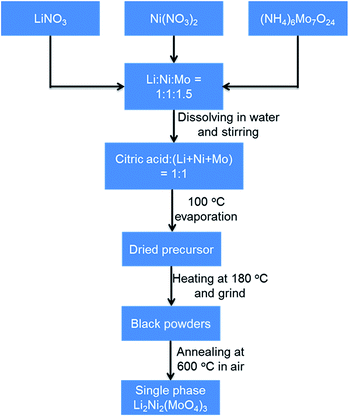
The Li2Ni2(MoO4)3 compound was synthesized by a combustion method similar to a method described in previous studies.29,31 The sequential synthesis procedures are described in Scheme 1. Specifically, aqueous solutions containing the lithium nitrate, nickel nitrate hexahydrate and ammonium molybdate tetrahydrate were homogeneously mixed with an appropriate stoichiometry of Li![[thin space (1/6-em)]](https://www.rsc.org/images/entities/char_2009.gif) :
:![[thin space (1/6-em)]](https://www.rsc.org/images/entities/char_2009.gif) Ni
Ni![[thin space (1/6-em)]](https://www.rsc.org/images/entities/char_2009.gif) :
:![[thin space (1/6-em)]](https://www.rsc.org/images/entities/char_2009.gif) Mo at 1
Mo at 1![[thin space (1/6-em)]](https://www.rsc.org/images/entities/char_2009.gif) :
:![[thin space (1/6-em)]](https://www.rsc.org/images/entities/char_2009.gif) 1
1![[thin space (1/6-em)]](https://www.rsc.org/images/entities/char_2009.gif) :
:![[thin space (1/6-em)]](https://www.rsc.org/images/entities/char_2009.gif) 1.5.
1.5.
Subsequently, citric acid was added to the solution at stoichiometric amount of 1![[thin space (1/6-em)]](https://www.rsc.org/images/entities/char_2009.gif) :
:![[thin space (1/6-em)]](https://www.rsc.org/images/entities/char_2009.gif) 1 to the total metal ions. The resulted solution was stirred overnight and then heated to boiling at around 100 °C to evaporate water. Then the resulted dried precursor was further heated at 180 °C to obtain black ash. The ash was ground into powders with a mortar. The single-phase powders of Li2Ni2(MoO4)3 in yellow were obtained upon annealing the as-prepared powders at 600 °C for 4 h in ambient air. Na2Ni2(MoO4)3 was synthesized using the same method by replacing LiNO3 with NaNO3.
1 to the total metal ions. The resulted solution was stirred overnight and then heated to boiling at around 100 °C to evaporate water. Then the resulted dried precursor was further heated at 180 °C to obtain black ash. The ash was ground into powders with a mortar. The single-phase powders of Li2Ni2(MoO4)3 in yellow were obtained upon annealing the as-prepared powders at 600 °C for 4 h in ambient air. Na2Ni2(MoO4)3 was synthesized using the same method by replacing LiNO3 with NaNO3.
2.2. Electrode preparation for electrochemical characterization
The working electrode was prepared by mixing the as-synthesized Li2Ni2(MoO4)3 powders with acetylene black and polytetrafluoroethylene (PTFE) in a mass ratio of 85![[thin space (1/6-em)]](https://www.rsc.org/images/entities/char_2009.gif) :
:![[thin space (1/6-em)]](https://www.rsc.org/images/entities/char_2009.gif) 10
10![[thin space (1/6-em)]](https://www.rsc.org/images/entities/char_2009.gif) :
:![[thin space (1/6-em)]](https://www.rsc.org/images/entities/char_2009.gif) 5 in water under magnetic stirring to make slurry. Then the slurry was coated onto a piece of Ni foam (1 × 1 cm2), pressed at 10 MPa, and finally dried at 60 °C in a vacuum oven overnight. The mass loading of the active materials on the Ni foam was 1.5 mg cm−2.
5 in water under magnetic stirring to make slurry. Then the slurry was coated onto a piece of Ni foam (1 × 1 cm2), pressed at 10 MPa, and finally dried at 60 °C in a vacuum oven overnight. The mass loading of the active materials on the Ni foam was 1.5 mg cm−2.
2.3. Assemble of Li2Ni2(MoO4)3//AC asymmetric supercapacitor
To fabricate the asymmetric supercapacitor, the as-prepared Li2Ni2(MoO4)3 electrode and an activated carbon (AC) electrode were used as positive electrode and negative electrode, respectively. The AC negative electrode was obtained by mixing the activated carbon (Black Pearl 2000, Cabot) and PTFE at a mass ratio of 95![[thin space (1/6-em)]](https://www.rsc.org/images/entities/char_2009.gif) :
:![[thin space (1/6-em)]](https://www.rsc.org/images/entities/char_2009.gif) 5 in water under constant magnetic stirring. The prepared slurry was spread onto a Ni foam (1 × 1 cm2) and then pressed at 10 MPa and dried at 60 °C overnight under vacuum. To assemble the full cell, the negative electrode and positive electrode were face to face placed into a container in which the electrolyte was added.18
5 in water under constant magnetic stirring. The prepared slurry was spread onto a Ni foam (1 × 1 cm2) and then pressed at 10 MPa and dried at 60 °C overnight under vacuum. To assemble the full cell, the negative electrode and positive electrode were face to face placed into a container in which the electrolyte was added.18
2.4. Material characterizations
2.5. Calculations
The specific capacitance of the electrode in three-electrode mode was calculated from the galvanostatic charge–discharge curves according to the following equation:32
 | (1) |
| q = Cs × ΔV × m | (2) |
 | (3) |
Additionally, the specific capacitance of the asymmetric supercapacitor was also calculated from the galvanostatic charge–discharge curves with the same formula:35
 | (4) |
The energy densities and corresponding power densities of the asymmetric supercapacitor were obtained by the following equations:35,36
 | (5) |
 | (6) |
3. Results and discussion
The thermal stability and phase formation process of the Li2Ni2(MoO4)3 was evaluated by simultaneous thermogravimetric analysis (TG) and differential scanning calorimetry (DSC). Fig. 1a shows the typical TG-DSC curves of the Li2Ni2(MoO4)3 precursor complex, the small endothermic peak at ∼81 °C is due to desorption of adsorbed water while the exothermic peaks between 200 and 600 °C can be attributed to the decomposition of the precursors. The total weight loss is about 52 wt%, and it terminates at around 600 °C, indicating the completion of the phase formation reaction. Therefore, the products were annealed at 600 °C and the corresponded TG-DSC curves are in Fig. 1b. The phase purity and structure of the synthesized Li2Ni2(MoO4)3 were examined by X-ray diffraction (XRD). It can be seen from Fig. 2a, the observed peaks of the sample are consistent with the peaks from the orthorhombic Li2Ni2(MoO4)3 (ICCD 04-009-2490), confirming the formation of a well crystalline single-phase with orthorhombic structure. In addition, the polyhedral structure of Li2Ni2(MoO4)3 drawn by CrystalMaker Software is shown in Fig. 2b. The 3D framework is composed of MoO4 tetrahedron and NiO6 octahedron with Li atoms occupying the sites between them. This open structure could favor the intercalation/deintercalation of small-sized ions such as Li+ ions which has been confirmed in previous studies.29,30 Not only for lithium ion battery, this property can also be used to develop electrode materials for supercapacitors.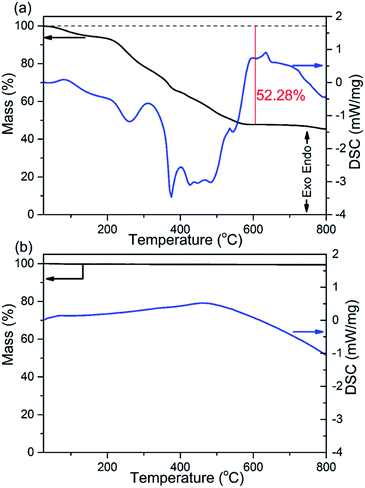 | ||
| Fig. 1 TG and DSC curves of (a) the Li2Ni2(MoO4)3 precursor complex and (b) the 600 °C annealed Li2Ni2(MoO4)3. | ||
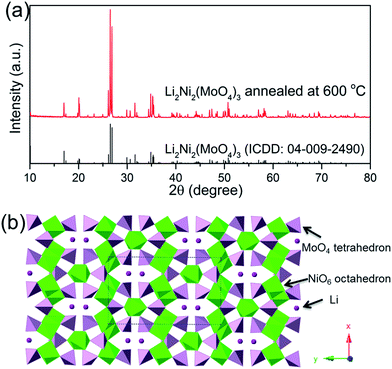 | ||
| Fig. 2 (a) XRD patterns of the Li2Ni2(MoO4)3 after annealed at 600 °C, (b) crystal structure of Li2Ni2(MoO4)3. | ||
The morphology properties of the synthesized Li2Ni2(MoO4)3 were investigated by scanning electron microscopy (SEM). Fig. 3a and b exhibits the SEM images of the sample at different magnifications. It is clear that the sample is composed of fiber-like grains, which is consistent with those in the literatures.29,31 Fig. 3b indicates the grains are loosely agglomerated which could facilitate electrolyte access during the electrochemical test. In addition, each grain is well connected with the others, which could lead to an improvement on conductivity. The average secondary particle size is roughly 1–2 μm. Energy-Dispersive X-ray spectroscopy studies (EDX) on selected area indicates the existence of Ni, Mo and O elements (Fig. S1†).
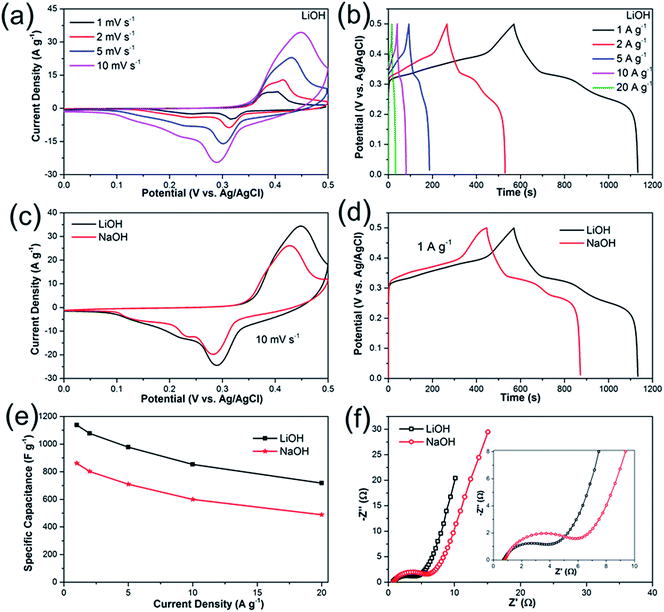
To explore the electrochemical properties of the Li2Ni2(MoO4)3 material, the prepared electrode was tested using a typical three-electrode system. Fig. 4a presents the CV curves of Li2Ni2(MoO4)3 electrode at various scan rate from 1 to 10 mV s−1 in the potential range between 0 and 0.5 V vs. Ag/AgCl in 2 M LiOH aqueous solution. The anodic and cathodic peaks indicate the pseudocapacitive behavior of the Li2Ni2(MoO4)3, showing good reversibility. The peak positions are slightly changed with the increase of the scan rate but still reversible. In terms of the CV behaviors in 2 M NaOH solution (Fig. 4c), similar results are obtained. But noticeably, the CV curve in Li-based electrolyte displays larger enclosed area than it in Na-based electrolyte at the same scan rate, implying higher capacitance, which means that the charge delivered by the intercalation/deintercalation of Li+ ions is higher than that of Na+ ions. The possible reason is that, Li+ ions are much smaller than Na+ ions thus would be easier to be intercalated/deintercalated in the Li2Ni2(MoO4)3 lattice. Fig. 4b shows the GCD curves at various current densities from 1 to 20 A g−1 in LiOH. It can be observed that nonlinear charge–discharge profiles are in GCD curves, which further support the pseudocapacitive characteristics of the Li2Ni2(MoO4)3. Fig. 4d compares GCD curves at 1 A g−1 in LiOH and NaOH. The specific capacitance of the electrode in LiOH and NaOH calculated from the GCD curves is shown in Fig. 4e. The capacitance decreases from 1137 F g−1 (1.7 F cm−2) at 1 A g−1 to 717 F g−1 (1.08 F cm−2) at 20 A g−1, performing 63% capacity retention. The impact of the ion size is also reflected on the GCD, the capacitances in NaOH are 860 F g−1 (1.3 F cm−2) at 1 A g−1 and 488 F g−1 (0.73 F cm−2) at 20 A g−1, which is much lower than the values obtained in LiOH, which are consistent with the CV results. Overall, it can be concluded that the small size Li+ ions are easier to intercalate into the Li2Ni2(MoO4)3, which also originally contains Li in the structure. To further understand the electrochemical behavior of the Li2Ni2(MoO4)3 electrode, electrochemical impedance spectroscopy (EIS) measurement was performed in the frequency range from 100 kHz to 0.01 Hz at open circuit potential with the amplitude at 5 mV. From Fig. 4f, in both LiOH and NaOH, the Nyquist plots of the Li2Ni2(MoO4)3 electrode are composed of two parts, namely, a semicircle in high-frequency region followed by a linear component in low-frequency region. The intercept of the plots at the real axis represents the equivalent series resistance (Rs), including the ionic resistance of the electrolyte, intrinsic resistance of active materials and the contact resistance between the active materials and current collector,37–39 the Rs in LiOH is 0.71 Ω while that in NaOH is 0.78 Ω, almost the same, this can be attributed to the tiny ionic resistance difference between LiOH and NaOH. In terms of the semicircle, its diameter represents the charge transfer resistance (Rct) of the system.37–39 The corresponding Rct values of the Li2Ni2(MoO4)3 electrode are 4.2 Ω and 5.2 Ω in LiOH and NaOH solution respectively, implying the easier and more rapid charge transfer in LiOH solution. In the low-frequency region, the straight line indicates the Warburg impedance (Zw),37–39 associating to the diffusion of the electrolyte ions along the bulk Li2Ni2(MoO4)3. The steeper slope of the straight line exhibited in LiOH demonstrates a smaller Zw of the LiOH electrolyte ion diffusion, which explains the improved electrochemical performance of the Li2Ni2(MoO4)3 electrode in LiOH.
The high electrochemical performances of Li2Ni2(MoO4)3 electrode such as high capacitance and outstanding rate capability can be attributed to well-connected fiber-like structure, which improves the ion transport. Moreover, the Li2Ni2(MoO4)3, as a NASICON-type material, supplies the channels for the intercalation/deintercalation of Li+ ions without structure destruction.
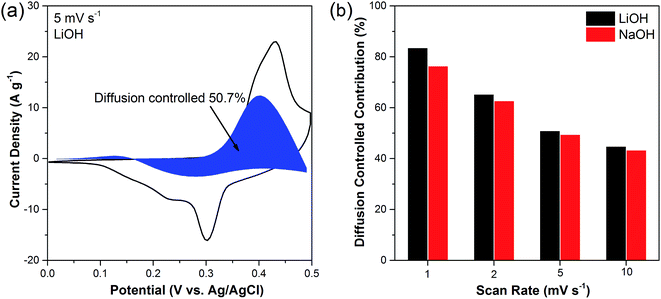
It is known that the charge stored in the electrode is contributed by diffusion-controlled faradaic process and capacitive process. The specific contribution of diffusion-controlled process and capacitive effects could be quantified by the following equation:40–43
| i = k1ν + k2ν1/2 |
| i/ν1/2 = k1ν1/2 + k2 | (7) |
A Na-containing NASICON material with nominal composition Na2Ni2(MoO4)3 was synthesised using the same method to compare the performance with Li2Ni2(MoO4)3. Fig. S2a† shows TG and DSC curves of the Na2Ni2(MoO4)3 precursor complex. Based on the results, the products were annealed at 600 °C and the corresponded X-ray XRD patterns are presented in Fig. S2b.† As no standard data was indexed for the Na2Ni2(MoO4)3 from the database, it is hard to confirm if the single-phase is obtained. Nevertheless, majority of the observed peaks of the sample are consistent with the peaks from Na1.86Ni2.07(MoO4)3 (ICDD: 00-031-1315) (Fig. S2b†), which may prove that there is a similar structure between the two materials. According to the Na2MoO4–NiMoO4–Fe2(MoO4)3 phase diagram, the solubility limit of Na2−2xNi2+x(MoO4)3 solid solution lies at 0 ≤ x ≤ 0.7.44 Therefore Na1.86Ni2.07(MoO4)3 (x = 0.07) and Na2Ni2(MoO4)3 (x = 0) should exhibit the same structure.
The electrochemical properties of nominal Na2Ni2(MoO4)3 in different electrolyte LiOH and NaOH are demonstrated in Fig. S3.† The nominal Na2Ni2(MoO4)3 exhibits higher capacitance in LiOH than in NaOH, implying the charge delivered by the intercalation/deintercalation of Li+ ions is higher than that of Na+ ions. It can deduce that in the Na2Ni2(MoO4)3 lattice, Li+ ions are easier to be intercalated/deintercalated than Na+ ions, which could be attributed to the smaller size of Li+ ions. The highest capacitance of nominal Na2Ni2(MoO4)3 performed is 835 F g−1 at 1 A g−1 in LiOH, which is still lower than the value obtained by Li2Ni2(MoO4)3 (1137 F g−1). The Na2Ni2(MoO4)3 also shows a larger resistance than Li2Ni2(MoO4)3 (Fig. S3d†). Similar to the Li2Ni2(MoO4)3, the capacitance contribution of diffusion-controlled process is larger in LiOH at a given scan rate, while the percentage decreases gradually with the increase of the scan rate in both LiOH and NaOH (Fig. S4†). In conclusion, the overall performance of Li2Ni2(MoO4)3 is better than Na2Ni2(MoO4)3.
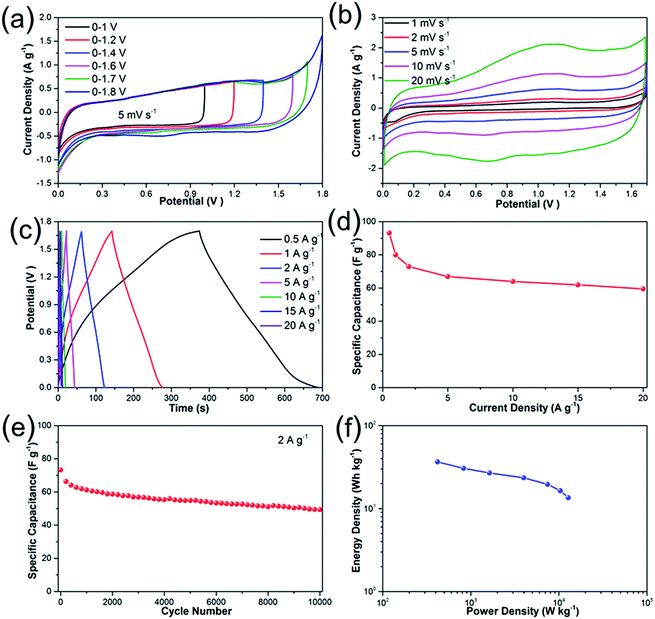
To further investigate the electrochemical performances of Li2Ni2(MoO4)3 under practical conditions, we have assembled an asymmetric supercapacitor (ASC) by employing the prepared Li2Ni2(MoO4)3 electrode as positive electrode and AC electrode as negative electrode. The electrochemical properties of AC electrode exhibits typical features of double layer capacitors (see more details in Fig. S5†). A series of CV measurements at different voltage windows were performed at 5 mV s−1 to determine the optimal working potential of the ASC. According to the Fig. 6a, the stable operating voltage window can be extended as high as 1.7 V, and the polarization curve becomes very obvious when the potential increases to 1.8 V, indicating severe electrolysis of water. Therefore, all the measurements of the ASC were carried out between 0 and 1.7 V. Fig. 6b depicts the CV behaviors of the ASC at different scan rates ranging from 1 to 20 mV s−1. It should be noticed that the ASC performs quasi-rectangular CV curves in all scans, illustrating that the capacitance is contributed by both electric double-layer capacitance and pseudocapacitance. The charge–discharge curves measured at the current densities from 0.5 to 20 A g−1 are shown in Fig. 6c. The discharge curves are nonlinear especially at lower current densities, suggesting combination effects of the electric double-layer capacitance and pseudocapacitance for the ASC, which coincides with the above CV results. The specific capacitance calculated from the GCD curves is presented in Fig. 6d. The capacitance is 93 F g−1 at current densities of 0.5 A g−1, and the value gradually deceases to 73 F g−1 at 2 A g−1, which is comparable with some previous ASCs.45,46 Impressively, the as-fabricated asymmetric supercapacitor reveals excellent rate capability from 5 to 20 A g−1: the capacitances are 67, 64, 62 and 59 F g−1 at current densities of 5, 10, 15 and 20 A g−1, respectively. To further investigate the durability of the asymmetric supercapacitor, the cycling performance was evaluated at 2 A g−1 (Fig. 6e). The specific capacitance decreases about 20% of the initial value for the first 2000 cycles, which might be caused by the dissolution of the active materials47 and the destruction of the electrode under rapid redox reactions.48 The electrode experiences a decrease around 10% of the capacitance during the rest 8000 cycles, demonstrating excellent electrochemical stability. The overall specific capacitance retention is 68% after 10![[thin space (1/6-em)]](https://www.rsc.org/images/entities/char_2009.gif) 000 cycles, which can be also evidenced by first and last ten charge–discharge curves (Fig. S6†). The performance decay could be caused by the irreversibility of the Faraday reaction or the destruction of active materials after numerous redox reactions.7,49 The Ragone-plots of the asymmetric supercapacitor depending on the discharge curved are displayed in Fig. 6f. A maximum energy density of 36.5 W h kg−1 is delivered at the power density of 420 W kg−1 based on the total mass. It maintains 13.5 W h kg−1 at high power density of 12
000 cycles, which can be also evidenced by first and last ten charge–discharge curves (Fig. S6†). The performance decay could be caused by the irreversibility of the Faraday reaction or the destruction of active materials after numerous redox reactions.7,49 The Ragone-plots of the asymmetric supercapacitor depending on the discharge curved are displayed in Fig. 6f. A maximum energy density of 36.5 W h kg−1 is delivered at the power density of 420 W kg−1 based on the total mass. It maintains 13.5 W h kg−1 at high power density of 12![[thin space (1/6-em)]](https://www.rsc.org/images/entities/char_2009.gif) 783 W kg−1.
783 W kg−1.
4. Conclusions
In summary, we have successfully synthesized the Li2Ni2(MoO4)3 through a combustion method. The Li2Ni2(MoO4)3 electrode exhibits excellent electrochemical performances and it displays higher specific capacitance in LiOH than in NaOH, which can be attributed to the easier intercalation/deintercalation of small Li+ ions in the NASICON-type structure. The specific capacitance reaches 1137 F g−1 at 1 A g−1 in 2 M LiOH, and still maintains 63% at 20 A g−1. Moreover, in an asymmetric supercapacitor (ASC) with an activated carbon electrode as negative electrode, it delivers energy density as high as 36.5 W h kg−1 at the average power density of 420 W kg−1. After 10![[thin space (1/6-em)]](https://www.rsc.org/images/entities/char_2009.gif) 000 cycles at 2 A g−1, the capacitance retains 68% of the initial value, showing reasonably good stability. The remarkable specific capacitance with reasonable cycling stability suggest the potential of the Li2Ni2(MoO4)3 to be used as a high-performance candidate for energy storage.
000 cycles at 2 A g−1, the capacitance retains 68% of the initial value, showing reasonably good stability. The remarkable specific capacitance with reasonable cycling stability suggest the potential of the Li2Ni2(MoO4)3 to be used as a high-performance candidate for energy storage.
Acknowledgements
The authors thank EPSRC for funding (Grant No. EP/K021036/2). One of the authors (Du) thanks University of Warwick for a PhD studentship.References
- L. L. Zhang and X. Zhao, Chem. Soc. Rev., 2009, 38, 2520–2531 RSC.
- Y. Zhu, S. Murali, M. D. Stoller, K. Ganesh, W. Cai, P. J. Ferreira, A. Pirkle, R. M. Wallace, K. A. Cychosz and M. Thommes, Science, 2011, 332, 1537–1541 CrossRef CAS PubMed.
- P. Simon and Y. Gogotsi, Nat. Mater., 2008, 7, 845–854 CrossRef CAS PubMed.
- S. Chen, W. Xing, J. Duan, X. Hu and S. Z. Qiao, J. Mater. Chem. A, 2013, 1, 2941–2954 CAS.
- X. H. Xiong, D. Ding, D. C. Chen, G. Waller, Y. F. Bu, Z. X. Wang and M. L. Liu, Nano Energy, 2015, 11, 154–161 CrossRef CAS.
- L. Zhu, Y. Liu, C. Su, W. Zhou, M. L. Liu and Z. P. Shao, Angew. Chem., Int. Ed., 2016, 55, 9575–9578 Search PubMed.
- Y. Zhao, L. Hu, S. Zhao and L. Wu, Adv. Funct. Mater., 2016, 26, 4085–4093 CrossRef CAS.
- Q. Zhang, C. Liao, T. Zhai and H. Li, Electrochim. Acta, 2016, 196, 470–478 CrossRef CAS.
- N. Wang, P. Zhao, K. Liang, M. Q. Yao, Y. Yang and W. C. Hu, Chem. Eng. J., 2017, 307, 105–112 CrossRef CAS.
- P. Zhang, J. Y. Zhou, W. J. Chen, Y. Y. Zhao, X. M. Mu, Z. X. Zhang, X. J. Pan and E. Q. Xie, Chem. Eng. J., 2017, 307, 687–695 CrossRef CAS.
- G. Yu, X. Xie, L. Pan, Z. Bao and Y. Cui, Nano Energy, 2013, 2, 213–234 CrossRef CAS.
- T. Lin, I.-W. Chen, F. Liu, C. Yang, H. Bi, F. Xu and F. Huang, Science, 2015, 350, 1508–1513 CrossRef CAS PubMed.
- M. D. Stoller, S. Park, Y. Zhu, J. An and R. S. Ruoff, Nano Lett., 2008, 8, 3498–3502 CrossRef CAS PubMed.
- C. Xiang, M. Li, M. Zhi, A. Manivannan and N. Wu, J. Power Sources, 2013, 226, 65–70 CrossRef CAS.
- H. Lai, Q. Wu, J. Zhao, L. Shang, H. Li, R. Che, Z. Lyu, J. Xiong, L. Yang and X. Wang, Energy Environ. Sci., 2016, 9, 2053–2060 CAS.
- G. Xiong, K. Hembram, R. Reifenberger and T. S. Fisher, J. Power Sources, 2013, 227, 254–259 CrossRef CAS.
- X. Yu, B. Lu and Z. Xu, Adv. Mater., 2014, 26, 1044–1051 CrossRef CAS PubMed.
- D. D. Du, R. Lan, W. Xu, R. Beanland, H. T. Wang and S. W. Tao, J. Mater. Chem. A, 2016, 4, 17749–17756 CAS.
- Y.-Z. Su, K. Xiao, N. Li, Z.-Q. Liu and S.-Z. Qiao, J. Mater. Chem. A, 2014, 2, 13845–13853 CAS.
- J. Ji, L. L. Zhang, H. Ji, Y. Li, X. Zhao, X. Bai, X. Fan, F. Zhang and R. S. Ruoff, ACS Nano, 2013, 7, 6237–6243 CrossRef CAS PubMed.
- H. Chen, J. Jiang, L. Zhang, D. Xia, Y. Zhao, D. Guo, T. Qi and H. Wan, J. Power Sources, 2014, 254, 249–257 CrossRef CAS.
- M. Acerce, D. Voiry and M. Chhowalla, Nat. Nanotechnol., 2015, 10, 313–318 CrossRef CAS PubMed.
- G. A. Snook, P. Kao and A. S. Best, J. Power Sources, 2011, 196, 1–12 CrossRef CAS.
- L.-Z. Fan and J. Maier, Electrochem. Commun., 2006, 8, 937–940 CrossRef CAS.
- Y. Meng, K. Wang, Y. Zhang and Z. Wei, Adv. Mater., 2013, 25, 6985–6990 CrossRef CAS PubMed.
- R. B. Ambade, S. B. Ambade, N. K. Shrestha, Y.-C. Nah, S.-H. Han, W. Lee and S.-H. Lee, Chem. Commun., 2013, 49, 2308–2310 RSC.
- M. R. Lukatskaya, O. Mashtalir, C. E. Ren, Y. Dall'Agnese, P. Rozier, P. L. Taberna, M. Naguib, P. Simon, M. W. Barsoum and Y. Gogotsi, Science, 2013, 341, 1502–1505 CrossRef CAS PubMed.
- K. M. Hercule, Q. Wei, O. K. Asare, L. Qu, A. M. Khan, M. Yan, C. Du, W. Chen and L. Mai, Adv. Energy Mater., 2015, 5 DOI:10.1002/aenm.201500060.
- S. Prabaharan, A. Fauzi, M. Michael and K. Begam, Solid State Ionics, 2004, 171, 157–165 CrossRef CAS.
- K. Begam and S. Prabaharan, J. Power Sources, 2006, 159, 319–322 CrossRef CAS.
- K. Begam, M. Michael, Y. Taufiq-Yap and S. Prabaharan, Electrochem. Solid-State Lett., 2004, 7, A242–A246 CrossRef CAS.
- J. Yang, X. Duan, W. Guo, D. Li, H. Zhang and W. Zheng, Nano Energy, 2014, 5, 74–81 CrossRef CAS.
- Z. Fan, J. Yan, T. Wei, L. Zhi, G. Ning, T. Li and F. Wei, Adv. Funct. Mater., 2011, 21, 2366–2375 CrossRef CAS.
- V. Khomenko, E. Raymundo-Pinero and F. Béguin, J. Power Sources, 2006, 153, 183–190 CrossRef CAS.
- X. Wang, A. Sumboja, M. Lin, J. Yan and P. S. Lee, Nanoscale, 2012, 4, 7266–7272 RSC.
- S. Peng, L. Li, H. B. Wu, S. Madhavi and X. W. D. Lou, Adv. Energy Mater., 2015, 5, 1401172 CrossRef.
- X. Zhang, Y. Zhao and C. Xu, Nanoscale, 2014, 6, 3638–3646 RSC.
- S. E. Moosavifard, J. Shamsi, S. Fani and S. Kadkhodazade, RSC Adv., 2014, 4, 52555–52561 RSC.
- M.-C. Liu, L. Kang, L.-B. Kong, C. Lu, X.-J. Ma, X.-M. Li and Y.-C. Luo, RSC Adv., 2013, 3, 6472–6478 RSC.
- T. Brezesinski, J. Wang, S. H. Tolbert and B. Dunn, Nat. Mater., 2010, 9, 146–151 CrossRef CAS PubMed.
- M. S. Javed, X. Han, C. Hu, M. Zhou, Z. Huang, X. Tang and X. Gu, ACS Appl. Mater. Interfaces, 2016, 8, 24621–24628 CAS.
- X. Shan, D. S. Charles, Y. Lei, R. Qiao, G. Wang, W. Yang, M. Feygenson, D. Su and X. Teng, Nat. Commun., 2016, 7, 13370 CrossRef CAS PubMed.
- X. Xia, D. Chao, Y. Zhang, J. Zhan, Y. Zhong, X. Wang, Y. Wang, Z. X. Shen, J. Tu and H. J. Fan, Small, 2016, 12, 3048–3058 CrossRef CAS PubMed.
- N. M. Kozhevnikova and A. V. Imekhenova, Russ. J. Inorg. Chem., 2009, 54, 638–643 CrossRef.
- Y. Xu, J. Wei, L. Tan, J. Yu and Y. Chen, J. Mater. Chem. A, 2015, 3, 7121–7131 CAS.
- S. H. Kazemi, M. Tabibpour, M. A. Kiani and H. Kazemi, RSC Adv., 2016, 6, 71156–71164 RSC.
- Y. Li, J. Jian, Y. Fan, H. Wang, L. Yu, G. Cheng, J. Zhou and M. Sun, RSC Adv., 2016, 6, 69627–69633 RSC.
- Y. Zhao, L. Hu, S. Zhao and L. Wu, Adv. Funct. Mater., 2016, 26, 4085–4093 CrossRef CAS.
- Y. Li, J. Jian, L. Xiao, H. Wang, L. Yu, G. Cheng, J. Zhou and M. Sun, Mater. Lett., 2016, 184, 21–24 CrossRef CAS.
Footnote |
| † Electronic supplementary information (ESI) available: EDS analysis and charge/discharge curves. See DOI: 10.1039/c6ra28580e |
| This journal is © The Royal Society of Chemistry 2017 |

