 Open Access Article
Creative Commons Attribution 3.0 Unported Licence
Synthesis of stable cationic waterborne polyurethane with a high solid content: insight from simulation to experiment
Meng Li *a,
Fen Liua,
Yu Lia and
Xihuai Qiang*b
aDepartment of Applied Chemistry, School of Science, Xi'an Jiaotong University, Xi'an 710049, People's Republic of China. E-mail: limeng0721@stu.xjtu.edu.cn
bCollege of Bioresources Chemical and Materials Engineering, Shaanxi University of Science & Technology, Xi'an 710021, People's Republic of China. E-mail: qiangxihuai@163.com
First published on 27th February 2017
Abstract
Stable cationic waterborne polyurethanes (CWPUs) with a high solid content (HSC) were synthesized via the combination of cationic ionic and nonionic segments (polyoxyethylene alkyl amine, PAE). The process was based on an iterative strategy to design the cationic groups in soft segments and the chain terminal of polyurethanes (terminal ions) together with the determination of the optimal bimodal particle size distribution (PSD). The effects of the polymerization degree of poly(ethylene glycol) groups (PEG-g) in PAE and its interaction with the hydrophilic groups N-methyl diethanolamine (MDEA) in polyurethane were studied. It was found that the terminal ions resulted in a much finer dispersion, better dispersion stability, smaller particle size and lower viscosity. Moreover, the highest solid content (52.18%) of CWPU was obtained by the incorporation of PAE and a low terminal ions content of 2.5%, which had a bimodal particle size distribution. The increasing length of PEG-g was also found to enhance the thermal stability and render a better mechanical stability for the polyurethane films as the increasing PEG-g length may weaken the hydrogen bonding and reduce the extent of phase separation. The experimental results were further compared with molecular dynamic simulation results, which verified that the specific molecular structure of this WPU ensured its excellent properties. The static structure and dynamic properties obtained strongly supported the experimental observations reported on the morphology and thermal and mechanical properties of these polyurethanes.
Introduction
Owing to strict environmental and legislative pressures, the use of conventional solvent-based polyurethanes has steadily been discouraged. As a type of multi-functional environmentally friendly material, waterborne polyurethanes (WPUs) with excellent properties can be used in a wide range of fields such as coatings, adhesives, inks, biological materials, building materials, automotive, textiles and other industries.1–5 From the viewpoint of materials technology, the important properties are the static and dynamic mechanical properties, acoustic, optical and electrical properties, as well as corrosion resistance, chemical performance, adhesive properties and biological performance of PU plastic.6–8 However, there are still many disadvantages reported for WPUs developed in their present state. For instance, compared to conventional solvent-based polyurethanes, WPUs exhibit a slower drying rate due to the high latent heat of evaporation of water. Besides, a longer drying time and higher energy consumption is usually required for WPUs to achieve enough mechanical strength, due to the linear hydrophilic groups.6 This is not beneficial to meet the time efficiency and economic benefit requirements. Hence, research nowadays is mainly focused on the preparation of WPUs with a high solid content, which is of growing interest both in the field of scientific research and in industrial applications.9–13 As an important category of WPUs, cationic waterborne polyurethanes show excellent adhesion to anionic-substrates, such as glass and leather;14 however, products made with CWPUs are relatively rare to date. Nonionic hydrophilic monomers are also employed to synthesize WPUs. However, as far as we know, in the published work, the solid content of waterborne polyurethanes mainly ranges from 20 to 40 wt%, and the synthesis of WPUs with a solid content higher than 50% is rarely reported in the literature, in which most of the published work is dominated by the synthesis of anionic WPUs.The critical point to obtain WPUs with a high solid content is to effectively control the latex viscosity. The viscosity of a latex increases extremely rapidly with the augmentation of the solid content, especially above the upper limit of the solid content,15,16 since the particles are so crowded that the interactions between neighbouring particles are strong.17 Particle size distribution (PSD) is an important parameter in determining the relationship between the solid content and viscosity,18,19 and one of the key points to obtaining a high solid content with low viscosity (HSC/LV) is to control the particle size and its distribution. Generally, it is possible to increase the upper limit of solid content of WPUs with a multimodal PSD, since the small particles are able to fit into the interstices between large particles, thus weakening the particles' interactions. Furthermore, if the difference between the particle diameters and the volume percentage is located in a reasonable range, small particles could efficiently pack into the voids among the large particles, thus increasing the maximum packing factor of the particles.20,21
Another method to decrease the viscosity of WPUs is to reduce the dosage of ionic monomers in polyurethane, which can suppress the swelling of latex particles22 caused by the electric double layer, along with the electroviscous effect of latex particles. So reduction of the dosage of ionic monomers in polyurethane can increase the solid content. Lee and Kim23 designed a WPU with ionic groups merely in soft segments and chain terminals, which made the hydrophilic groups easily enter the surface of particles, and thus a solid content up to 45% was achieved with the dosage of DMPA down to 2%. However, the decrease in ionic groups possibly will lead to poor latex stability. Hou and his co-workers11 synthesized a WPU with a high solid content via the combination of ionic and nonionic monomers. Although one of the WPU's solid content reached a maximum value of 52%, this work only focused on PEG systems, where the products are anionic polyurethanes. Other relative research work reported by Y. Chen and Y. L. Chen verified that a minimum content of –COOH (0.178 mmol g−1 or 2.4% DMPA) is required to form stable dispersions.24 All the existing research indicates that employing ionic monomers alone has a limited ability for developing high solid content WPUs.
As to the synthesis of WPUs, the combination of ionic and nonionic monomers was employed to obtain finer particles than possible just using ionic monomers alone,25 which implies that the combination has a positive effect on the dispersion and stability properties of WPUs. In these processes, the ionic centres were incorporated as chain extenders and were located in the hard segments. Consequently, the mobility of the ionic segments was very much limited by the rigidity of the hard segments, and the ionic groups were not well exposed to the particle surfaces, which ensured more ionic groups to produce a stable dispersion. Besides, the connection relationships of anionic and nonionic monomers or the position of those hydrophilic groups in polyurethane should also have an influence on the dispersion and stability properties of WPUs.26 Namely, the combination of ionic and nonionic monomers, normally containing oxyethyl segments, has a synergistic effect on WPUs, leading to fine particle sizes and a stable dispersion with low hydrophilic groups.
Nowadays, the structural design and property characterization of WPUs are mainly based on laboratory trial and error experiments, which is necessary but time-consuming and not efficient. In the case of cationic WPUs, since the polymerization process is much more violent than that of anionic one, and the emulsifying capacity of cationic hydrophilic monomers is lower than that of anionic monomers, detailed experimental as well as theoretical studies on the structure–property relationship of CWPUs have not been widely reported. Computer simulation in turn can provide an attractive complement or substitute tool to support the efforts involved in the synthesis and characterization of new products.27–29 Moreover, molecular simulations have played an increasingly important role in materials modelling and subsequent technology development, as they can reveal the microscopic pictures of underlying mechanisms that are otherwise experimentally inaccessible or difficult to obtain.30,31 In addition, molecular simulations can also provide an insight into the microcosmic structural changes ultimately responsible for the macrocosmic behaviour. Raghu et al.7 investigated the effects of hard segments in the polyurethane chain on the cohesive energy density, the surface properties and the solubility parameter values by using MD simulations and an experimental method, and they reported that the simulation results showed good agreement with the experimental data. Rahmati and his co-workers27 investigated the effect of the degree of polyurethane polymerization on the structural, physical and separation properties via the use of grand canonical Monte Carlo and molecular dynamic methods.
Considering the lack of studies in the existing literature, in this study reported here, we combined atomistic simulations and laboratory experiments to explore the synergistic effect on the combination of cation ionic (MDEA) and nonionic monomers (PAE) in polyurethane, and designed the ionic groups in the terminal of the main chain polyurethane as well as in the hard and soft segments. The effect of MDEA and PEG-g in PAE on the dispersion size, viscosity and stability of latex were then analyzed. The thermal and mechanical properties of the derived films were also studied. The main objective of the work was to obtain a further understanding of the key factors important to synthesize CWPUs with a high solid content, as well to reveal the relations between the micro-simulation and macro-experiments. Meanwhile, this strategy could provide a novel synthetic scheme to CWPUs with a high solid content.
Experimental
Main materials
Isophorone diisocyanate (IPDI, Aladdin) and 2,4-tolylene diisocyanate (TDI, Aladdin) were purified by distillation under a reduced pressure of 1330 Pa at 120 °C. Poly(neopentylglycol adipate) (PNGA) (Mn = 1000, Shengfang Co., China) and N-methyl diethanolamine (MDEA, Aladdin) were both dried in an oven at 120 °C for 2 h. Acetone was distilled and kept on a 4 Å molecular sieve before use. Poly(oxyethylene alkyl amine) (PAE, PAE1205, PAE1210, PAE1220, PAE1230, Shengfang Co., China), di-n-butyltin dilaurate (DBTDL) and acetic acid were used as received. Acetic acid, acetone and DBTDL were all products of Aladdin Co.Molecular design and synthesis of the CWPUs
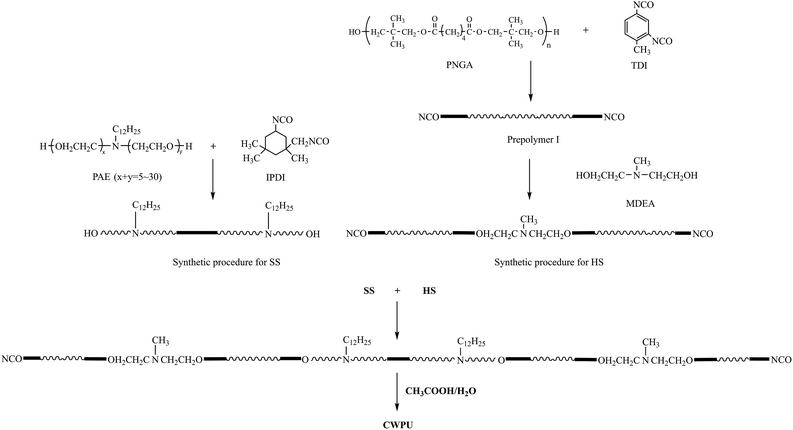
The first step in the synthesis of the WPUs was to introduce the cationic and nonionic segment into the soft segment (SS), which was to be used to produce the OH-terminated soft segments from IPDI and PAE. The second step was to locate the cationic groups in the chain termini and to build up the NCO-terminated hard segments (HSs) through two processes. First, prepolymer I was synthesized based on TDI and PNGA. Then, MDEA was reacted with prepolymer I to build up the HS. Finally, the OH-terminated SS was added to the reactor and reacted with NCO-terminated HS to obtain the cationic polyurethanes (Scheme 1).A 250 mL round-bottomed, four-necked flask equipped with a nitrogen inlet, a condenser with a drying tube, a mechanical stirrer and a thermometer were used for the reaction. The synthesis of CWPU (Scheme 1) was catalyzed by DBTDL (0.03% based on the total solid content). The reactions were implemented at 80 °C until the theoretical NCO values were obtained, as determined by the dibutylamine titration method (ASTM D2572-97(2010)). Acetone was added at the same time to reduce the viscosity. Then, acetic acid as a neutralizing agent was not added into the reaction until the mixture was slowly cooled to 40 °C. The neutralization reaction proceeded at the same temperature for 30 min. Finally, distilled water was added to the mixture (based on 50% solid) with agitation at high shearing rates (2000 rpm) to emulsify the solution. The CWPU was obtained after the removal of acetone from the emulsion at 50 °C by rotary vacuum evaporation under reduced pressure. The formulations used to prepare the CWPU are given in Table 1.
| Samplea | Hard segment | Soft segment | PEGb monomers | Stability/6 months | MCc | SCd | |||
|---|---|---|---|---|---|---|---|---|---|
| TDI | PNGA | MDEA | IPDI | PAE | |||||
| a Sample code was named according to the content of PEG-g and MDEA; for example, P10-25 means containing 10 PEG-g in PAE and 2.5% MDEA.b The content of PEG-g in PAE approximate PEG monomers.c MC = MDEA content based on total weight of polymer.d SC = solid content of CWPU.e NS = no sedimentation; LS = little sedimentation; MS = much sedimentation. | |||||||||
| P05-15 | 1.85 | 1.00 | 0.24 | 0.50 | 1.00 | PEG-g-200 | MSe | 1.5 | — |
| P10-15 | 1.90 | 1.00 | 0.26 | 0.50 | 1.00 | PEG-g-400 | NS | 1.5 | 43.37 |
| P20-15 | 1.95 | 1.00 | 0.32 | 0.50 | 1.00 | PEG-g-1000 | NS | 1.5 | 43.26 |
| P30-15 | 2.00 | 1.00 | 0.38 | 0.50 | 1.00 | PEG-g-1500 | NS | 1.5 | 42.06 |
| P05-25 | 2.00 | 1.00 | 0.40 | 0.50 | 1.00 | PEG-g-200 | NS | 2.5 | 47.77 |
| P10-25 | 2.05 | 1.00 | 0.45 | 0.50 | 1.00 | PEG-g-400 | NS | 2.5 | 52.18 |
| P20-25 | 2.15 | 1.00 | 0.55 | 0.50 | 1.00 | PEG-g-1000 | NS | 2.5 | 49.15 |
| P30-25 | 2.25 | 1.00 | 0.65 | 0.50 | 1.00 | PEG-g-1500 | NS | 2.5 | 45.53 |
| P05-35 | 2.20 | 1.00 | 0.58 | 0.50 | 1.00 | PEG-g-200 | NS | 3.5 | 49.57 |
| P10-35 | 2.25 | 1.00 | 0.65 | 0.50 | 1.00 | PEG-g-400 | NS | 3.5 | 50.08 |
| P20-35 | 2.40 | 1.00 | 0.79 | 0.50 | 1.00 | PEG-g-1000 | NS | 3.5 | 46.66 |
| P30-35 | 2.55 | 1.00 | 0.93 | 0.50 | 1.00 | PEG-g-1500 | LS | 3.5 | 41.68 |
| P00-15 | 2.36 | 2.00 | 0.30 | — | — | — | MS | 1.5 | — |
| P00-25 | 2.65 | 2.00 | 0.50 | — | — | — | LS | 2.5 | 42.34 |
| P00-35 | 3.00 | 2.00 | 0.82 | — | — | — | NS | 3.5 | 45.08 |
Characterization
A latex film was prepared for further testing by casting the emulsion on a Teflon plate and drying at ambient temperature for 7 days and then in a vacuum system at 50 °C for 2 days.The Fourier transform infrared (FTIR) spectrum was recorded with a Perkin-Elmer Spectrum 100 FTIR spectrometer in the range 4000–500 cm−1 using a thin film prepared by casting a dilute DMF solution of the latex onto KBr flake and then evaporating DMF by heating under the infrared lamp.
The average particle sizes of the polyurethane dispersions were determined by a Zetasizer Nano-s (Malvern Instruments). Approximately 0.1 mL of the dispersion was diluted with 3 mL deionized water before the measurements. All the samples were measured at a temperature of 25 °C.
Transmission electron microscopy (TEM) images were obtained from a HITACHI-H7650 Microscope with an accelerating voltage of 80 kV, with the samples stained by 0.2 wt% phosphotungstic acid hydrate before observation.
Thermogravimetric analysis (TGA) was performed using a TGA Q5000 thermogravimetric analyzer (TA Instruments). The samples were placed in an alumina crucible and heated at 10 °C min−1 from 30 °C to 500 °C under a N2 atmosphere, where the flow rate of N2 was 30 mL min−1.
The DSC experiments were carried out in a DSC-200 instrument (NET-ZSCH, Germany). An aluminium pan containing 10–15 mg of sample was heated from −70 °C to 100 °C under a nitrogen atmosphere (flow rate: 40 mL min−1). The heating rate was 10 °C min−1. The first heating run was carried out to remove the thermal history of the samples. From the second heating run, the DSC curve of the sample was obtained.
The viscosities of the CWPU dispersion were measured in a Brookfield digital viscometer (Model DVII). Measurements were carried out at 25 °C using spindle No. 1 at 30 rpm.
The tensile properties of the cast films were measured at room temperature using an Instron 5566 testing machine, according to the ASTM D-412 specifications. A crosshead speed of 100 mm min−1 was used.
Stability of the CWPU: every day, 50 mL latex was placed in a glass bottle at room temperature to observe the condition of the latex, and it was recorded the number of days when lamination or precipitation had occurred.
The percentage of swelling for a particular film was determined by measuring its weight increase as a function of time using the equation:
 | (1) |
Molecular dynamic simulations
Simulation detail
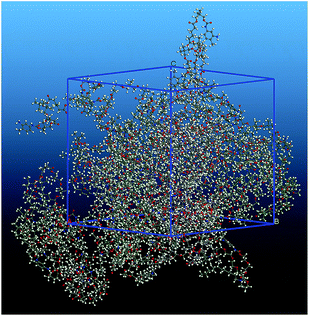
Atomistic molecular dynamic simulations were conducted using the software package LAMMPS (Large-scale Atomic/Molecular Massively Parallel Simulator)32 and analysis was partially carried out using VMD.33 The simulations were carried out with the explicit-atom Dreiding34 force-field for the calculation. The simulation cells were cubic with periodic boundary conditions in all three dimensions. For all the samples, we first put one chain of each polymer in a cubic cell, and after minimizing the energy we replicated the cell 8 times, so there were 8 chains for each polymer in the new cell. The equations of motion were integrated with the velocity-Verlet integrator with a time step equal to 1 fs.35,36 Lennard-Jones and coulombic interactions had a cut-off value of 12.5 Å. Long-range coulombic interactions were computed using the PPPM37 method with the desired error in forces within 10−6 accuracy.Considering the computational accuracy and expense, the model size was controlled at approximately a maximum of 12![[thin space (1/6-em)]](https://www.rsc.org/images/entities/char_2009.gif) 000 atoms in the models. Periodic boundary conditions were applied to the cubic simulation cells. For each system, all the chosen configurations were subject to a 10 circle thermal annealing from 300 K to 600 K and then back to 300 K with 50 K intervals. At each temperature, a 100 ps NPT ensemble was performed at constant pressure (1 bar) with a time step of 1 fs. A Nose thermostat and Berendsen38 barostat were used in all the simulations. At this situation, the last configuration was further subject to a 50
000 atoms in the models. Periodic boundary conditions were applied to the cubic simulation cells. For each system, all the chosen configurations were subject to a 10 circle thermal annealing from 300 K to 600 K and then back to 300 K with 50 K intervals. At each temperature, a 100 ps NPT ensemble was performed at constant pressure (1 bar) with a time step of 1 fs. A Nose thermostat and Berendsen38 barostat were used in all the simulations. At this situation, the last configuration was further subject to a 50![[thin space (1/6-em)]](https://www.rsc.org/images/entities/char_2009.gif) 000 step energy minimization, followed by annealing. Then the system was cooled down at intervals of 20 K, followed by a 1 ns NPT simulation to obtain the final equilibrium density. Afterward, the 10 ns NPT and 5 ns NVT simulations were performed to collect the data. The atomic trajectory, which was recorded every picosecond, was suitable for the structural and equilibrium thermodynamic properties analysis. For the simulations, we used a 12 core machine CPUs Intel Xeon@CPU X5650@2.67 GHz.
000 step energy minimization, followed by annealing. Then the system was cooled down at intervals of 20 K, followed by a 1 ns NPT simulation to obtain the final equilibrium density. Afterward, the 10 ns NPT and 5 ns NVT simulations were performed to collect the data. The atomic trajectory, which was recorded every picosecond, was suitable for the structural and equilibrium thermodynamic properties analysis. For the simulations, we used a 12 core machine CPUs Intel Xeon@CPU X5650@2.67 GHz.
Dihedral scans
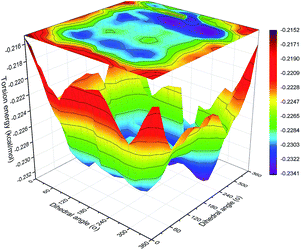
To obtain the contour surfaces of torsion energy vs. the dihedral angles of O–C–C–O and C–O–C–C in the backbone, double dihedral angle scan calculations of the C–C or O–C groups attached to adjacent bonds were carried out with Gaussian 09 (ref. 39) at the B3LYP-D3/6-311G(d,p) level.40–42 ‘D3’ indicates the DFT-D3 dispersion correction method,43 which was used to ensure the precision of the non-bond interaction calculations.44Results and discussion
FTIR spectra of the CWPU
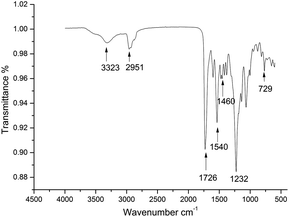
The expected chain structure of the CWPU was confirmed by FTIR spectroscopy and is displayed in Fig. 1. The FTIR spectra of P10-25 (other spectra of the samples are not presented here for simplicity) showed the typical absorption peaks of polyurethane at 3323 cm−1 [v(NH)], 2850–2964 cm−1 [v(CH2) and v(CH3)], and 1726 cm−1 [v(C![[double bond, length as m-dash]](https://www.rsc.org/images/entities/char_e001.gif) O)]. The typical NCO absorption peak at about 2273 cm−1 disappeared in P10-25, indicating that the NCO group had completely reacted. The peak at 1540 cm−1 was ascribed to the characteristic absorption peak of a quaternary ammonium salt. The characteristic absorption peaks of the bending vibration peak of a long alkyl chain and the rocking vibration peak of a long alkyl chain-(CH2)n-(n > 4) were observed at 1460, 1232 and 729 cm−1 in the WPU, respectively. This demonstrated that the PAE had been anchored onto the polyurethane chain.10,45
O)]. The typical NCO absorption peak at about 2273 cm−1 disappeared in P10-25, indicating that the NCO group had completely reacted. The peak at 1540 cm−1 was ascribed to the characteristic absorption peak of a quaternary ammonium salt. The characteristic absorption peaks of the bending vibration peak of a long alkyl chain and the rocking vibration peak of a long alkyl chain-(CH2)n-(n > 4) were observed at 1460, 1232 and 729 cm−1 in the WPU, respectively. This demonstrated that the PAE had been anchored onto the polyurethane chain.10,45
Effect of the combination of PEG-g in PAE and MDEA on the latexes properties
According to previous literature, highly stable WPUs with a high solid content can be obtained by some concrete influencing factors, such as the ionic group content, the position of cationic groups, the particle size distribution and the synergistic effect of cationic and nonionic groups. Those aspects were studied in the following section.The effect of the PEG-g content in PAE on the synthesized CWPU is shown in Fig. 2. There is an obvious improvement on the dispersion and stability properties for the CWPU-incorporated PAE. When using MDEA alone as a hydrophilic monomer, a stable latex can only be obtained with an MDEA content above 2.5%. Those results are in accordance with previous results. For the samples incorporated with PEG-g-400 (or PEG-g-1000), all the samples had smaller particles size than the one incorporated with PEG-g-1500. However, all the samples incorporated with PEG-g-200 exhibit the largest sizes, indicating PEG-g-200 has little effect on improving the dispersion and stability of CWPU. So the effect of PEG-g is in the order of: PEG-g-400 ≈ PEG-g-1000 > PEG-g-1500 ≫ PEG-g-200.
Synergistic effect of PEG-g and MDEA on the latexes properties
When incorporating PAE into polyurethane, the hydrophilic (–CH2–CH2–O–)n chains have the tendency to enter into the o/w interface and to decrease the σ value of the interface, leading to a smaller average particle size (according to the Laplace equation, ΔP = 2σ/r). However, the movement of PEG-g is limited by its neighbouring hydrophobic groups, resulting in PEG-g-200, which can hardly enter the surface of the latex particles and so contributes little to the dispersion and stability properties. As the molecular mass increases (Mn ≥ 400), the (–CH2–CH2–O–)n has a stronger hydrophilicity than that of PEG-g-200 and thus can enter the surface of latex particles, and consequently finer dispersion and stability properties are obtained. Also, the effect of PEG-g-1500 is not as good as PEG-g-400 or PEG-g-1000 (as illustrated by Table 2), which is probably due to insufficient presence of PEG-g-1500 in the interfacial film, which is mainly embedded into water to form a thick hydrated layer with long hydrophilic (–CH2–CH2–O–)n segments, and then the effect of the decreasing σ is weakened (Fig. 3).| Series | Dispersion size (nm) | Viscosity (mPa s) | Tensile strength/Mpa | Breaking elongation/% |
|---|---|---|---|---|
| P05-15 | 683.3 | 228 | — | — |
| P10-15 | 336.2 | 200 | 18.85 | 685 |
| P20-15 | 248.5 | 112 | 17.57 | 733 |
| P30-15 | 361.4 | 520 | 16.33 | 764 |
| P05-25 | 416.3 | 609 | 23.73 | 637 |
| P10-25 | 214.7 | 626 | 20.17 | 677 |
| P20-25 | 108.6 | 517 | 18.26 | 717 |
| P30-25 | 378.2 | 870 | 17.57 | 755 |
| P05-35 | 312.9 | 976 | 24.71 | 629 |
| P10-35 | 233.3 | 510 | 22.91 | 661 |
| P20-35 | 153.4 | 480 | 19.56 | 703 |
| P30-35 | 488.5 | 3770 | 18.82 | 733 |
| P00-15 | 589.6 | 272 | — | — |
| P00-25 | 337.8 | 708 | 26.01 | 618 |
| P00-35 | 215.6 | 950 | 27.85 | 607 |
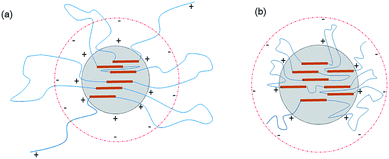 | ||
| Fig. 3 Schematic of the latex particles incorporated with PEG-g: (a) incorporated with PEG-g-400 and (b) incorporated with PEG-g-1500. | ||
Meanwhile, the particle size in the terminal ions was much smaller than that in the hard ions. This indicates that the concentration of ionic groups at the surface with the terminal chain is much higher than that with the hard chain. This can be explained by considering the chain rigidity of the hard segments, the chain flexibility of the soft segments, the high mobility and the low free energy of the chain ends. If the conformation change needs less energy, more ionic groups will be exposed to the surfaces during the dispersion. This leads to smaller particles with greater dispersion stability.
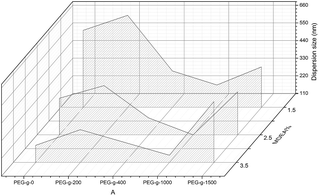
As to the samples containing PEG-g-400, the particle sizes decreased sharply with increasing the hydrophilic (–CH2–CH2–O–)n groups entering the o/w interface and the decreasing σ, whereas the particle sizes of the samples incorporated with PEG-g-1500 increased abruptly (as illustrated in Table 2 and Fig. 4), and the latex then became viscous with the same water addition. The results further prove the assumption that the long hydrophilic chains of PEG-g-1500 may form a thicker hydrated layer, which is not beneficial for decreasing the particle size, regardless of its role in decreasing σ.
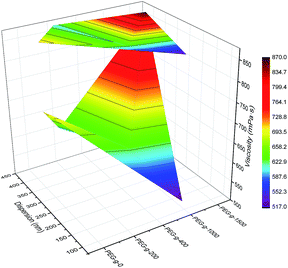 | ||
| Fig. 4 Synergistic effect of PEG-g and MDEA on particle size and viscosity of the CWPU (only 2.5% MDEA shown here for ease of visualization). | ||
Moreover, it was found that the change of particle size showed a different trend in the case of PEG-g combined with MDEA compared to using PEG-g alone as a hydrophilic monomer (nonionic WPU), where in the latter case the higher molecular mass of PEG-g resulted in smaller particle sizes of the latexes. Those results indicated that there was a synergistic effect between PEG-g and MDEA, which allows the hydrophilic groups in the CWPU to more easily enter into the o/w interface, resulting in better dispersion and stability.
Effect of PSD on the latexes properties
By optimizing the obvious synergistic effect of PEG-g with MDEA on CWPU, latexes with the best stability were obtained. Since the effects of PEG-g-400 and PEG-g-1000 are better than that of PEG-g-1500, we chose the system of CWPU with the dosage of MDEA as 2.5% (e.g. P05-25, P10-25, P20-25, P30-25) as representatives for the further experiments and analysis in the following section.As shown in Fig. 5 and Table 2, it is interesting to find that P05-25 and P10-25 exhibit a bimodal particle size distribution while P00-25 and P30-25 showed a unimodal particle size distribution. From P05-25 to P20-25, it can be seen in the particle size distribution graphs that two peaks of the samples become closer and finally emerge into one peak in P30-25.
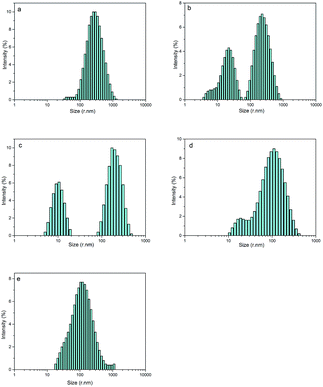 | ||
| Fig. 5 The particle size distribution of CWPU, (a) P00-25; (b) P05-25; (c) P10-25; (d) P20-25 and (e) P30-25. | ||
This phenomenon can be explained by the increment of PEG-g in the CWPU, resulting in the difference in the hydrophilicity of CWPU diminishing gradually and the average particle sizes tending to be close. As a matter of fact, the viscosity increased sharply from P20-25 to P30-25, and all samples in the present study showed the same trend. According to the research on traditional emulsions by Greenwood, small particles were able to fit into the packs among large particles when the diameter ratio of large particles to small particles was more than 5.67 (ref. 20) (Fig. 6). As shown in Fig. 5, P20-25 with the diameter ratio of 5.1 presented a relatively high viscosity, which can be explained by the fact that many of the small particles are not actually small enough to fit into the interstices among the large particles, thus decreasing the packing efficiency. However, the viscosity of P05-25 with the diameter ratio of 12.6 was higher than P10-25 with the diameter ratio of 7.2, indicating that the packing density decreased when the diameter ratio was too large. Therefore, a particle diameter ratio of 7.2 and a reasonable bimodal PSD are appropriate to raise the up limit of the solid content for the CWPU.
 | ||
| Fig. 6 A two-dimensional schematic showing the effect of the size of the smaller particles trying to pack into the pore among larger particles. | ||
Particle morphology of the CWPU
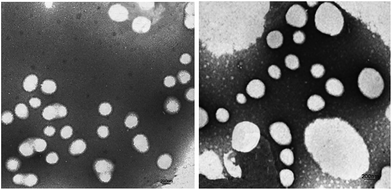
Fig. 7 shows the TEM images of P00-25 and P10-25. Both P00-25 and P10-25 contain globular particles, with P00-25 exhibiting a unimodal PSD and particle sizes around 600 nm, whereas P10-25 presented a bimodal PSD, with larger particles of 200–500 nm and smaller particles around 40 nm. The particle sizes and the diameter ratio of large particles to small particles are in good accordance with the above data.Effect of the combination of PEG-g and MDEA on the film properties
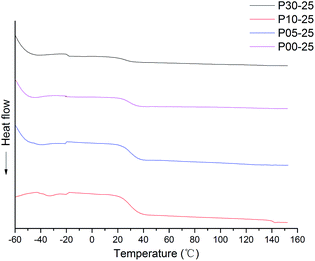
| Samples | Tgs/°C | Tgh/°C | T5%/°C | T10%/°C | T50%/°C |
|---|---|---|---|---|---|
| P00-25 | −40.3 | 32.2 | 139.34 | 182.60 | 297.85 |
| P05-25 | −52.2 | 30.2 | 149.98 | 208.14 | 325.27 |
| P10-25 | −54.8 | 28.1 | 157.58 | 212.53 | 330.01 |
| P30-25 | −55.3 | 24.7 | 177.15 | 220.56 | 361.81 |
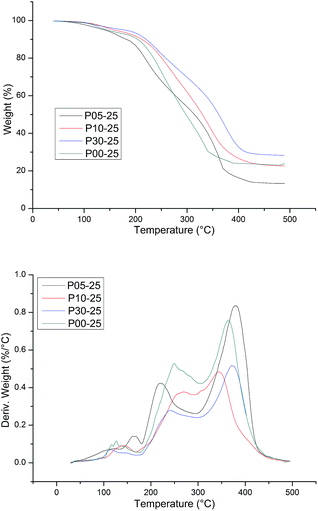
The thermal stability of WPU was evaluated by TG analysis. The typical TG and DTG curves of CWPU are shown in Fig. 9. TG analysis gave information, not only about the thermal stability of the polyurethanes but also on their structure, as the differentiated degradation steps of the hard and soft segments can be detected. What is especially important is the initial degradation temperature, which is dependent on the thermal stability of the weakest point(s) within the polyurethane macromolecule, i.e. urethane bonds and ester bonds. It is known that the hard segments are more prone to thermal decomposition than the soft segments in polyurethane. The basic process that takes place during degradation is depolymerization, i.e. the decomposition of PU to its parent substances: diisocyanate and polyols. The DTG curve of WPU presents a different degradation mechanism and indicates three stages of degradation. The first degradation at temperature ranges of 50–200 °C can be attributed to the volatilization of small molecular material remaining in the film. The second degradation at the temperature range of 250–350 °C mainly relates to the destruction of urethane groups. Finally, the maximum weight loss occurs within the range of 350–440 °C and most probably relates to the disruption reaction of ester bonds in polyester urethanes.
The thermal degradation temperatures of 5% weight loss (T5%), 10% weight loss (T10%) and 50% weight loss (T50%) are summarized in Table 3. As shown in Table 3, the higher the content of soft segments in a polymer is, the more stable the polymer is at elevated temperatures and the lower the initial rate of its degradation is. This phenomenon can be attributed to the length of PAE increasing, as it was shown that as the content of flexible segments in the polymer increases, the degree of phase separation decreases at the same time, and then there are lower hydrogen bonding interactions. The temperature of thermal resistance slightly increases in such cases. In addition, the presence of a side alkane groups in the CWPU reduces the potential for the formation of urethane–urethane hydrogen bonds, which makes it difficult for hard segments to agglomerate, i.e. their phase separation becomes hindered.45
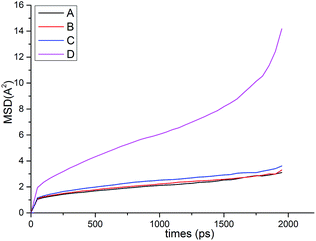
Molecular simulations
| MSD(t) = 〈|ri(t) − ri(0)|2〉 | (2) |
 | (3) |
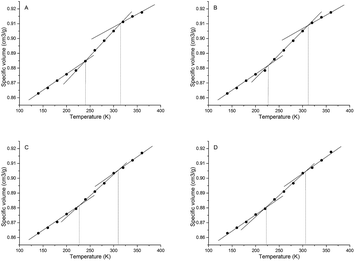
| Samplesa | Tgs/°C | Tgh/°C | Free volume/Å3 | Volume/Å3 | FFV/% | Rg/Å | Rete/Å | NHB/NO |
|---|---|---|---|---|---|---|---|---|
| a Samples A, B, C and D stand for P00-25, P05-25, P10-25 and P30-25, respectively. | ||||||||
| A | −33.2 | 41.1 | 13![[thin space (1/6-em)]](https://www.rsc.org/images/entities/char_2009.gif) 884.63 884.63 |
87![[thin space (1/6-em)]](https://www.rsc.org/images/entities/char_2009.gif) 975.15 975.15 |
15.78 | 31.38 | 16.23 | 0.092 |
| B | −46.2 | 38.8 | 13![[thin space (1/6-em)]](https://www.rsc.org/images/entities/char_2009.gif) 841.84 841.84 |
91![[thin space (1/6-em)]](https://www.rsc.org/images/entities/char_2009.gif) 022.55 022.55 |
15.21 | 41.33 | 18.75 | 0.087 |
| C | −47.3 | 36.5 | 14![[thin space (1/6-em)]](https://www.rsc.org/images/entities/char_2009.gif) 083.42 083.42 |
98![[thin space (1/6-em)]](https://www.rsc.org/images/entities/char_2009.gif) 037.49 037.49 |
14.37 | 55.44 | 19.90 | 0.078 |
| D | −50.5 | 32.9 | 17![[thin space (1/6-em)]](https://www.rsc.org/images/entities/char_2009.gif) 919.79 919.79 |
129![[thin space (1/6-em)]](https://www.rsc.org/images/entities/char_2009.gif) 540.96 540.96 |
13.83 | 58.40 | 23.20 | 0.061 |
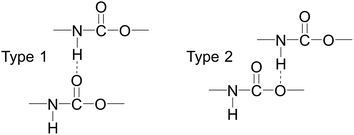
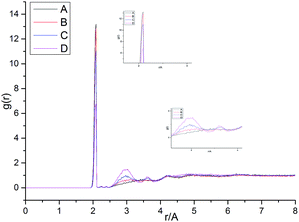
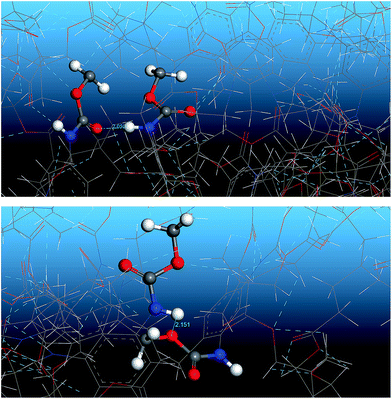
Fig. 13 shows the O⋯N RDFs in the samples at 298 K. It can be seen that the first peak appearing in each RDF curve in the range from 1.8 to 2.1 Å are generally lower in intensity with PEG-g increasing, indicating that the hydrogen bonds decrease with the increasing PEG-g as expected. However, the second and third peaks increased with increasing PEG-g, which was probably attributed to the different chain conformation of PEG-g in PAE. Note that all sharp peaks at distances greater than 4 Å are absent and the RDF tend to 1, which is generally regarded as proof of the amorphous nature of a polymer system.53 The NHB/NO ratio corresponds to the ratio of the total number of hydrogen bonds to the total number of oxygen atoms. As suggested by a previous study,54,55 a criterion of “H⋯O length ≤2.5 Å, C–O⋯H or N–H⋯O bond angle ≥120°” was adopted to count the total number of hydrogen bonds in each sample (Fig. 14). The calculated NHB/NO ratios of the different samples are shown in Table 4. It can be seen that the results are in accordance with the aforementioned results, i.e. the hydrogen bonds decrease with increasing PEG-g.
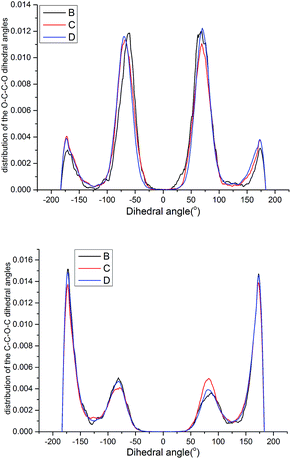 | ||
| Fig. 15 Probability distribution of the dihedral torsions for the O–C–C–O torsion (left) and C–O–C–C torsion (right) in the backbone. | ||
As shown in Fig. 15, all the samples had a helical conformation because the OC–CO angles exhibited a large population of the gauche conformation at ±70°, while the CC–OC angles have both gauche and trans states, which is in agreement with previous simulation studies and experimental results.56,57 Thus, the flexibility of the chains is related to the conformation structure of PEG-g in PAE. Chains with an ordered, all-trans conformation had low flexibility, whereas all the samples with a disordered, helical conformation had high flexibility.
As shown in Fig. 17, we plotted the average end-to-end distance and the average radius of gyration as a function of degree of polymerization (DP) for PEG-g on a log–log plot to verify the spatial structure of the polymer chain. We fitted these data to an equation of the form:
| y = A(DP)x | (4) |
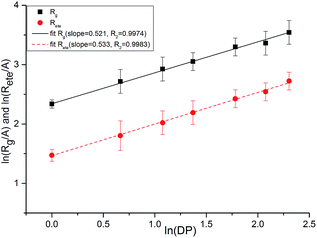 | ||
| Fig. 17 Average chain end-to-end distance (Rete) and chain radius of gyration (Rg) as a function of DP. | ||
Both the structural measures could be well fitted by eqn (4). The scaling exponents for the radius of gyration and the chain end-to-end distance were 0.521 and 0.533, respectively. These exponents are close to 0.5, which is the scaling exponent for the characteristic polymer size in the case of sufficiently long chains, where the chains behave as random walks (RWs), as shown by Kamio et al.58 As is known, polymer chains with a scale factor higher than 0.6 can be classified as rigid chains, and the higher the scale factor, the more rigid the polymer chains.55 All of those results indicated that the increasing DP could result in a more flexible polymer chain.
Conclusions
In this work, a series of stable CWPUs with a high solid content were synthesized via the introduction of cationic groups in soft segments and in the chain terminal of polyurethanes as well as by a combination of cationic ionic and nonionic segments. We explored the synergistic effect of cation ionic (MDEA) and nonionic monomers (PAE) in polyurethane, where the dispersion size, viscosity and stability of the latex were all successfully optimized. It was found that the effect on improving the dispersibility and stability was in the order of: PEG-g-400 ≈ PEG-g-1000 > PEG-g-1500 ≫ PEG-g-200, since the longer (–CH2–CH2–O–)n chain with stronger hydrophilicity can enter the surface of latex particles. We also found that an appropriate diameter ratio of latex particles can increase the packing efficiency and decrease the viscosity, thus raising the upper limit of the solid content for the CWPUs.The highest solid content (52.18%) CWPU was obtained by incorporation of PAE and a low terminal ions content (2.5%), which had a bimodal particle size distribution. We then chose representative samples and were able to show that the key factors to obtain a high solids content with low viscosities is the control of the particle size and its distribution. The thermal and tensile-strength properties of films derived from CWPUs were also analyzed. The results also showed that the temperature of thermal degradation slightly increases with the increasing length of PEG-g, which can be attributed to the length of PAE increasing and the degree of phase separation decreasing at the same time also leading to lower hydrogen bonding interactions. Meanwhile, with the increment of the PEG-g length, the hydrogen bonding was weakened and the extent of phase separation decreased, resulting in the tensile strength decreasing and the elongation at break increasing.
We further discussed the structure–morphological–property relations of CWPU by using simulations based on a realistic model. The static structure and dynamic properties were analyzed. It was found that the flexibility of the chain increased (e.g. MSD, chain end-to-end distance and radius of gyration) with increasing PEG-g, which led to the number of hydrogen bonds as well as Tg decreasing. The scaling exponents for the radius of gyration and the chain end-to-end distance also illustrated that increasing the DP could result in a more flexible polymer chain. Besides, all the samples had a helical conformation, which meant that the polymer chain had large flexibility. All of these simulation results intuitively reveal the microcosmic conformation of the molecular chain, and in further detail elucidated the effect of introducing PAE on the polymer properties.
Acknowledgements
We would like to acknowledge Dr Cheng Bian for his assistance on technical details of the molecular dynamics simulation. This research was supported by HPC Platform, Xi'an Jiaotong University.References
- M. Furukawa, Y. Hamada and K. Kojio, J. Polym. Sci., Part B: Polym. Phys., 2003, 41, 2355–2364 CrossRef CAS.
- A. K. Nanda and D. A. Wicks, Polymer, 2006, 47, 1805–1811 CrossRef CAS.
- A. K. Nanda, D. A. Wicks, S. A. M. And and J. U. Otaigbe, Macromolecules, 2006, 39, 7037–7043 CrossRef CAS.
- K.-L. Noble, Prog. Org. Coat., 1997, 32, 131–136 CrossRef CAS.
- M. S. Yen, P. Y. Tsai and P. D. Hong, Colloids Surf., A, 2006, 279, 1–9 CrossRef CAS.
- P. Król, Prog. Mater. Sci., 2007, 52, 915–1015 CrossRef.
- A. V. Raghu, G. S. Gadaginamath, S. S. Jawalkar, S. B. Halligudi and T. M. Aminabhavi, J. Polym. Sci., Part A: Polym. Chem., 2006, 44, 6032–6046 CrossRef CAS.
- J. Repáková, P. Capková, M. Studenovský and M. Ilavský, J. Mol. Model., 2004, 10, 240–249 CrossRef PubMed.
- H. J. Dong, E. Y. Kim, Y. S. Kang and B. K. Kim, Colloids Surf., A, 2010, 370, 58–63 CrossRef.
- S. J. Peng, Y. Jin, X. F. Cheng, T. B. Sun, R. Qi and B. Z. Fan, Prog. Org. Coat., 2015, 86, 1–10 CrossRef CAS.
- L. Hou, Y. Ding, Z. Zhang, Z. Sun and Z. Shan, Colloids Surf., A, 2015, 467, 46–56 CrossRef CAS.
- K. Burja, U. Šegedin, S. Skale, P. Berce, P. Šket, P. Prosen and D. Kukanja, Prog. Org. Coat., 2015, 78, 275–286 CrossRef CAS.
- S. J. Peng, Y. Jin, T. Sun, R. Qi, B. Z. Fan and X. F. Cheng, J. Appl. Polym. Sci., 2014, 131, 40420 Search PubMed.
- M. Zhang, S. T. Hemp, M. Zhang, M. H. Allen, R. N. Carmean, R. B. Moore and T. E. Long, Polym. Chem., 2014, 5, 3795–3803 RSC.
- D. Shaw, Introduction to Colloid and Surface Chemistry, Butterworths, 4th edn, 1970 Search PubMed.
- P. A. Lovell and M. S. El-Aasser, Emulsion polymerization and emulsion polymers, J. Wiley, 1997 Search PubMed.
- I. D. F. A. Mariz, J. C. D. L. Cal and J. R. Leiza, Polymer, 2010, 51, 4044–4052 CrossRef CAS.
- R. Greenwood, P. F. Luckham and T. Gregory, Colloids Surf., A, 1998, 144, 139–147 CrossRef CAS.
- J. Meuldijk, Polym. React. Eng., 1998, 6, 243–268 CrossRef.
- I. D. F. A. Mariz, J. R. Leiza and J. C. D. L. Cal, Chem. Eng. J., 2011, 168, 938–946 CrossRef CAS.
- R. Greenwood, P. F. Luckham and T. Gregory, J. Colloid Interface Sci., 1997, 191, 11–21 CrossRef CAS PubMed.
- D. Dieterich, Prog. Org. Coat., 1981, 9, 281–340 CrossRef CAS.
- S. K. Lee and B. K. Kim, J. Colloid Interface Sci., 2009, 336, 208–214 CrossRef CAS PubMed.
- Y. Chen and Y. L. Chen, J. Appl. Polym. Sci., 1992, 46, 435–443 CrossRef CAS.
- B. K. Kim and Y. M. Lee, J. Appl. Polym. Sci., 1994, 54, 1809–1815 CrossRef CAS.
- B. K. Kim, J. S. Yang, S. M. Yoo and J. S. Lee, Colloid Polym. Sci., 2003, 281, 461–468 CAS.
- M. Rahmati, H. Modarress and R. Gooya, Polymer, 2012, 53, 1939–1950 CrossRef CAS.
- D. Zhou and P. Choi, Polymer, 2012, 53, 3253–3260 CrossRef CAS.
- E. Yılgör, İ. Yılgör and E. Yurtsever, Polymer, 2002, 43, 6551–6559 CrossRef.
- E. Yildirim, M. Yurtsever, G. L. Wilkes and I. Yilgör, Polymer, 2016, 90, 204–214 CrossRef CAS.
- S. Sami, E. Yildirim, M. Yurtsever, E. Yurtsever, E. Yilgor, I. Yilgor and G. L. Wilkes, Polymer, 2014, 55, 4563–4576 CrossRef CAS.
- S. Plimpton, J. Comput. Phys., 1995, 117, 1–19 CrossRef CAS.
- W. Humphrey, A. Dalke and K. Schulten, J. Mol. Graphics, 1996, 14, 33–38 CrossRef CAS PubMed.
- S. L. Mayo, B. D. Olafson and W. A. Goddard, J. Phys. Chem., 1990, 94, 8897–8909 CrossRef CAS.
- L. Verlet, Phys. Rev., 1967, 159, 98 CrossRef CAS.
- L. Verlet, Phys. Rev., 1968, 165, 201 CrossRef.
- J. Eastwood, R. Hockney and D. Lawrence, Comput. Phys. Commun., 1980, 19, 215–261 CrossRef CAS.
- H. J. Berendsen, J. V. Postma, W. F. van Gunsteren, A. DiNola and J. Haak, J. Chem. Phys., 1984, 81, 3684–3690 CrossRef CAS.
- M. J. Frisch, G. W. Trucks, H. B. Schlegel, G. E. Scuseria, M. A. Robb, J. R. Cheeseman, G. Scalmani, V. Barone, B. Mennucci, G. A. Petersson, H. Nakatsuji, M. Caricato, X. Li, H. P. Hratchian, A. F. Izmaylov, J. Bloino, G. Zheng, J. L. Sonnenberg, M. Hada, M. Ehara, K. Toyota, R. Fukuda, J. Hasegawa, M. Ishida, T. Nakajima, Y. Honda, O. Kitao, H. Nakai, T. Vreven, J. A. Montgomery Jr, J. E. Peralta, F. Ogliaro, M. J. Bearpark, J. Heyd, E. N. Brothers, K. N. Kudin, V. N. Staroverov, R. Kobayashi, J. Normand, K. Raghavachari, A. P. Rendell, J. C. Burant, S. S. Iyengar, J. Tomasi, M. Cossi, N. Rega, N. J. Millam, M. Klene, J. E. Knox, J. B. Cross, V. Bakken, C. Adamo, J. Jaramillo, R. Gomperts, R. E. Stratmann, O. Yazyev, A. J. Austin, R. Cammi, C. Pomelli, J. W. Ochterski, R. L. Martin, K. Morokuma, V. G. Zakrzewski, G. A. Voth, P. Salvador, J. J. Dannenberg, S. Dapprich, A. D. Daniels, Ö. Farkas, J. B. Foresman, J. V. Ortiz, J. Cioslowski and D. J. Fox, Gaussian 09, Revision A.02., Gaussian Inc., Wallingford, CT, 2009 Search PubMed.
- A. D. Becke, Phys. Rev. A, 1988, 38, 3098–3100 CrossRef CAS.
- C. Lee, W. Yang and R. G. Parr, Phys. Rev. B: Condens. Matter Mater. Phys., 1988, 37, 785–789 CrossRef CAS.
- P. Stephens, F. Devlin, C. Chabalowski and M. J. Frisch, J. Phys. Chem., 1994, 98, 11623–11627 CrossRef CAS.
- S. Grimme, J. Antony, S. Ehrlich and H. Krieg, J. Chem. Phys., 2010, 132, 154104 CrossRef PubMed.
- K. Dong, Y. Cao, Q. Yang, S. Zhang, H. Xing and Q. Ren, Ind. Eng. Chem. Res., 2012, 51, 5299–5308 CrossRef CAS.
- L. Liu, X. Wu and T. Li, J. Power Sources, 2014, 249, 397–404 CrossRef CAS.
- L. F. Wang, Q. Ji, T. E. Glass, T. C. Ward, J. E. Mcgrath, M. Muggli, G. Burns and U. Sorathia, Polymer, 2000, 41, 5083–5093 CrossRef CAS.
- H. Oh and P. F. Green, Nat. Mater., 2009, 8, 139–143 CrossRef CAS PubMed.
- F. Khabaz and R. Khare, J. Phys. Chem. B, 2015, 119, 14261–14269 CrossRef CAS PubMed.
- D. Qi, J. Hinkley and G. He, Modell. Simul. Mater. Sci. Eng., 2005, 13, 421–433 Search PubMed.
- F. Pan, J. Ma, L. Cui and Z. Jiang, Chem. Eng. Sci., 2009, 64, 5192–5197 CrossRef CAS.
- A. Shrake and J. Rupley, J. Mol. Biol., 1973, 79, 351–371 CrossRef CAS PubMed.
- E. Yildirim and M. Yurtsever, Comput. Theor. Chem., 2014, 1035, 28–38 CrossRef CAS.
- C. Wu and W. Xu, Polymer, 2007, 48, 5802–5812 CrossRef CAS.
- T. Steiner, Angew. Chem., Int. Ed., 2002, 41, 48–76 CrossRef CAS.
- C. Bian, S. Wang, Y. Liu, K. Su and X. Jing, Ind. Eng. Chem. Res., 2016, 55, 9440–9451 CrossRef CAS.
- J. Zheng, L. Li, H. K. Tsao, Y. J. Sheng, S. Chen and S. Jiang, Biophys. J., 2005, 89, 158–166 CrossRef CAS PubMed.
- P. Bačová, A. N. Rissanou and V. Harmandaris, Macromolecules, 2015, 48, 1577–1586 CrossRef.
- K. Kamio, K. Moorthi and D. N. Theodorou, Macromolecules, 2007, 40, 710–722 CrossRef CAS.
| This journal is © The Royal Society of Chemistry 2017 |

