DOI:
10.1039/C6RA28636D
(Paper)
RSC Adv., 2017,
7, 24576-24588
Investigation of the corrosion inhibition of carbon steel in hydrochloric acid solution by using ginger roots extract
Received
23rd December 2016
, Accepted 20th April 2017
First published on 5th May 2017
Abstract
The inhibitive effect and adsorption behavior of ginger roots extract (GRE) on the corrosion of carbon steel in 1.0 M HCl solution at different temperatures were investigated. The methods used were electrochemical studies (potentiodynamic polarization, electrochemical impedance spectroscopy, and electrochemical frequency modulation), chemical methods (weight loss measurements), surface analysis (atomic force microscopy [AFM]), and solution analysis (UV-visible spectrophotometric methods, such as Fourier transform infrared [FT-IR]). The analysis of the results showed that the inhibition efficiency increased with increasing the concentration of the inhibitor and decreased with temperature. The corrosion rate of carbon steel decreased in the presence of GRE. The corrosion inhibition efficiency increased with GRE concentration to attain 94% efficiency with 200 ppm at 25 °C. The thermodynamic activation parameters that govern the process were deduced from the temperature dependence. Potentiodynamic polarization curves indicated that the extract behaves as a mixed-type inhibitor. The extract was adsorbed on the carbon steel surface following the Langmuir adsorption isotherm. The adsorption free energy of GRE on carbon steel revealed a physical adsorption of GRE on the metal surface. The results from atomic force microscopy, Fourier transform infrared and UV-visible spectrophotometry analyses support the above inferences.
1. Introduction
The study of carbon steel corrosion and its inhibition in hydrochloric acid is very important in the field of engineering and in industries involving electrochemical process.1 As an example, the refining of crude oil results in a variety of corrosive conditions. Refinery corrosion is generally caused by a strong acid attacking the equipment surface. The other important fields of application are acid pickling, industrial cleaning, acid descaling, oil-well acid in oil recovery, and petrochemical processes. Among the acid solutions, hydrochloric acid is one of the most widely used agents. Acid corrosion inhibitors are organic compounds containing oxygen and sulfur, and nitrogen atoms containing multiple bonds in their molecules through which they can adsorb on the metal surface. The use of inhibitors is one of the best methods of preventing metals against corrosion, especially in acidic media.2–7 Inhibition of these organic compounds is attributed to the interactions between the carbon steel surface and the inhibitor molecules via their adsorption. Efforts are now being directed toward the development of safe inhibitor, and in this regard plant extracts have become important as eco-friendly, readily available, economical, renewable sources of effective corrosion inhibitors.8–14
This study aimed to investigate the inhibitory effect of ginger roots extract (GRE) as a corrosion inhibitor for carbon steel in 1.0 M HCl. We used electrochemical and weight loss methods, and surface and solution studies. Adsorption isotherms and thermodynamic parameters were also calculated and are discussed herein.
2. Materials and methods
2.1 Materials
The chemical composition of the used carbon steel (weight%) was 0.08 Cr, 0.11 Mo, 0.22 W, 0.40 Mn, 0.06 Cu, and the rest Fe. First, the samples were mechanically cut and prepared into five strips, each of dimensions, 20 × 20 × 1 mm. The exposed area of the electrode was abraded using different grades of emery papers (grades 320–1200), polished with Al2O3 (1 μm and then 0.3 μm particle sizes), washed with tap water followed by distilled water, degreased with acetone, dried, and finally stored in a desiccator. The corrosive medium (1.0 M HCl) was prepared from a stock 5.0 M HCl solution by dilution with bi-distilled water from a concentrated acid solution (37%, Merck). The concentration of the stock acid solution was checked through a standard solution of Na2CO3.
2.2 Chemical composition of ginger roots extract
Ginger has been extensively studied and its chemical composition is well known. Using methanol for the solvent extraction, the main constituents were found to be gingerol, zingiberene, α-farnesene, β-bisabolene, shogaol, and β-sesquiphellandrene.15
2.3 Preparation of ginger roots extract
The GRE was obtained directly from the powder of the dried roots. The GRE was soaked in methanol and left standing for 7 days. The solution was filtered, and distilled at 40 °C to remove the methanol from the extracts, then concentrated to dryness. Then, 1 g was taken from the extract and dissolved in 1000 mL of water to give a concentration of 1000 ppm. The corrosive medium was 1 M HCl solution. Different volumes from the stock solution of GRE (1000 ppm) were taken to prepare different concentrations by extraction with 1.0 M HCl.
2.4 Weight loss method
The corrosion rates of carbon steel were calculated by considering the total affected sample area and immersion time. The test samples were weighed and immersed in 50 mL of 1.0 M HCl in the absence and presence of varying concentrations of GRE (50–200 ppm), taken in a beaker at temperatures of 25–55 °C, with the temperature maintained in a thermostat water bath. The carbon steel strips were weighed and suspended in the beaker with the help of hooks. Each piece was taken out of the test solution, rinsed, and dried according to the standard method.16 The difference in weight for an exposed period of 30–150 min was taken as the total weight loss. In order to get good results, the experiments were carried out in triplicate. From the average weight loss results, the corrosion rate, the percentage of inhibition efficiency (%IE), and the degree of surface coverage (θ) were calculated using the following equations:17| | |
Corrosion rate = ΔW/At
| (1) |
| | |
(%IE) = θ × 100 = [(W1 − W2)/W1] × 100
| (2) |
where ΔW is the weight loss in mg, A is the area of the specimen in cm2, t is the exposure time in min, and W2 and W1 are the weight losses for the carbon steel sample in the presence and absence of the inhibitor.
2.5 Electrochemical measurements
All the electrochemical measurements were carried out using a conventional cell with three electrodes. The carbon steel was used as a working electrode, the counter electrode was a Pt wire electrode, and the reference electrode was a saturated calomel electrode (SCE). As mentioned before, the working electrode was first polished and cleaned.
The electrochemical measurements were performed using Gamry Instrument (PCI300/4) Potentiostat/Galvanostat/ZRA. This includes a Gamry framework system based on the ESA 400. Gamry applications included DC105 software for the potentiodynamic polarization measurements, EIS300 software for the electrochemical impedance spectroscopy, and EFM 140 software for the electrochemical frequency modulation measurements along with a computer for collecting data. Echem Analyst 6.03 software was used for plotting, graphically displaying, and fitting the data. Tafel polarization plots were obtained using a scan rate of 1 mV s−1 in the potential range from −700 to +700 mV with respect to the open circuit potential (Eocp). Electrochemical impedance spectroscopy was studied at corrosion potentials, Ecorr, over a frequency range of 105 Hz to 0.2 Hz with a signal amplitude perturbation of 5 mV.
The electrochemical frequency modulation technique was performed by applying a potential perturbation signal with an amplitude of 10 mV with two sine waves of 2 and 5 Hz. The choice for the frequencies of 2 and 5 Hz was based on three arguments.18
2.6 FT-IR analysis
FT-IR analysis was carried out to determine the functional groups present in the GRE solution (200 ppm extract + 1.0 M HCl) before and after immersion of the carbon steel for 24 h. FT-IR analysis was carried out using the FT/IR-4100 type A, Serial Number B117761016.
2.7 UV-visible spectroscopy
The UV-visible absorption spectra of 1.0 M HCl solution containing 200 ppm of GRE before and after immersion of the carbon steel for 24 h were studied.
2.8 AFM analysis
Atomic force microscopy (AFM) analysis is one of the major analysis methods to study a surface, and was used here for the further investigation of the formation of a protective film on the surface of the carbon steel. AFM was used to investigate the topography image of the carbon steel surface in the absence and presence of 200 ppm of GRE before and after immersing the carbon steel in for 24 h (Table 1).
Table 1 Names, structural formulas, and molecular weights for of the investigated extract
| Comp. |
Chemical structure |
Name |
Molecular weight |
%Composition |
| 1 |
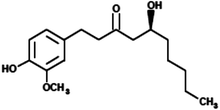 |
(5S)-5-Hydroxy-1-(4-hydroxy-3-methoxyphenyl)decan-3-one (Gingerol) |
294.39 |
25 |
| 2 |
 |
(5R)-5-[(1R)-1,5-Dimethylhex-4-en-1-yl]cyclohexa-1,3-diene (Zingiberene) |
204.357 |
9 |
| 3 |
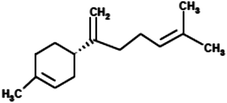 |
(4S)-1-Methyl-4-(5-methyl-1-methylenehex-4-en-1-yl)cyclohexene (β-Bisabolene) |
204.357 |
4 |
| 4 |
 |
(3E,6E)-3,7,11-trimethyldodeca-1,3,6,10-tetraene (α-Farnesene) |
204.357 |
11 |
| 5 |
 |
(4E)-1-(4-Hydroxy-3-methoxyphenyl)dec-4-en-3-one (Shogaol) |
276.376 |
18 |
| 6 |
 |
(3R)-3-[(1S)-1,5-Dimethylhex-4-en-1-yl]-6-methylenecyclohexene (β-Sesquiphellandrene) |
204.357 |
9 |
3. Results and discussion
3.1 Weight loss measurements
The values of the corrosion rate were plotted against different concentrations of the extract in 1.0 M HCl, and the results are shown in Fig. 1. The corrosion rate of carbon steel decreased when the concentration of the extract was increased, while the magnitude of surface coverage and adsorption by the extracts on carbon steel surface increased with the concentration of the extract. From Fig. 2, it can be seen that the inhibition efficiency increases with increasing the concentration of the extract. Tables 2 and 3 show the experimental data for the weight loss (ΔW), percentage of inhibition efficiency (%IE), corrosion rate (C.R.), and the degree of surface coverage (θ) for carbon steel in 1.0 M HCl in the absence and presence of various concentrations of GRE at different temperatures.
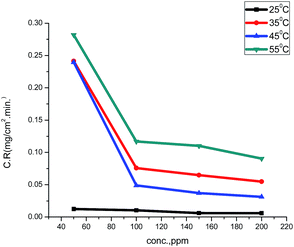 |
| | Fig. 1 Corrosion rates of various concentrations of ginger roots extract on carbon steel in 1.0 M HCl at 25–55 °C | |
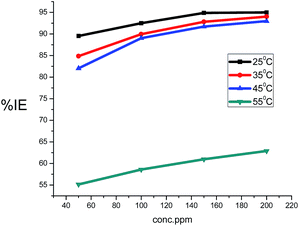 |
| | Fig. 2 Variation of the inhibition efficiency with the ginger roots extracts concentration of carbon steel in 1.0 M HCl solution. | |
Table 2 Data from weight loss of carbon steel in 1.0 M HCl for various concentrations of ginger roots extracts after 90 min, at 25 °C and 35 °C
| Conc., ppm |
25 °C |
35 °C |
| ΔW, mg cm−2 |
θ |
%IE |
C.R., mg cm−2 min−1 |
ΔW, mg cm−2 |
θ |
%IE |
C.R., mg cm−2 min−1 |
| Blank |
10.65 |
|
|
0.1180 |
22.265 |
|
|
0.2474 |
| 50 |
1.11 |
0.895 |
89.5 |
0.0120 |
00.037 |
0.848 |
84.8 |
0.0375 |
| 100 |
0.80 |
0.925 |
92.5 |
0.0088 |
00.076 |
0.899 |
89.9 |
0.0758 |
| 150 |
0.55 |
0.948 |
94.8 |
0.0060 |
00.065 |
0.928 |
92.8 |
0.0648 |
| 200 |
0.53 |
0.949 |
94.9 |
0.0059 |
00.055 |
0.940 |
94.0 |
0.0549 |
Table 3 Data of the weight loss of carbon steel in 1 M HCl for various concentrations of ginger roots extract after 90 min at 45 °C and 55 °C
| Conc., ppm |
45 °C |
55 °C |
| ΔW, mg cm−2 |
θ |
%IE |
C.R., mg cm−2 min−1 |
ΔW, mg cm−2 |
θ |
%IE |
C.R., mg cm−2 min−1 |
| Blank |
40.02 |
|
|
1.3340 |
56.56 |
|
|
0.6285 |
| 50 |
7.19 |
0.820 |
82.0 |
0.2397 |
25.37 |
0.551 |
55.1 |
0.2819 |
| 100 |
4.39 |
0.890 |
89.0 |
0.0488 |
10.51 |
0.586 |
58.6 |
0.1168 |
| 150 |
3.32 |
0.917 |
91.7 |
0.0369 |
9.90 |
0.610 |
61.0 |
0.1100 |
| 200 |
2.81 |
0.930 |
93.0 |
0.0312 |
20.99 |
0.6288 |
62.8 |
0.2332 |
3.2 Adsorption isotherms
Adsorption isotherm values are vital to explain the mechanism of corrosion inhibition of organo-electrochemical reactions. The adsorption mode is dependent on several factors, such as the type of metal and the nature of its surface, the structure molecules of the extract, the nature of the corrosion medium, the temperature, and the electrochemical potential of the metal–solution interface. The degree of surface coverage (θ) of the extract must be calculated to obtain the adsorption isotherm. A number of mathematical expressions have thus been developed to take into consideration the non-ideal effects.19–22 The most frequently used isotherm is the Langmuir isotherm. In Fig. 3, according to the Langmuir isotherm, the degree of surface coverage (θ) evaluated from the weight loss method was related to the inhibitor concentration as:23| | |
Cinh./θ = 1/Kads + Cinh.
| (3) |
where Cinh. is the inhibitor concentration, θ is the fraction of the surface coverage, and Kads is the adsorption equilibrium constant. From the intercepts and slopes of the straight lines of the Langmuir isotherm curves, the values of the equilibrium constant (Kads) were calculated, and the results are given in Table 4. From the obtained data, it can be seen that the values of Kads decrease with increasing temperature. This demonstrates that the strength of adsorption decreases with the increasing temperature and the inhibitor species are then more readily removed from the carbon steel surface.24–26 Kads can be related to the free energy of adsorption (ΔGads) by the following equation:| |
Kads = 1/55.5![[thin space (1/6-em)]](https://www.rsc.org/images/entities/char_2009.gif) exp[−ΔG°ads]/RT exp[−ΔG°ads]/RT
| (4) |
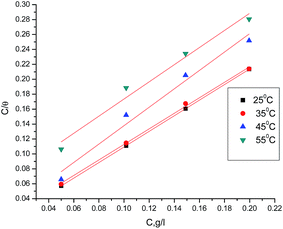 |
| | Fig. 3 Langmuir isotherm for GRE adsorption on carbon steel in 1 M HCl at different temperatures. | |
Table 4 Langmuir adsorption parameters for the adsorption of GRE on the carbon steel surface in 1.0 M HCl
| Temp. |
Langmuir |
log![[thin space (1/6-em)]](https://www.rsc.org/images/entities/char_2009.gif) K K |
Slope |
R2 |
−ΔG°ads Kj |
−ΔH°ads Kj |
−ΔS°ads jK−1 |
| 25 °C |
2.33 |
1.034 |
0.99998 |
12.05 |
53.42 |
57.51 |
| 35 °C |
2.07 |
1.029 |
0.99763 |
12.15 |
| 45 °C |
1.83 |
1.022 |
0.96635 |
12.22 |
| 55 °C |
1.43 |
1.020 |
0.98579 |
11.93 |
The thermodynamic parameters for adsorption of the investigated GRE on the carbon steel surface at various temperatures were recorded and are listed in Table 4. From the data in Table 4, it was found that the negative data for ΔG°ads reflect that the adsorption of the studied extract on carbon steel in 1.0 M HCl solution was a spontaneous process.27 The obtained values of ΔG°ads (11.93–12.22 kJ) suggest that the adsorption of the GRE on the carbon steel surface is mainly through physical adsorption. The thermodynamic adsorption parameters, such as the enthalpy of adsorption ΔH°ads and the entropy of adsorption ΔS°ads, can be deduced from the integrated version of the van't Hoff equation as expressed by28
| |
ln![[thin space (1/6-em)]](https://www.rsc.org/images/entities/char_2009.gif) Kads = (−ΔH°ads/RT) + (ΔS°ads/R) + ln(1/55.5) Kads = (−ΔH°ads/RT) + (ΔS°ads/R) + ln(1/55.5)
| (5) |
The negative sign of ΔH°ads indicates that the adsorption of GRE on carbon steel surface is an exothermic process. The negative ΔS°ads values are accompanied with an exothermic adsorption process. This agrees with the expected result, whereby, when the adsorption is an exothermic process, it must be accompanied by a decrease in the entropy change and vice versa (Fig. 4).29
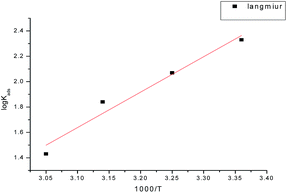 |
| | Fig. 4 Log![[thin space (1/6-em)]](https://www.rsc.org/images/entities/char_2009.gif) Kads vs. (1/T) curves for the corrosion of carbon steel in 1 M HCl in the absence and presence of different concentrations of GRE. Kads vs. (1/T) curves for the corrosion of carbon steel in 1 M HCl in the absence and presence of different concentrations of GRE. | |
3.3 Effect of temperature on the inhibition efficiency
From Tables 2 and 3, it can be seen that the data show that the inhibition efficiency decreases with a rise in temperature. This suggests that the GRE is adsorbed on the carbon steel surface physically. Also the data in Tables 2 and 3 reveal that the weight loss of carbon steel increases with increasing the temperature, indicating that the rate of corrosion of metal increases with increasing the temperature. The dependence of the rate of corrosion (C.R.) on the temperature can be expressed by the Arrhenius equation:| |
C.R. = A![[thin space (1/6-em)]](https://www.rsc.org/images/entities/char_2009.gif) exp(−E*a/RT) exp(−E*a/RT)
| (6) |
where A is a pre-exponential factor and E*a is the apparent activation energy for the corrosion process. The Arrhenius plots in Fig. 5 show the corrosion of carbon steel in 1.0 M HCl solution with and without different concentrations of GRE. The linear regression (R2) is close to 1, which indicates that the corrosion of carbon steel in 1.0 M acidic medium can be determined by using the kinetics model. Table 5 gives the data for E*a, which indicates that E*a increases in the presence of GRE more than in its absence. Hence, from these data we can say that the molecules of GRE are adsorbed on the carbon steel surface physically. The entropy and enthalpy of activation (ΔH* and ΔS*) of the corrosion process were calculated from the transition state theory, as given from the following equation:| | |
C.R. = (RT/Nh)exp(ΔS*/R)exp(−ΔH*/RT)
| (7) |
where h is Planck's constant and N is Avogadro's number. A plot of log(C.R./T) vs. 1/T for carbon steel with different concentrations of GRE gave straight lines, as shown in Fig. 6. Here, the values of ΔH* were negative. This means that the activation process is an exothermic corrosion process. The values of ΔS* were also negative, but with an increase in the GRE concentration, ΔS* becomes less and less negative. This indicates that the activated complex is less ordered in the presence of GRE. Table 5 reports the parameters (ΔH* and ΔS*) for the activation of carbon steel corrosion without and with various concentrations of GRE.
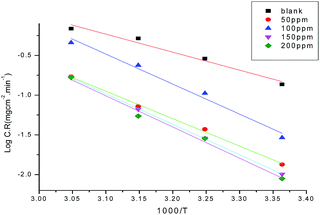 |
| | Fig. 5 Arrhenius plots (log![[thin space (1/6-em)]](https://www.rsc.org/images/entities/char_2009.gif) C.R. vs. 1/T) for carbon steel in 1.0 M HCl without and with different concentrations of GRE. C.R. vs. 1/T) for carbon steel in 1.0 M HCl without and with different concentrations of GRE. | |
Table 5 Kinetics parameters for the Arrhenius equation and transition state equation
| Conc. ppm |
E*a kJ mol−1 |
−ΔH* kJ mol−1 |
−ΔS* J mol−1 K−1 |
| Blank |
51.08 |
41.17 |
122.2 |
| 50 |
66.11 |
63.89 |
65.87 |
| 100 |
72.39 |
70.27 |
36.86 |
| 150 |
74.00 |
71.22 |
43.32 |
| 200 |
75.18 |
72.95 |
39.10 |
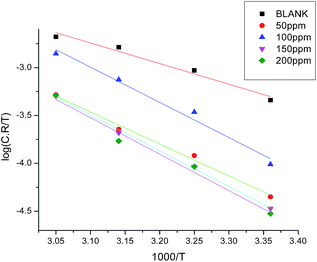 |
| | Fig. 6 Plots of log![[thin space (1/6-em)]](https://www.rsc.org/images/entities/char_2009.gif) C.R./T vs. 1000/T for carbon steel in 1.0 M HCl without and with different concentrations of GRE. C.R./T vs. 1000/T for carbon steel in 1.0 M HCl without and with different concentrations of GRE. | |
3.4 Open circuit potential measurements
The variation of the open circuit potential (OCP) of carbon steel electrodes as a function of time was measured against a saturated calomel electrode (SCE) in the absence and presence of various concentrations of the GRE, as indicated in Fig. 7. It is evident from the figure that the corrosion potential (Ecorr) of the carbon steel electrode in 1.0 M HCl solution trends first toward more negative values, giving rise to a short step. In the presence of (GRE) solutions, the open circuit potential values shifted towards more positive potentials during the immersion. This can be explained by the adsorption of (GRE) on the carbon steel surface. After that, the values tended to stabilize, demonstrating that the adsorption and desorption of (GRE) molecules had reached a dynamic balance.30,31 This suggests that the kinetics of the anodic reaction of carbon steel in 1.0 M HCl solution was affected more strongly in the presence of the GRE.
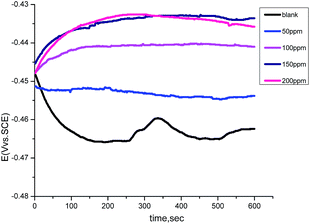 |
| | Fig. 7 Potential–time curves for carbon steel in 1.0 M HCl solution in the absence and presence of different concentrations of GRE at 25 °C | |
3.5 Potentiodynamic polarization
A Tafel plot is a technique for determining the corrosion rate from the experimental polarization curves. The electrochemical parameters, anodic Tafel constant (βa), cathodic Tafel constant (βc), corrosion potential (Ecorr), corrosion current density (icorr), and the corresponding inhibition efficiencies for the corrosion of carbon steel in 1.0 M HCl solution without and with different concentrations (50–200 ppm) of GRE at 25 °C are illustrated in Table 6. Fig. 8 shows the anodic and cathodic potentiodynamic polarization curves for the previous tests. The Tafel lines can be seen to be shifted to more negative and more positive potentials with respect to the blank curve when increasing the concentration of the investigated extract. These observations indicate that the GRE is a mixed-type inhibitor for the corrosion of carbon steel in 1.0 M HCl.32,33 From Table 6 the values of Ecorr can be seen to be slightly shifted to more positive potentials when increasing the concentration of GRE. These results suggest that this extract acts as a mixed-type inhibitor that acts predominately on the anodic dissolution of the metal.34 These results demonstrate that an increase in extract concentration leads to a decrease in the corrosion current density (Icorr), as indicated in the potentiodynamic polarization curves, which can be explained by the adsorption of organic compounds, such as heteroatoms, at the carbon steel surface. The Tafel slopes (βa and βc) are approximately constant, indicating that the retardation of the two reactions (cathodic hydrogen reduction and anodic metal dissolution) were affected without changing the dissolution mechanism.35–37 The degree of surface coverage (θ) and the inhibition efficiency (η) were calculated using eqn (8):| | |
% η = θ × 100 = [1 − (I/I°)] × 100
| (8) |
where I° and I are the current densities in the absence and presence of the extract, respectively.
Table 6 Potentiodynamic polarization parameters for carbon steel corrosion in 1.0 M HCl in the absence and presence of different concentrations of GRE at 25 °C
| Conc., ppm |
−Ecorr, mV vs. SCE |
RP, ohm |
icorr, μA cm−2 |
βa, mV dec−1 |
−βc, mV dec−1 |
θ |
%IE |
mpy |
| Blank |
448 |
3.10 |
464.0 |
123.0 |
195.2 |
— |
— |
212.1 |
| 50 |
441 |
5.02 |
47.7 |
106.8 |
198.5 |
0.897 |
89.7 |
21.81 |
| 100 |
437 |
5.72 |
42.9 |
113.5 |
195.6 |
0.908 |
90.8 |
19.6 |
| 150 |
430 |
6.08 |
42.0 |
91.1 |
198.1 |
0.910 |
91.0 |
19.21 |
| 200 |
431 |
6.40 |
35.9 |
94.7 |
187.1 |
0.923 |
92.3 |
16.41 |
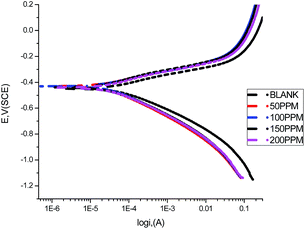 |
| | Fig. 8 Anodic and cathodic polarization curves for carbon steel in 1.0 M HCl in the absence and presence of different concentrations of GRE at 25 °C. | |
3.6 Electrochemical impedance spectroscopy
From the EIS technique, we can gain information on the resistive and capacitive behavior at the interface and this made it possible to evaluate the performance of the test compound as a corrosion inhibitor.38–40 The interface of the metal surface and aqueous electrolyte is a complex environment consisting of a line of positive and negatively charged ions. Also it can contains a coating or film formation on surfaces, capacitance due to an electrical double layer (Cdl), charge transfer resistance (Rct), solution resistance (Rs),and various impedances due to the diffusion of ions, the movement of charge in or away from the metal surface, and from the adsorption of cations and anions. Table 7 shows the data for the impedance of carbon steel in 1.0 M HCl without and with various concentrations of GRE. Impedance diagrams (Nyquist and Bode plots) obtained for carbon steel in the presence of various concentrations of GRE are depicted in Fig. 10 and 11. The diameter of the semicircle and hence charge transfer resistance Rct of the corrosion reaction increase with the increasing extract concentration.41,42 This was attributed to the high resistance shown by the adsorbed extract components at the metal–solution interface.43 The decrease in Cdl compared with that in the blank solution (without different concentrations of the extract). This results from a decrease in the local dielectric constant and/or an increase in the thickness of the electrical double layer. This happens when the extract molecules are adsorbed at the metal–solution interface.44 The obtained impedance diagrams have an almost semicircular appearance, indicating a charge transfer process, which mainly controls the corrosion of carbon steel.45 The EIS data were simulated using the equivalent circuit shown in Fig. 9. This circuit includes constant phase elements (CPEs) in place of capacitors to represent various types of non-homogeneities typical of corroding electrodes, such as surface roughness, insufficient polishing, grain boundaries, and surface impurities.46 The impedance of this element is frequency dependent, and can be mathematically expressed using two parameters: Yo and n, by:47where Yo is the magnitude of CPE, j2 = −1 is an imaginary number, and ω is the sine wave modulation angular frequency (ω = 2πf, where f is the ac frequency). In actual experimental conditions, the values of n are between 0 and 1 due to the influence of different factors, such as the electrode roughness, surface heterogeneity, and the dielectric constant.48 The double layer capacitance, Cdl, was calculated from eqn (10):49| | |
Cdl = Y0ωn−1/sin[n(π/2)]
| (10) |
Table 7 EIS parameters for the corrosion of carbon steel in 1.0 M HCl in the absence and presence of different concentrations of GRE at 25 °C
| Conc., ppm |
Rct, Ω cm−2 |
RS, Ω cm−2 |
Y0 × 106, ohm−1 Sn cm−2 |
n |
Cdl × 10−2, μF cm−2 |
θ |
%IE |
| Blank |
83.81 ± 0.527 |
1.189 ± 35.2 × 10⁻³ |
686.8 ± 6.87 |
0.859 ± 0.0049 |
2.840 |
— |
— |
| 50 |
730.8 ± 9.172 |
1.796 ± 16.1 × 10⁻³ |
306.2 ± 2.29 |
0.737 ± 0.002 |
1.794 |
0.885 |
88.5 |
| 100 |
737.1 ± 8.87 |
2.229 ± 18.92 × 10⁻³ |
268.0 ± 3.86 |
0.749 ± 0.002 |
1.560 |
0.886 |
88.6 |
| 150 |
761.1 ± 8.87 |
1.963 ± 17.44 × 10⁻³ |
242.0 ± 3.44 |
0.752.0 ± 0.002 |
1.390 |
0.890 |
89.0 |
| 200 |
891.50 ± 11.84 |
2.074 ± 17.78 × 10⁻³ |
290 ± 3.94 |
0.744 ± 0.002 |
1.820 |
0.906 |
90.6 |
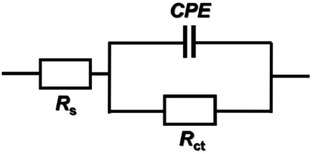 |
| | Fig. 9 Equivalent circuit proposed to fit the EIS experimental data. | |
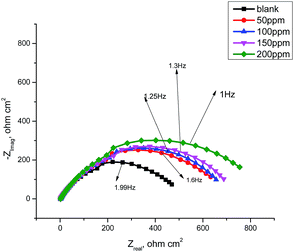 |
| | Fig. 10 Nyquist plots for the corrosion of carbon steel in 1.0 M HCl in the absence and presence of different concentrations of GRE at 25 °C. | |
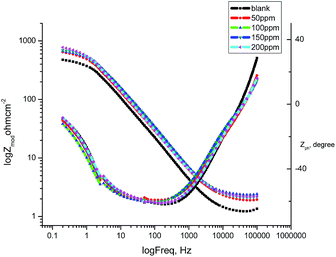 |
| | Fig. 11 Bode plots for the corrosion of carbon steel in 1 M HCl in the absence and presence of different concentrations of GRE at 25 °C. | |
The degree of surface coverage (θ) and the inhibition efficiency (% η) were calculated from the EIS data using eqn (11):
| | |
% η = θ × 100 = [1 − (R°p/Rp)] × 100
| (11) |
where
Rct and
Rs are the charge transfer resistances with and without the inhibitors, respectively.
θ and %
η are also listed in
Table 7.
3.7 Electrochemical frequency modulation measurements
The electrochemical frequency modulation (EFM) technique has many features, such as, it is a rapid test, directly gives values of the corrosion current without a prior knowledge of Tafel constants needed, and is a non-destructive technique.50 Like EIS, it is a small signal ac technique. Unlike EIS, however, two sine waves (at different frequencies) are applied to the cell simultaneously. Because the current is a non-linear function of potential excitation, the current response contains not only the input frequencies, but also contains frequency components, which are the sum, difference, and multiples of the two input frequencies. The two frequencies may not be chosen at random. They must both be small, integer multiples of a base frequency that determines the length of the experiment. Table 8 shows the corrosion kinetic parameters, such as inhibition efficiency, corrosion current density (μA cm−2), Tafel constants (βa, βc), and causality factors (CF-2, CF-3) at different concentrations of extract in 1.0 M HCl at 25 °C. The inhibition efficiency, % IE and the degree of surface coverage (θ) of GRE were calculated using eqn (12):| | |
% IE = θ × 100 = [1 − (icorr/i°corr)] × 100
| (12) |
where i°corr and icorr are the corrosion current density in the absence and presence of GRE. From this table, the corrosion current densities decreases and the inhibition efficiencies increase when increasing the concentration of the extract. The great strength of the EFM is the causality factor, which serves as an internal check on the validity of the EFM measurement.51 The values of causality factors given in Table 8 indicate that the measured data are of good quality. The standard values for CF-2 and CF-3 were 2.0 and 3.0, respectively. If the causality factors differ significantly from the theoretical values of 2.0 and 3.0, then it can be deduced that the measurements are influenced by noise. Whereas, if the causality factors are approximately equal to the predicted values of 2.0 and 3.0, it indicates that there is a causal relationship between the perturbation signal and the response signal. Then the data is assumed to be reliable.52 Fig. 12 shows the corresponding current response in the intermodulation spectrum.
Table 8 Electrochemical kinetic parameters obtained by EFM technique for metal in1 M HCl solutions with GRE at 25 °C
| Conc., ppm |
icorr, μA cm−2 |
βa, mV dec−1 |
−βc, mV dec−1 |
CF-2 |
CF-3 |
θ |
%IE |
mpy |
| Blank |
585.5 |
94.37 |
137.2 |
1.99 |
2.79 |
|
|
267.5 |
| 50 |
48.46 |
109.1 |
201.6 |
2.02 |
2.83 |
0.917 |
91.7 |
22.15 |
| 100 |
42.45 |
96.57 |
185 |
2.19 |
2.60 |
0.927 |
92.7 |
19.4 |
| 150 |
36.59 |
100 |
175.8 |
3.8 |
2.19 |
0.9375 |
93.75 |
16.72 |
| 200 |
36.26 |
89.04 |
160.2 |
1.78 |
2.40 |
0.938 |
93.8 |
16.57 |
 |
| | Fig. 12 Intermodulation spectra for steel in 1.0 M HCl in the absence and presence of various concentrations of GRE in 1.0 M HCl at 25 °C. | |
3.8 Atomic force microscopy
Atomic force microscopy (AFM) or scanning force microscopy (SFM) is a very high-resolution type of scanning probe microscopy, with demonstrated resolution in the order of fractions of a nanometer, more than 1000 times better than the optical diffraction limit.53,54 The morphology of the surface of carbon steel after immersion for 24 h in 1.0 M HCl solution without and with 200 ppm of GRE was examined in the light of an atomic force microscope. The three-dimensional (3D) AFM morphology and the AFM cross-sectional profile for polished carbon steel surface (reference sample), carbon steel surface immersed in 1.0 M HCl (blank sample), and the carbon steel surface immersed in 1.0 M HCl containing 200 ppm GRE are shown in Fig. 13–15. Table 9 is a summary of the Sq, Sa, and P–V values for the carbon steel surface immersed in different environments. Whereas, Sq is root-mean-square roughness (the average of the measured height deviations taken within the evaluation length and measured from the mean line), Sa is the average roughness (the average deviation of all points' roughness profile from a mean line over the evaluation length), and the P–V value is the maximum peak-to-valley height values (largest single peak-to-valley height in five adjoining sampling heights). Fig. 13 displays the surface topography of the un-corroded metal surface. The value of Sq, Sa, and the P–V height for the polished carbon steel surface (reference sample) are 24.792, 20.628, and 137.07 nm, respectively. The slight roughness observed on the polished carbon steel surface was due to atmospheric corrosion. Fig. 14 displays the corroded metal surface in the absence of the GRE immersed in 1.0 M HCl. The Sq, Sa, and P–V height values for the carbon steel surface are 590.07, 497.92, and 3932 nm, respectively. These data suggest that the carbon steel surface immersed in 1.0 M HCl has a greater surface roughness than the polished metal surface. Fig. 15 displays the steel surface after immersion in 1.0 M HCl containing 200 ppm of GRE. The Sq, Sa, and P–V height values for the carbon steel surface are 558.25, 430.5, and 3592.7 nm, respectively. The Sq, Sa, and P–V height values are considerably less in the inhibited environment compared to the uninhibited environment. These parameters confirm that the surface is smoother. The smoothness of the surface is due to the formation of a compact protective film of Fe2+–GRE complex on the metal surface; thereby, inhibiting the corrosion of carbon steel.55,56
Table 9 Morphology data of the surface of carbon steel after immersion for 24 h in 1.0 M HCl solution without and with 200 ppm of GRE was examined in the light of an atomic force microscope
| Samples |
Sq (nm) |
Sa (nm) |
Maximum peak-to-valley height (nm) |
| 1 – Polished carbon steel |
24.792 |
20.628 |
137.07 |
| 2 – Carbon steel immersed in 1 M HCl (blank) |
590.07 |
497.92 |
3932 |
| 3 – Carbon steel immersed in 1 M HCl + 200 ppm GRE |
558.25 |
430.52 |
3592.7 |
 |
| | Fig. 13 Surface of polished carbon steel electrode as viewed by atomic force microscopy. | |
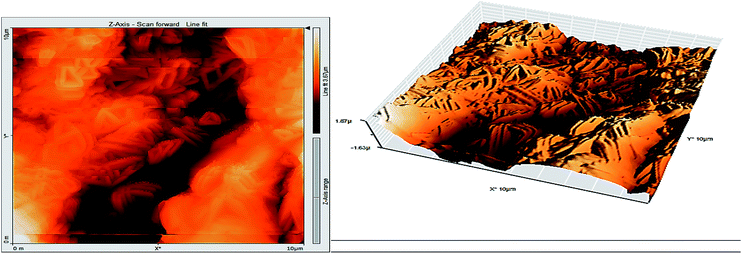 |
| | Fig. 14 Surface of steel electrode as viewed by atomic force microscopy after 24 h immersion in 1.0 M HCl. | |
 |
| | Fig. 15 Surface of steel electrode as viewed by atomic force microscopy after 24 h immersion in 1.0 M HCl and 200 ppm of GRE. | |
3.9 Analysis of the FT-IR spectra
To identify the functional groups present in GRE, we used FT-IR analysis. The FT-IR spectra of the extract and the corrosion products are presented in Fig. 16. The results obtained show that corrosion inhibition takes place through an adsorption process. The spectrum of the 200 ppm of GRE in 1.0 M HCl. Fig. 16 shows that broad peaks appeared at 3396, 1628, 1422 and 2296 cm−1, which correspond to the O–H, C![[double bond, length as m-dash]](https://www.rsc.org/images/entities/char_e001.gif) O, C
O, C![[double bond, length as m-dash]](https://www.rsc.org/images/entities/char_e001.gif) C and aliphatic C–H stretching vibration frequencies, respectively. Thus, GRE was characterized by IR spectroscopy.57 There was a shift in the spectra of the extract when carbon steel was immersed in it to form a corrosion product, as shown in Fig. 17. This shows that there is an interaction between the extract and the carbon steel substrate, which resulted in inhibition. The shifts in the spectra are considered to be a result of the interaction between the extracts and carbon steel through the functional groups presents in them. So, it can be affirmed that the functional group has coordinated with Fe2+ formed on the metal surface, resulting in the formation of an Fe2+ extract complex on the metal surface, which promotes the inhibition of the metal sample.
C and aliphatic C–H stretching vibration frequencies, respectively. Thus, GRE was characterized by IR spectroscopy.57 There was a shift in the spectra of the extract when carbon steel was immersed in it to form a corrosion product, as shown in Fig. 17. This shows that there is an interaction between the extract and the carbon steel substrate, which resulted in inhibition. The shifts in the spectra are considered to be a result of the interaction between the extracts and carbon steel through the functional groups presents in them. So, it can be affirmed that the functional group has coordinated with Fe2+ formed on the metal surface, resulting in the formation of an Fe2+ extract complex on the metal surface, which promotes the inhibition of the metal sample.
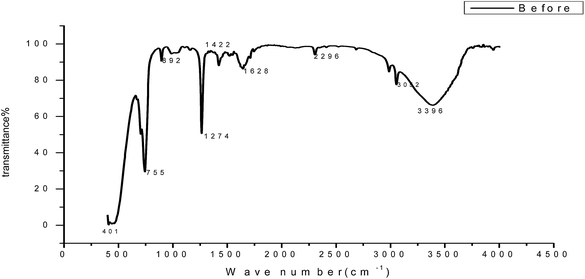 |
| | Fig. 16 FT-IR spectrum of GRE before adsorption on a carbon steel surface. | |
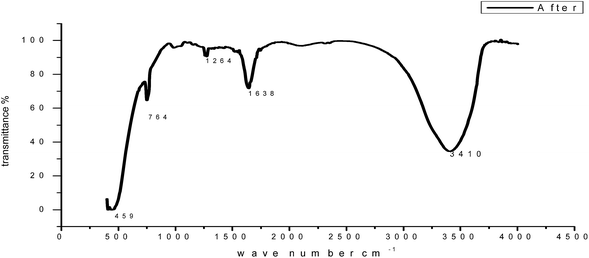 |
| | Fig. 17 FT-IR spectrum of GRE after adsorption on a carbon steel surface. | |
3.10 UV-visible analysis
Visible absorption spectra obtained from 1.0 M HCl solution containing 200 ppm GRE before and after the carbon steel immersion are shown in Fig. 18. The spectra confirmed the possibility of the formation of an inhibitor–Fe complex. The electronic absorption spectra of GRE before immersion have an absorption maximum at 215 nm, which can be attributed to π–π* and n-transitions. After 24 h immersion of the carbon steel, the change in the position of the absorption maximum or the change in the absorbance values indicates the complex formation between two species in solution. Furthermore, there is no change in the shape of the absorption spectra. These experimental findings provide evidence for the formation of a complex between Fe2+ and GRE and confirm the inhibition of steel from corrosion.58,59
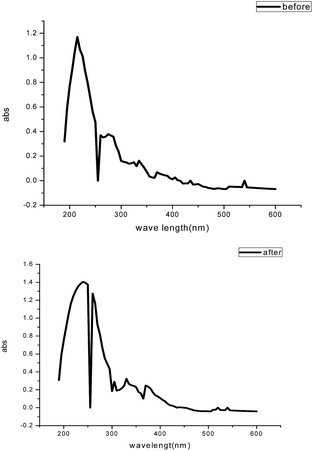 |
| | Fig. 18 UV-visible spectra of the solution from 1.0 M HCl containing 200 ppm GRE before and after 24 h of carbon steel immersion. | |
3.11 Mechanism of inhibition
For the corrosion of carbon steel in HCl solution, the anodic (metal dissolution) and cathodic (hydrogen evolution) half reactions are:60–63
The overall corrosion reaction equation is:
The dissolution of iron was demonstrated according to the following equations:64
| (FeCl−)ads → (FeCl)ads + e− |
The hydrogen production occurs via two successive steps: to begin with, the initial discharge of hydrogen ions to adsorbed monoatomic hydrogen:65
After that, the chemical or electrochemical recombination of monoatomic hydrogen to molecular hydrogen:
In HCl solution, transition of the metal–solution interface was attributed to the adsorption of the inhibitor molecules at the metal–solution interface, forming a protective film. The rate of adsorption is usually rapid, and the reactive metal surface is shielded from the HCl solution solutions.66 The adsorption of the extract components depends on the nature and charged surface of the metal, its chemical structure, its molecular structure, its molecular size, and the distribution of charge over the whole extract molecule. The adsorption process can occur through the replacement of solvent molecules from the metal surface by ions and from molecules accumulated near the metal–solution interface. Ions can accumulate at the metal–solution interface in excess of those required to balance the charge on the metal at the operating potential. The exact nature of the interaction between a metal surface and an aromatic molecule depends on the relative coordinating strength toward the given metal of the particular groups present.67 Generally, two modes of adsorption were considered. In one mode, the neutral component molecules of the GRE can be adsorbed on the surface of the carbon steel through the chemisorption mechanism, involving the displacement of water molecules from the carbon steel surface and the sharing of electrons between the heteroatoms and iron. The inhibitor molecules can also adsorb on the carbon steel surface based on donor–acceptor interactions between π-electrons of the aromatic/heterocyclic ring and the vacant d-orbitals of the surface iron. In the other mode, since it is well known that the steel surface bears the positive charge in acidic solutions,67 it is difficult for the protonated component molecules extract to approach the positively charged carbon steel surface (H3O–metal interface) because of electrostatic repulsion. Since chloride ions have a smaller degree of hydration, they could bring excess negative charges in the vicinity of the interface and favor more adsorption of the positively charged inhibitor molecules and the negatively charged metal surface.
4. Conclusions
The results obtained show that GRE is a good corrosion inhibitor for carbon steel under acidic conditions. An excellent agreement between the inhibition efficiencies calculated using different techniques was obtained. The data obtained from the wt. loss showed that the inhibiting action increased with the increase in extract concentration and decreased with higher temperature. The adsorption of the GRE onto the steel surface was characterized by a decrease in the cathodic and anodic current densities observed in the potentiodynamic polarization curves carried out in the presence of GRE. The adsorption behavior of the GRE is consistent with Langmuir adsorption isotherm. GRE was adsorbed on the carbon steel surface following a physisorption mechanism. The results of the polarization indicated that GRE is of a mixed type. A good agreement was obtained between all the investigated electrochemical techniques and the other techniques.
References
- M. Yadav, S. Kumar, R. R. Sinha, I. bahdur and E. E. Ebenso, J. Mol. Liq., 2015, 211, 135–145 CrossRef CAS
 .
. - M. Tourabi, K. Nohair, M. Traisnel, C. Jama and F. Bentiss, Corros. Sci., 2013, 75, 123–133 CrossRef CAS
 .
. - A. Kosari, M. Momeni, R. Parvizi, M. Zakeri, M. H. Moayed, A. Davoodi and H. Eshghi, Corros. Sci., 2011, 53, 3058–3067 CrossRef CAS
 .
. - H. Keles, Mater. Chem. Phys., 2011, 130, 1317–1324 CrossRef CAS
 .
. - A. O. Yuce, R. Solmaz and G. Kardas, Mater. Chem. Phys., 2012, 131, 615–620 CrossRef CAS
 .
. - M. Gopiraman, N. Selvakumaran, D. Kesavan and R. Karvembu, Prog. Org. Coat., 2012, 73, 104–111 CrossRef CAS
 .
. - D. K. Yadav, M. A. Quraishi and B. maiti, Corros. Sci., 2012, 55, 254–266 CrossRef CAS
 .
. - M. Librini, F. Robert, A. Lecante and C. Roos, Corros. Sci., 2011, 53, 687–695 CrossRef
 .
. - A. S. Fouda, S. Etaiw and W. Elnaggar, Int. J. Electrochem. Sci., 2014, 9, 4866–4883 CAS
 .
. - L. Li, X. Zhang, j. Lei, J. He, S. Zhang and F. Pan, Corros. Sci., 2012, 63, 82 CrossRef CAS
 .
. - N. Odewunmi, S. Umoren and Z. Gasem, J. Ind. Eng. Chem., 2015, 21, 239 CrossRef CAS
 .
. - M. Mageed, A. Sultan and H. Al- Sahlanee, J. Chem. Pharm. Res., 2013, 5, 1297 Search PubMed
 .
. - L. Atia, R. Salghi, L. Bammou, L. h. Bazzi, B. Hammouti and L. Bazzi, Acta Metall. Sin., 2012, 25, 10–18 Search PubMed
 .
. - C. Sells, O. Benali, B. Tabti, L. Larabi and Y. Harek, J. Mater. Environ. Sci., 2012, 3, 206–219 Search PubMed
 .
. - H. A. Hasan, A. M. Rasheed Raauf, B. M. Abd Razik and B. A. Rasool Hassan, Pharm. Anal. Acta, 2012, 3(9), 1000184–1100085 Search PubMed
 .
. - ASTM, AST G 31–72, Standard Recommended Practice for the Laboratory Immersion Corrosion Testing of Metals, American Society for Testing and Materials, Philadelphia, PA, USA, 1990 Search PubMed.
- E. Barsoukov and J. R. Macdonald, Impedance Spectroscopy, Theory, Experiment and Applications, Wiley Interscience publications, New York, 2nd edn, 2005 Search PubMed
 .
. - R. W. Bosch, J. Hubrecht, W. F. Bogaerts and B. C. Syrett, Corrosion, 2011, 57, 60–70 CrossRef
 .
. - Z. M. Hadi and J. Al-Sawaad, J. Mater. Environ. Sci., 2011, 2(2), 128–147 Search PubMed
 .
. - P. Roy, P. Karfa, U. Adhikari and D. Sukul, Corros. Sci., 2014, 88, 246–3253 CrossRef CAS
 .
. - A. Amin, K. F. Khaled, Q. Mohsen and A. Arida, Corros. Sci., 2010, 52, 1684–1695 CrossRef
 .
. - S. A. Umoren, O. Ogbobe, I. O. Igwe and E. E. Ebenso, Corros. Sci., 2008, 50, 1998–2006 CrossRef CAS
 .
. - M. N. El-Haddad, RSC Adv., 2016, 6, 57844–57853 RSC
 .
. - S. Keera and M. Deyab, Colloids Surf., A, 2005, 266, 129 CrossRef CAS
 .
. - A. M. Hassan and T. M. Hesham Abdel-Fatah, Int. J. Electrochem.
Sci., 2016, 11, 6959–6975 CAS
 .
. - S. Abd El Rehim, H. Hassan and M. Amin, Mater. Chem. Phys., 2002, 78, 337 CrossRef
 .
. - M. G. A. Khedr and M. S. Lashien, Corros. Sci., 1992, 33, 137–151 CrossRef CAS
 .
. - S. S. Abd El-Rehim, H. H. Hassan and M. A. Amin, Corros. Sci., 2004, 46, 5–25 CrossRef CAS
 .
. - J. R. Macdonald, Impedence Spectroscopy, Jhon Wiley & Sons, New York, 3rd edn, 1987 Search PubMed
 .
. - J. M. Abd El-Kader, A. A. El-Warraky and A. M. Abd El-Aziz, Br. Corros. J., 1998, 33(2), 139 CrossRef CAS
 .
. - M. A. Migahed, M. Abd-El-Raouf a, A. M. Al- Sabagh a and H. M. Abd-El-Bary, Electrochim. Acta, 2005, 4683–4689 CrossRef CAS
 .
. - W. Li, Q. He, S. Zhang, C. Pei and B. Hou, J. Appl. Electrochem., 2008, 38, 289–295 CrossRef CAS
 .
. - SingH, E. E. Ebenso and M. A. Quraishi, Int. J. Electrochem. Sci., 2012, 7, 3409–2414 CAS
 .
. - I. Ahamad and M. Quraishi, Corros. Sci., 2009, 51, 2006–2013 CrossRef CAS
 .
. - J. Aljourani, K. Raeissi and M. A. Golozar, Corros. Sci., 2009, 51, 1836–1843 CrossRef CAS
 .
. - H. M. Abd El-Lattef, V. M. Abbasov, L. I. Aliyeva, E. E. Qaismov and I. T. Ismayilov, Mater. Chem. Phys., 2013, 142, 502 CrossRef
 .
. - R. Mehdaoui, A. Khelifa, A. Khadraoui, O. Aaboubi, A. Hadj Ziane, F. Bentiss and A. Zarrouk, Res. Chem. Intermed., 2016, 42, 5509–5526 CrossRef CAS
 .
. - S. Zhang, Z. Tao, W. Li and B. Hou, Appl. Surf. Sci., 2009, 255, 6757–6763 CrossRef CAS
 .
. - M. Outirite, M. Lagrenee, M. Lebrini, M. Traisnel, C. Jama, H. Vezin and F. Bentiss, Electrochim. Acta, 2010, 55, 1670–1681 CrossRef CAS
 .
. - G. E. Badr, Corros. Sci., 2009, 51, 2529–2536 CrossRef CAS
 .
. - I. Ahamad, R. Prasad and M. A. Quraishi, Corros. Sci., 2010, 52, 1472–1481 CrossRef CAS
 .
. - F. Bentiss, M. Outirite, M. Traisnel, H. Vezin, M. Lagrenee, B. Hammouti, S. S. Al-Deyab and C. Jama, Int. J. Electrochem. Sci., 2012, 7, 1699–1723 CAS
 .
. - L. R. Chauhan and G. Gunasekaran, Corros. Sci., 2007, 49, 1143–1161 CrossRef CAS
 .
. - R. Ansari, M. A. Quraishi and A. Singh, Corros. Sci., 2014, 79, 5– CrossRef
 .
. - E. Chaieb, A. Bouyanzer, B. Hammouti and M. Benkaddour, Appl. Surf. Sci., 2005, 246, 199–206 CrossRef CAS
 .
. - M. Tourabi, K. Nohair, M. Traisnel, C. Jama and F. Bentiss, Corros. Sci., 2013, 75, 123–133 CrossRef CAS
 .
. - D. A. Lopez, S. N. Simison and S. R. de Sanchez, Electrochim. Acta, 2003, 48, 845–854 CrossRef CAS
 .
. - Z. Lukacs, J. Electroanal. Chem., 1999, 464, 68–75 CrossRef CAS
 .
. - A. S. Fouda, A. A. Ibrahim and W. T. El- behairy, Pharma Chem., 2014, 6(5), 144–157 Search PubMed
 .
. - A. S. Fouda, A. M. El-desoky and D. M. Ead, Int. J. Electrochem. Sci., 2013, 8, 8823–8847 CAS
 .
. - A. S. Fouda, A. A. Nazeer and A. Saber, J. Korean Chem. Soc., 2014, 58(2), 160–168 CrossRef CAS
 .
. - K. F. Khaled and N. S. Abdel-Shafi, Int. J. Electrochem. Sci., 2013, 8, 1409–1421 CAS
 .
. - K. S. Ashish and M. A. Quraishi, Corros. Sci., 2011, 53(4), 1288–1297 CrossRef
 .
. - H. Vashisht, I. Bahadur, S. Kumar, M. S. Goyal, G. Kaur, G. Singh, L. Katata and E. E. Ebenso, J. Mol. Liq., 2016, 224, 19–29 CrossRef CAS
 .
. - C. Mary Anbarasi and S. Rajendran, Res. J. Chem. Sci., 2012, 2(12), 21–26 Search PubMed
 .
. - S. Gowri, J. Sathiyabama, S. Rajendran, Z. Robert Kennedy and S. Agila Devi, Chem. Sci. Trans., 2013, 2(1), 275–281 CrossRef
 .
. - R. M. Silverstein, G. C. Bassler and T. C. Morrill, Spectrometric, Identification of organic Compounds, JohnWilley and Sons, New York, NY, vol. 95, 1986 Search PubMed
 .
. - J. Jeyasundari, S. Rajendran, R. Sayee Kannan and Y. Brightson Arul Jacob, Eur. Chem. Bull., 2013, 2(9), 585–591 CAS
 .
. - O. Obi-Egbedia and I. B. Obotb, Arabian J. Chem., 2013, 6, 211–223 CrossRef
 .
. - M. A. Deyab, Int. J. Hydrogen Energy, 2013, 38, 13511–13519 CrossRef CAS
 .
. - S. Thomas, N. V. Medhekar, G. S. Frankel and N. Birbilis, Curr. Opin. Solid State Mater. Sci., 2015, 19, 85–94 CrossRef CAS
 .
. - M. A. Deyab, J. Power Sources, 2013, 242, 86–90 CrossRef CAS
 .
. - R. Solmaz, E. Altunbas and G. Kardas, Mater. Chem. Phys., 2011, 125, 796–801 CrossRef CAS
 .
. - A. Youse, S. Javadian, N. Dalir, J. Kakemam and J. Akbari, RSC Adv., 2015, 5, 11697–11713 RSC
 .
. - M. A. Deyab, J. Power Sources, 2014, 268, 765–770 CrossRef CAS
 .
. - C. Y. Chao, L. F. Lin and D. D. A Macdonald, J. Electrochem. Soc., 1981, 128(6), 1187–1194 CrossRef CAS
 .
. - G. N. Mu, T. P. Zhao, M. Liu and T. Gu, Corrosion, 1996, 52(11), 853–856 CrossRef CAS
 .
.
|
| This journal is © The Royal Society of Chemistry 2017 |
Click here to see how this site uses Cookies. View our privacy policy here.  Open Access Article
 *a and
M. M. Motaweab


![[thin space (1/6-em)]](https://www.rsc.org/images/entities/char_2009.gif) exp[−ΔG°ads]/RT
exp[−ΔG°ads]/RT
![[thin space (1/6-em)]](https://www.rsc.org/images/entities/char_2009.gif) K
K![[thin space (1/6-em)]](https://www.rsc.org/images/entities/char_2009.gif) Kads = (−ΔH°ads/RT) + (ΔS°ads/R) + ln(1/55.5)
Kads = (−ΔH°ads/RT) + (ΔS°ads/R) + ln(1/55.5)

![[thin space (1/6-em)]](https://www.rsc.org/images/entities/char_2009.gif) Kads vs. (1/T) curves for the corrosion of carbon steel in 1 M HCl in the absence and presence of different concentrations of GRE.
Kads vs. (1/T) curves for the corrosion of carbon steel in 1 M HCl in the absence and presence of different concentrations of GRE.![[thin space (1/6-em)]](https://www.rsc.org/images/entities/char_2009.gif) exp(−E*a/RT)
exp(−E*a/RT)

![[thin space (1/6-em)]](https://www.rsc.org/images/entities/char_2009.gif) C.R. vs. 1/T) for carbon steel in 1.0 M HCl without and with different concentrations of GRE.
C.R. vs. 1/T) for carbon steel in 1.0 M HCl without and with different concentrations of GRE.
![[thin space (1/6-em)]](https://www.rsc.org/images/entities/char_2009.gif) C.R./T vs. 1000/T for carbon steel in 1.0 M HCl without and with different concentrations of GRE.
C.R./T vs. 1000/T for carbon steel in 1.0 M HCl without and with different concentrations of GRE.


![[double bond, length as m-dash]](https://www.rsc.org/images/entities/char_e001.gif) O, C
O, C![[double bond, length as m-dash]](https://www.rsc.org/images/entities/char_e001.gif) C and aliphatic C–H stretching vibration frequencies, respectively. Thus, GRE was characterized by IR spectroscopy.57 There was a shift in the spectra of the extract when carbon steel was immersed in it to form a corrosion product, as shown in Fig. 17. This shows that there is an interaction between the extract and the carbon steel substrate, which resulted in inhibition. The shifts in the spectra are considered to be a result of the interaction between the extracts and carbon steel through the functional groups presents in them. So, it can be affirmed that the functional group has coordinated with Fe2+ formed on the metal surface, resulting in the formation of an Fe2+ extract complex on the metal surface, which promotes the inhibition of the metal sample.
C and aliphatic C–H stretching vibration frequencies, respectively. Thus, GRE was characterized by IR spectroscopy.57 There was a shift in the spectra of the extract when carbon steel was immersed in it to form a corrosion product, as shown in Fig. 17. This shows that there is an interaction between the extract and the carbon steel substrate, which resulted in inhibition. The shifts in the spectra are considered to be a result of the interaction between the extracts and carbon steel through the functional groups presents in them. So, it can be affirmed that the functional group has coordinated with Fe2+ formed on the metal surface, resulting in the formation of an Fe2+ extract complex on the metal surface, which promotes the inhibition of the metal sample.

.
.
.
.
.
.
.
.
.
.
.
.
.
.
.
.
.
.
.
.
.
.
.
.
.
.
.
.
.
.
.
.
.
.
.
.
.
.
.
.
.
.
.
.
.
.
.
.
.
.
.
.
.
.
.
.
.
.
.
.
.
.
.
.
.
.


